
Cancer Supportive Care Drugs Market Size and Share
Market Overview
| Study Period | 2020 - 2031 |
|---|---|
| Market Size (2026) | USD 7.88 Billion |
| Market Size (2031) | USD 10.56 Billion |
| Growth Rate (2026 - 2031) | 6.04 % |
| Fastest Growing Market | Asia Pacific |
| Largest Market | North America |
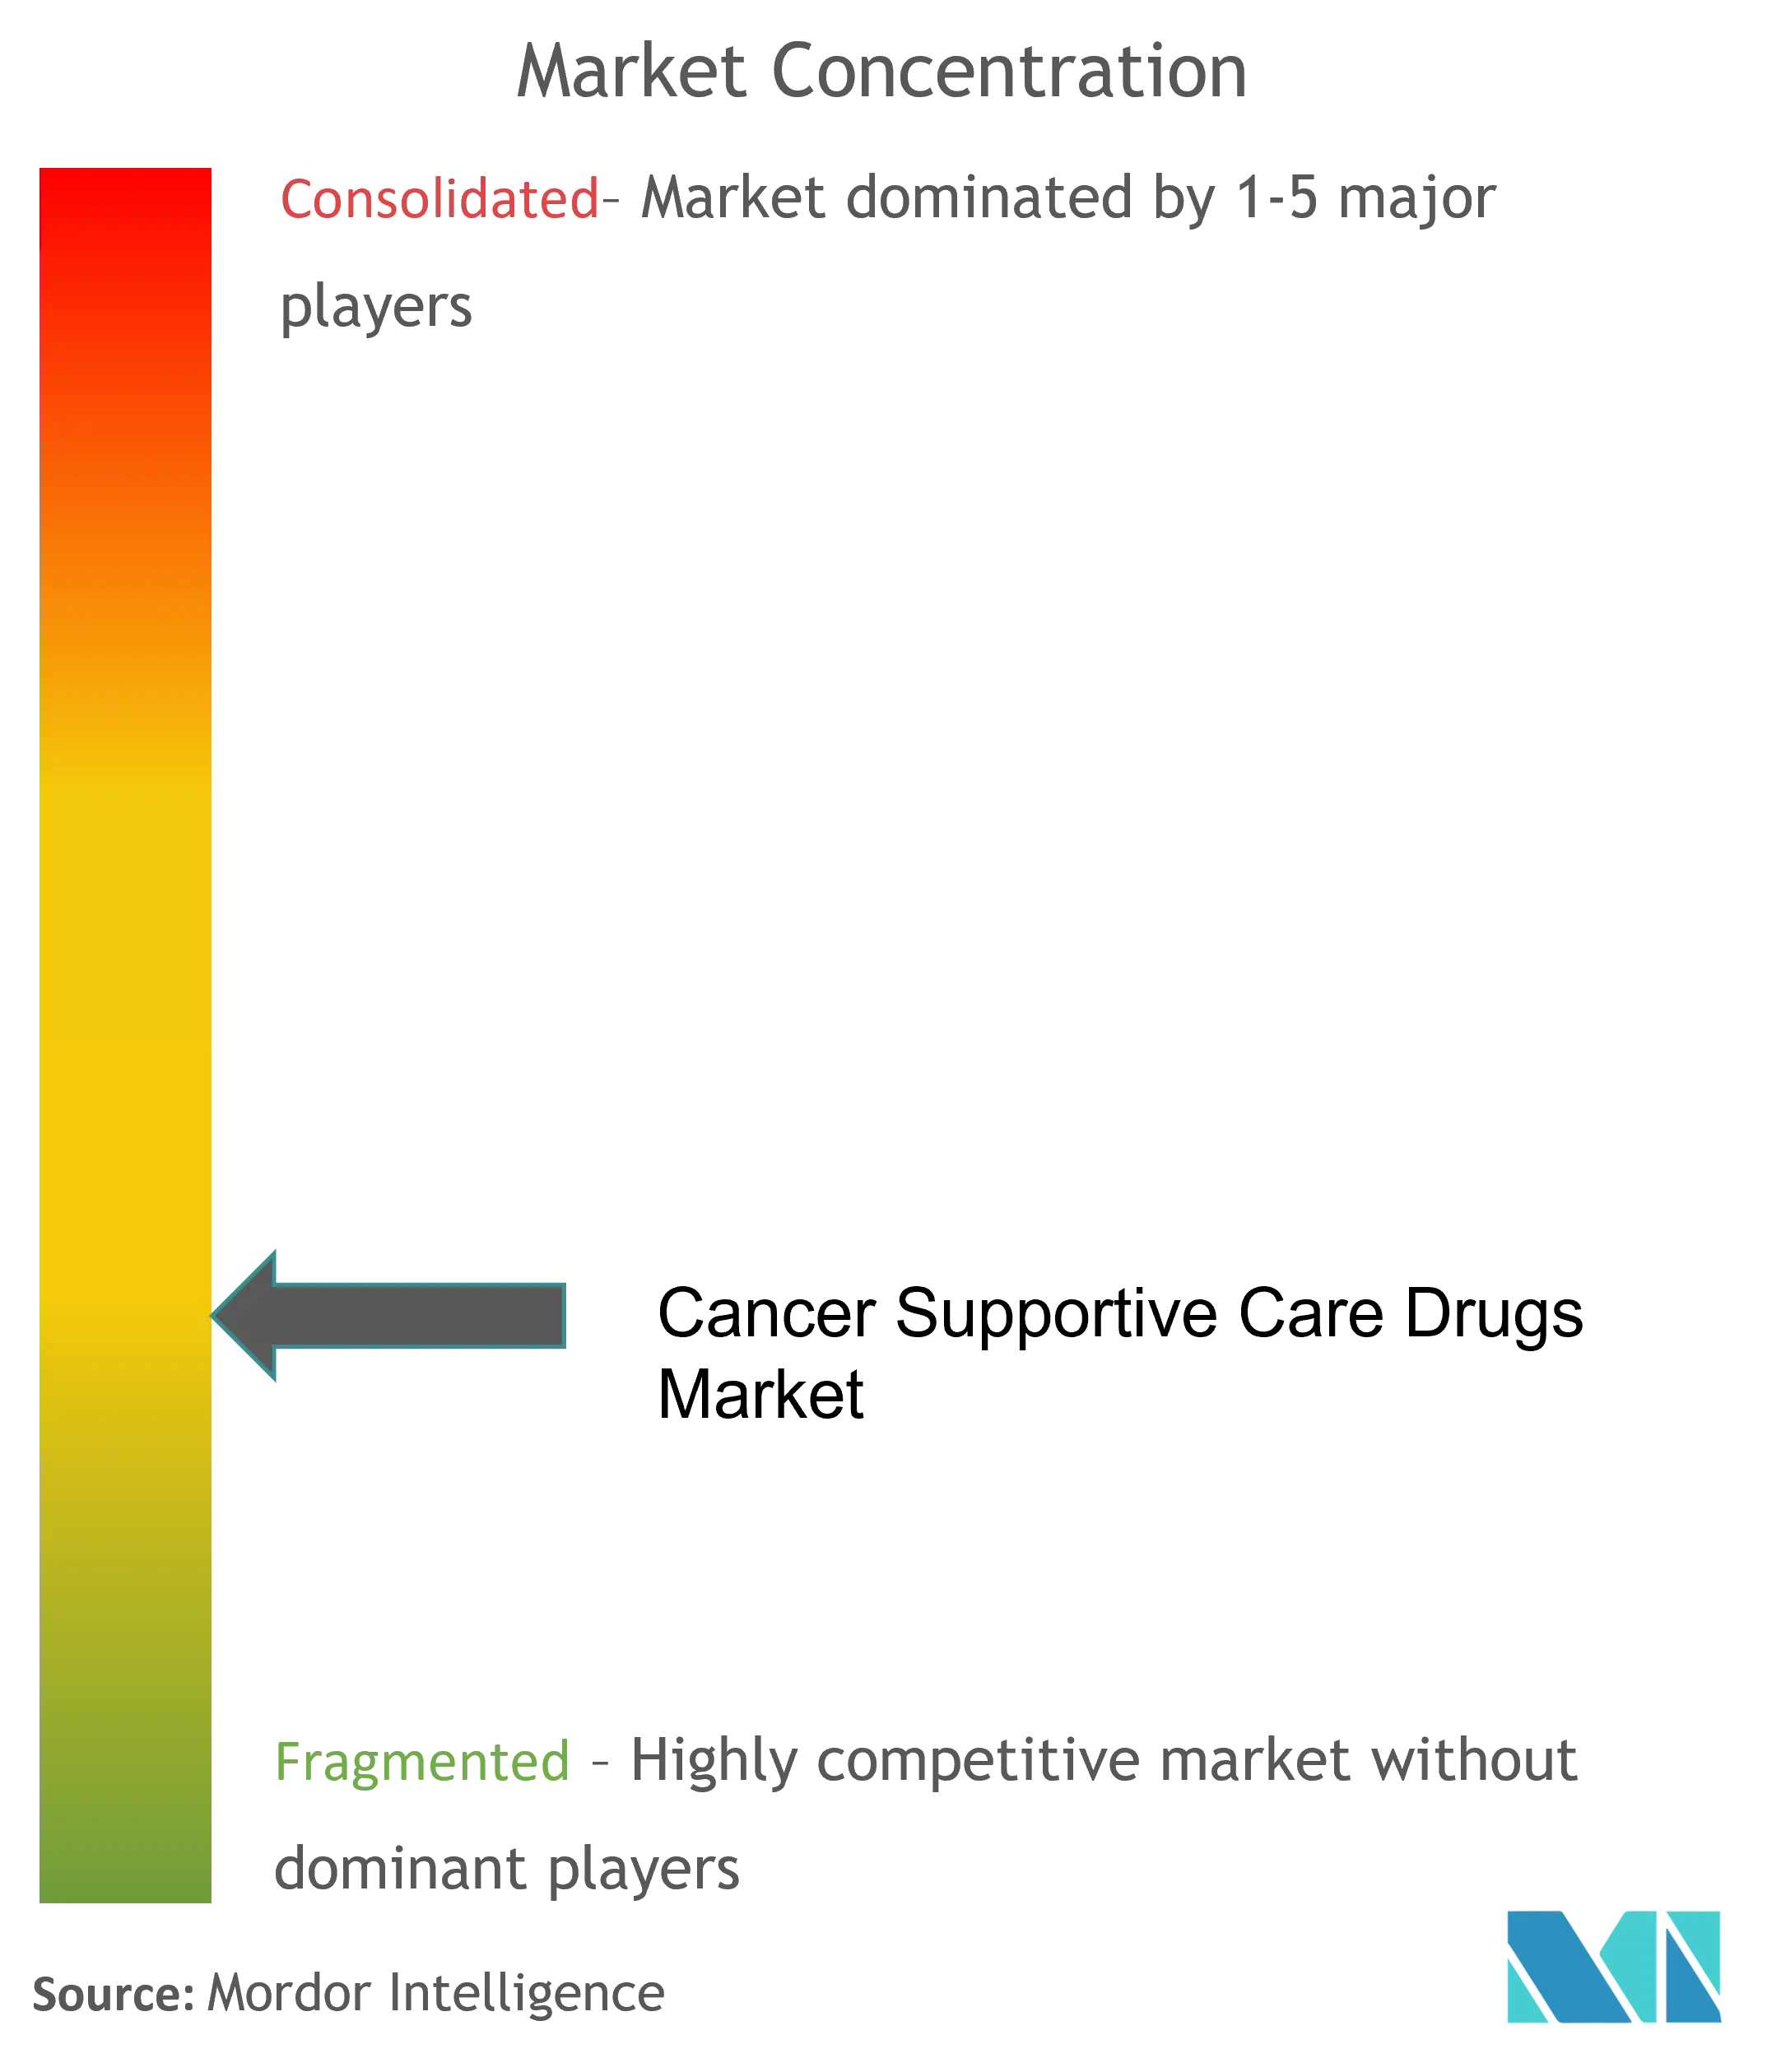
| Market Concentration | Medium |
Major Players *Disclaimer: Major Players sorted in no particular order Image © Mordor Intelligence. Reuse requires attribution under CC BY 4.0. | |
Cancer Supportive Care Drugs Market Analysis by Mordor Intelligence
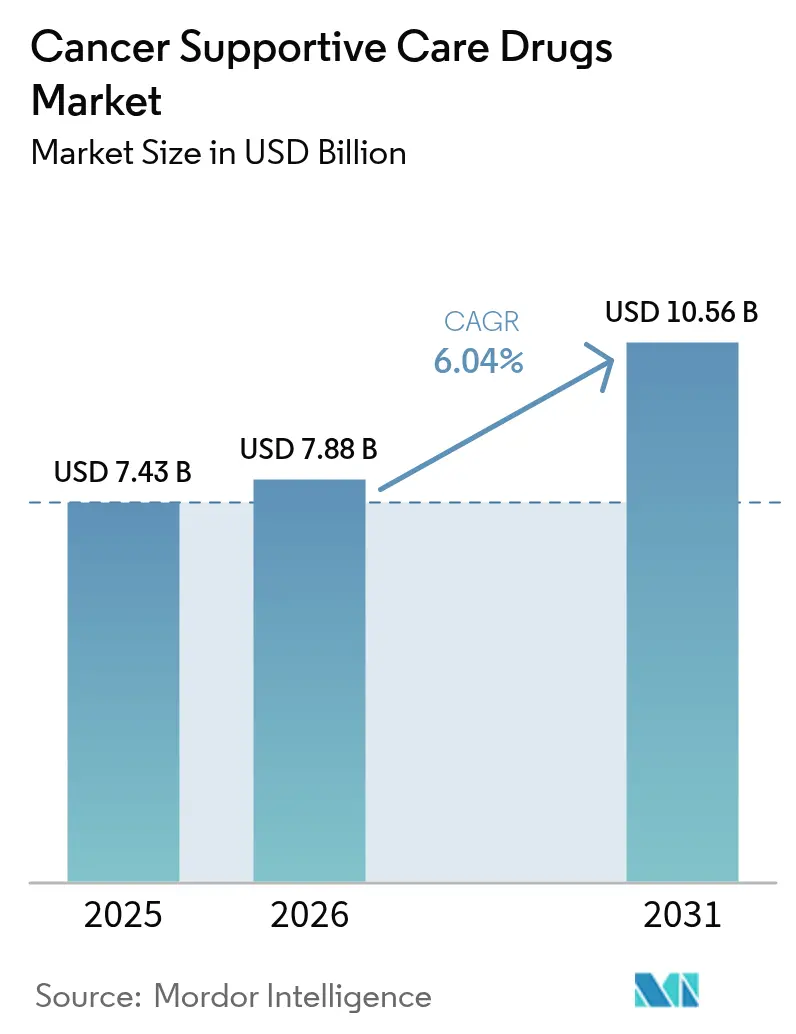
The cancer supportive care drugs market size in 2026 is estimated at USD 7.88 billion, growing from 2025 value of USD 7.43 billion with 2031 projections showing USD 10.56 billion, growing at 6.04% CAGR over 2026-2031. This expansion reflects rising global cancer incidence, wider use of multi-agent chemotherapy, and regulatory tailwinds for lower-priced biosimilars. Growing acceptance of value-based reimbursement encourages earlier, protocol-driven use of supportive therapies, while patient demand for self-administered formulations fuels innovation in oral and subcutaneous products. Competitive pressure intensifies as biosimilar G-CSFs and bone-protective agents win rapid uptake, trimming acquisition costs without sacrificing efficacy. At the same time, payers and providers focus on reducing hospital readmissions, a goal closely tied to more consistent supportive care adherence. These converging factors sustain a healthy outlook for the cancer supportive care drugs market through 2030.
Key Report Takeaways
- By drug class, G-CSFs held 34.62% of the cancer supportive care drugs market share in 2025, while topical agents are projected to advance at an 8.28% CAGR to 2031.
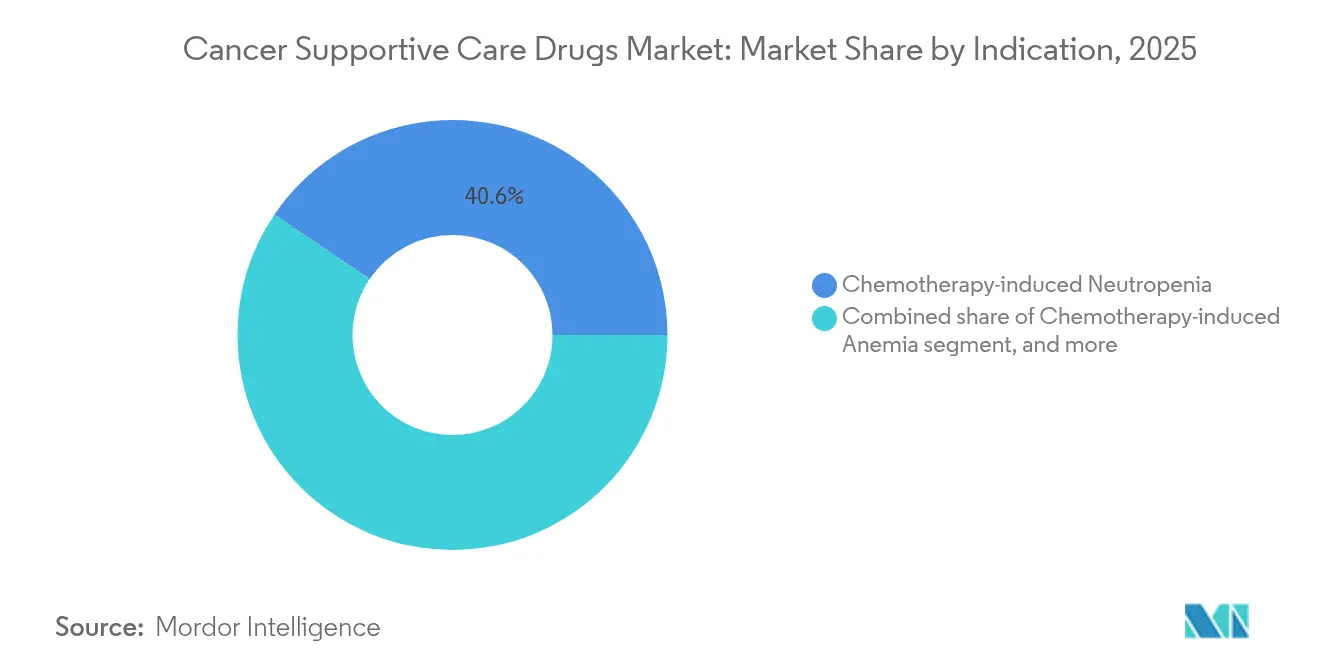
- By indication, chemotherapy-induced neutropenia accounted for 40.55% of demand in 2025; chemotherapy-induced anemia treatments are set to expand at an 8.52% CAGR through 2031.
- By distribution channel, hospital pharmacies commanded 51.76% of the cancer supportive care drugs market size in 2025, whereas online pharmacies are tracking a 9.12% CAGR between 2026-2031.
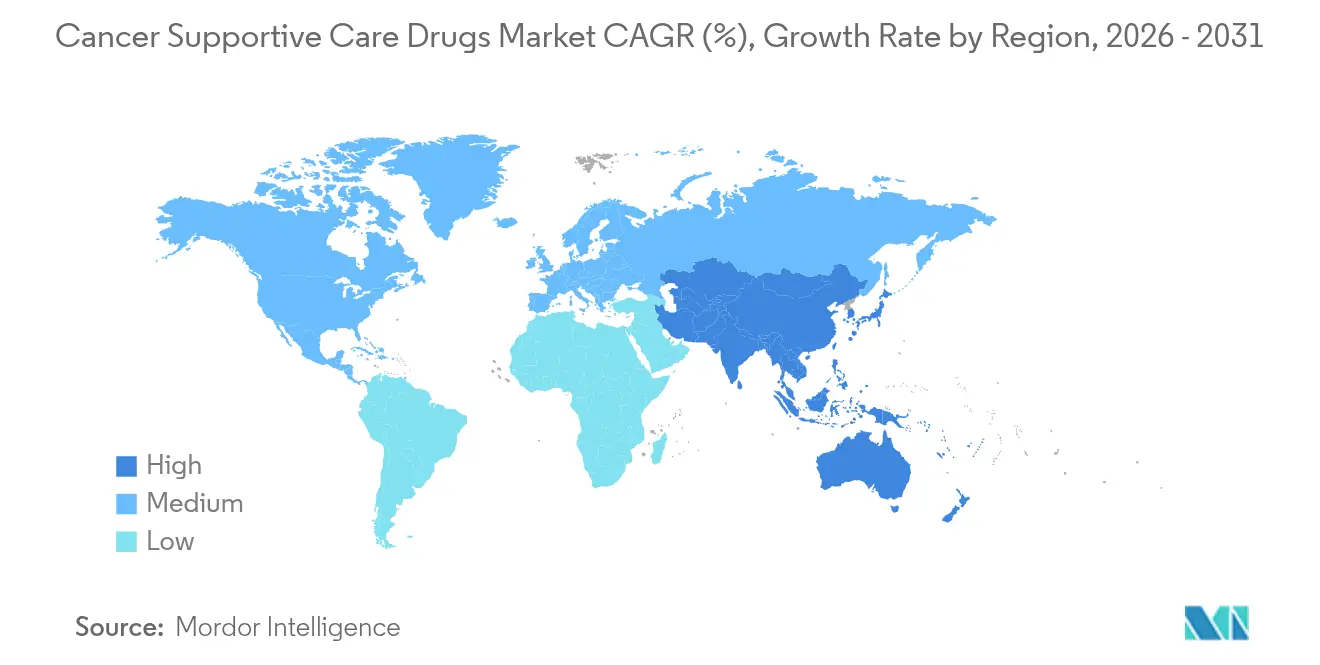
- By geography, North America led with 42.61% revenue share in 2025; Asia-Pacific is forecast to rise at a 7.31% CAGR through 2031.
Note: Market size and forecast figures in this report are generated using Mordor Intelligence’s proprietary estimation framework, updated with the latest available data and insights as of 2026.
Market Trends and Insights
Drivers Impact Analysis of Cancer Supportive Care Drugs Market*
| Driver | % Impact on CAGR Forecast | Geographic Relevance | Impact Timeline |
|---|---|---|---|
| Growing burden of cancer worldwide | +1.8% | Global, highest in Asia-Pacific and aging Western populations | Long term (≥ 4 years) |
| Rising adoption of chemotherapy and combination regimens | +1.5% | North America and Europe with advanced oncology infrastructure | Medium term (2-4 years) |
| Introduction of cost-effective biosimilars | +1.2% | Europe and North America leading; expanding to Asia-Pacific | Short term (≤ 2 years) |
| Shift toward value-based oncology care models | +0.9% | North America primary, Europe secondary adoption | Medium term (2-4 years) |
| Expansion of oral and subcutaneous formulations enabling home care | +0.8% | Developed markets initially; global rollout | Long term (≥ 4 years) |
| Source: Mordor Intelligence | |||
Growing Burden of Cancer Worldwide
New cases are rising sharply: IARC projects 28.4 million annual diagnoses by 2040, a 55% jump from 2020. Younger patients—those under 50—saw a 79% surge in cancer incidence between 1990 and 2019, leading to longer survival horizons and repeated treatment cycles. These demographic shifts lengthen exposure to myelosuppressive regimens, elevating demand for G-CSFs, antiemetics, and anemia therapies across the cancer supportive care drugs market. Economic pressure is equally significant; Europe alone spent EUR 199 billion on cancer in 2018, with EUR 32 billion earmarked for oncology medicines. Asia-Pacific growth is pronounced, exemplified by China’s projected USD 12.7 billion oncology spend by 2026, reinforcing a sizeable runway for supportive care uptake.
Rising Adoption of Chemotherapy and Combination Regimens
Combination protocols now dominate frontline therapy for solid tumors and hematologic malignancies, raising grade 3-4 hematologic toxicities by 40-60% versus monotherapy[1]. The result is steady utilization of prophylactic G-CSFs, erythropoiesis-stimulating agents, and next-generation antiemetics. Emerging antibody-drug conjugates, such as trastuzumab deruxtecan, layer unique pulmonary and gastrointestinal toxicities onto conventional adverse-event profiles, widening the clinical remit of the cancer supportive care drugs market. As oncologists integrate targeted agents with backbone chemotherapy, supportive care protocols broaden to encompass both cytotoxic and immune-mediated side-effect prevention.
Shift Toward Value-Based Oncology Care Models
The CMS Enhancing Oncology Model saved USD 6 million while maintaining quality metrics during its initial rollout. Such frameworks reward practices that avert emergency visits via proactive toxicity management, elevating the strategic value of antiemetics, growth factors, and pain control agents. Venture funding tracks this trend: Thyme Care secured USD 95 million to build analytics-driven care navigation that embeds guideline-directed supportive therapies. As adoption spreads to commercial payers, drug manufacturers must demonstrate real-world outcome gains to protect formulary positioning in the cancer supportive care drugs market.
Expansion of Oral and Subcutaneous Formulations Enabling Home Care
Development pipelines emphasize at-home dosing, from oral antiemetics that mitigate delayed nausea to on-body injector G-CSF systems that free patients from next-day clinic visits. These innovations align with pandemic-accelerated preferences for remote care and reduce facility overheads. Early launches in North America and Europe showcase adherence improvements, and the convenience premium supports modest pricing flexibility. Over the long term, improved quality-of-life metrics underpin formulary inclusion, reinforcing sustainable volume growth for the cancer supportive care drugs market.
Restraints Impact Analysis of Cancer Supportive Care Drugs Market*
| Restraints Impact Analysis | (~) % Impact on CAGR Forecast | Geographic Relevance | Impact Timeline |
|---|---|---|---|
| Emergence of targeted and immuno-oncology therapies with lower toxicity | −1.4% | Global; strongest in high-income regions | Medium term (2-4 years) |
| Safety concerns around opioid misuse and ESA-linked thrombotic events | −0.8% | North America primary concern; increasing global awareness | Short term (≤ 2 years) |
| Pricing pressures from reference-pricing and tender systems | −0.6% | Europe, parts of Latin America, and select Asia-Pacific procurement hubs | Medium term (2-4 years) |
| Growing use of digital symptom management reducing pharmacologic demand | −0.5% | Developed markets with high telehealth penetration | Long term (≥ 4 years) |
| Source: Mordor Intelligence | |||
Emergence of Targeted and Immuno-Oncology Therapies with Lower Toxicity
Immune checkpoint inhibitors and precision small-molecule inhibitors frequently spare bone marrow, leading to 60-70% lower neutropenia rates compared with traditional chemotherapy. Consequently, G-CSF volumes may moderate in regions where these modalities become first-line standards. Nonetheless, the supportive care mandate evolves rather than disappears: immune-related adverse events demand corticosteroids, endocrine replacement, and dermatologic agents that occupy adjacent therapeutic niches within the cancer supportive care drugs market. Manufacturers that pivot pipelines toward these emerging needs can offset erosion in legacy categories.
Safety Concerns Around Opioid Misuse and ESA-Linked Thrombotic Events
US oncology opioid prescriptions fell markedly, with the share of patients receiving no opioids rising. Regulatory scrutiny over misuse, combined with heightened prescriber liability, drives down median daily morphine equivalents, contributing to slower growth—or outright contraction—in the pain-management segment. Parallel caution surrounds erythropoiesis-stimulating agents after thrombotic signal detection, prompting risk-evaluation strategies that cap dosing and tighten patient selection. These pressures temper overall expansion of the cancer supportive care drugs market despite widening disease burden.
*Our forecasts treat driver/restraint impacts as directional, not additive. The impact forecasts reflect baseline growth, mix effects, and variable interactions.
Cancer Supportive Care Drugs Market Segment Analysis
By Drug Class:
Biosimilar-Powered Growth in Core CategoriesG-CSFs represented 34.62% of the cancer supportive care drugs market in 2025, underscoring their pivotal role in neutropenia prophylaxis. The segment’s resilience stems from predictable chemotherapy-induced marrow suppression across tumor types and strong endorsement in clinical guidelines. Rapid biosimilar uptake compresses unit prices but expands treatment penetration, keeping revenue on an upward trajectory. Topical agents, including steroid mouthwashes and barrier gels for mucositis, post an 8.28% CAGR to 2031 by addressing toxicities that gain visibility as survival lengthens. ESAs remain essential for anemia unresponsive to transfusion yet face moderate headwinds from safety labeling. Antiemetics sustain incremental gains, supported by fixed-dose combination launches targeting delayed emesis. Bisphosphonates and denosumab biosimilars grow steadily alongside rising skeletal-related-event risk in aging populations. Meanwhile, opioid demand softens, mirroring changing pain-control paradigms. Collectively, these trends illustrate how clinical-practice evolution and reimbursement shifts continually reshape the drug-class landscape within the cancer supportive care drugs market.
In revenue terms, the cancer supportive care drugs market size for G-CSFs is projected to expand briskly through the forecast horizon, even as price competition intensifies. Conversely, opioid revenues diminish due to lower average daily doses despite stable patient counts, validating payer emphasis on risk-mitigating alternatives. Continuous innovation in topical and subcutaneous formats helps manufacturers diversify beyond commoditized injectables, anchoring sustainable double-digit growth in newer subclasses.


By Indication:
Heightened Focus on Quality-of-Life EndpointsChemotherapy-induced neutropenia retained 40.55% share of the cancer supportive care drugs market in 2025 thanks to its universal prevalence and compelling clinical consequences. Infectious complications drive longer hospital stays, reinforcing prophylactic intervention economics. Anemia therapies grow faster at 8.52% CAGR, propelled by mounting evidence that hemoglobin optimization enhances functional status and supports dose intensity. Nausea and vomiting management remains a foundational pillar, yet evolving emetogenic profiles prompt more nuanced antiemetic layering. Bone-loss protocols gain traction as metastatic survivorship extends beyond five years for many solid tumors, especially breast and prostate cancer. Pain management indicates gradual pivot toward multimodal regimens combining non-pharmacologic interventions with lower opioid exposure, a trend set to influence the cancer supportive care drugs market size for analgesics.
Supportive care for emerging toxicities tied to antibody-drug conjugates—such as interstitial lung disease—broadens the indication slate, hinting at pipeline opportunities. Over the forecast period, the cancer supportive care drugs market share for anemia therapies is set to climb, narrowing the gap with neutropenia interventions as payers relax ESA restrictions under stringent monitoring programs.
By Distribution Channel:
Omnichannel Access Redefines Patient ExperienceHospital pharmacies controlled 51.76% of the cancer supportive care drugs market size in 2025, leveraging embedded clinician relationships and on-site infusion centers. Their dominance persists in acute-care settings where immediate adverse-event resolution is imperative. Retail chains cater to stable patients on maintenance antiemetics or oral pain agents, benefiting from convenience and loyalty programs. Online pharmacies, expanding at 9.12% CAGR, address growing preference for home delivery, particularly among immunocompromised individuals seeking to minimize hospital exposure. Telepharmacy consultation tools bolster adherence, while transparent pricing resonates with value-oriented consumers. Specialty pharmacies integrated within large health systems consolidate high-touch services, such as temperature-controlled logistics for biologics and insurance-navigation support. These models collectively enhance therapeutic continuity, reinforcing the omnichannel nature of the cancer supportive care drugs market.
Over time, the cancer supportive care drugs industry expects digital channels to capture incremental share as regulatory frameworks mature around e-prescribing of controlled substances. Yet hospital dispensaries remain critical for first-cycle chemotherapy support, illustrating the enduring coexistence of centralized and decentralized distribution paradigms.
Geography Analysis
North America Cancer Supportive Care Drugs Market
North America accounted for 42.61% of global revenue in 2025, underpinned by advanced oncology infrastructure and widespread insurance coverage that reimburses high-cost biologics. Value-based pilots such as the Enhancing Oncology Model demonstrate measurable savings, encouraging replication across commercial payers and fortifying guideline-aligned supportive care uptake.
Europe Cancer Supportive Care Drugs Market
Europe stands as the second-largest regional market. Aggressive biosimilar procurement cut cancer-medicine prices by up to 97.8% in select countries, broadening access and curbing budget impact. National health systems devote substantial outlays—EUR 32 billion in 2018—for oncology drugs, evidencing strong political commitment to supportive therapy coverage. Reimbursement variability across member states prompts manufacturers to tailor pricing strategies, but widespread HTA frameworks ensure cost-effectiveness remains front-of-mind.
APAC Cancer Supportive Care Drugs Market
Asia-Pacific is the fastest-growing region with a 7.31% CAGR, energized by demographic aging, expanding middle classes, and broader insurance penetration. China’s oncology expenditure is on course to reach USD 12.7 billion by 2026, while India liberalizes foreign-direct-investment norms to spur domestic biologics manufacture. Government screening programs and rising diagnostic literacy heighten early detection rates, translating into larger treated cohorts and sustained demand in the cancer supportive care drugs market.
LATAM and MEA Cancer Supportive Care Drugs Market
Latin America and the Middle East & Africa constitute smaller but steadily advancing markets. Procurement consortia in Brazil and Mexico negotiate volume-based discounts that align with biosimilar entry timelines. Meanwhile, Gulf Cooperation Council members invest in tertiary cancer centers, importing protocol-driven supportive care as part of broader medical-tourism aspirations. Collectively, these geographies add incremental volume that bolsters global growth momentum.
Regulatory Landscape
Regulation for cancer supportive care drugs centers on biosimilar approval pathways, medically accepted use criteria, and supply-continuity measures, which together shape formulary access and protocol-driven prescribing. In the United States, Medicare coverage for oncology indications often hinges on compendia-based determinations of medically accepted indications under 42 CFR 414.930, reinforcing guideline-aligned reimbursement for supportive agents used with chemotherapy.
In 2026 regulators expanded access through biosimilar decisions and shortage-mitigation actions. The FDA approved additional filgrastim and pegfilgrastim biosimilars in 2026, including Accord BioPharma approvals, while in Europe the EMA CHMP issued positive opinions in June 2026 for Denosumab Ascend and Nylaspeg, underscoring sustained regulatory support for lower-cost options in neutropenia management and bone-complication prevention. Separately, the Netherlands Ministry of Health, Welfare and Sport used a temporary exemption mechanism in April 2026 to allow supply of bendamustine without a trade permit due to shortages, showing how national authorities intervene to protect oncology treatment continuity.
Competitive Landscape
Competition is moderate, with diversified multinationals relying on extensive portfolios and lifecycle management to defend share. Amgen reported 19% revenue growth in 2024, buoyed by oncology assets such as BLINCYTO and the recent launch of IMDELLTRA, a first-in-class DLL3-targeting bispecific. The company also agreed to grant Sandoz US entry for denosumab biosimilars no later than May 2025, illustrating a pragmatic approach to patent-expiry dynamics.
Roche and Johnson & Johnson leverage integrated pipelines that span cytotoxics, monoclonals, and supportive agents, enabling bundled contracting. J&J’s AKEEGA, combining a PARP inhibitor with standard hormonal therapy, cut prostate-cancer progression risk by 50%, indirectly extending the need for anemia and bone-health support. Pfizer advances novel cachexia therapy ponsegromab, with early trials showing 2-6 lb weight gain versus placebo loss[3], addressing an unmet supportive niche.
Biosimilar specialists such as Viatris and Fresenius Kabi intensify price competition, while digital-health entrants like Thyme Care secure venture backing to integrate remote toxicity monitoring into payer workflows. Strategic alliances proliferate: Geisinger partnered with OncoHealth to embed real-time supportive-care guidance, and Amazon-owned PillPack expands oncology fulfillment capabilities. These moves underscore the ecosystem’s pivot toward service-drug hybrids that optimize outcomes and contain costs within the cancer supportive care drugs market.
Cancer Supportive Care Drugs Industry Leaders
-
Amgen Inc.
-
Novartis AG
-
Merck & Co. Inc
-
Johnson & Johnson
-
F. Hoffmann-La Roche AG
- *Disclaimer: Major Players sorted in no particular order
Cancer Supportive Care Drugs Market Companies Covered in this Report
- Amgen
- Johnson & Johnson
- Roche
- Novartis AG (Sandoz & Hexal)
- Teva Pharmaceutical Industries
- Pfizer
- Sanofi
- Helsinn Healthcare
- Heron Therapeutics Inc.
- Dr. Reddy’s Laboratories
- Sun Pharmaceuticals Industries
- Ipsen
- Kyowa Kirin Co. Ltd.
- Otsuka
- Accord Healthcare
- Fresenius
- Lupin
Market Opportunities and Future Outlook
Biosimilar penetration and differentiated formulation work remain clear whitespace areas across the core supportive classes that drive the market, particularly neutropenia prophylaxis and CINV management. The 2026 U.S. approvals for G-CSF biosimilars expand the set of substitutable options for protocol-driven use, supporting tender participation, broader payer coverage, and more consistent prophylaxis utilization in high-risk regimens. Ready-to-use and excipient-differentiated antiemetic formulations create room for lifecycle management and hospital pharmacy uptake where preparation burden, compatibility, and safety considerations influence product selection.
Care delivery is also moving toward integrated models that tie medications to navigation and symptom-management workflows, creating partnering opportunities for manufacturers and specialty pharmacies. This is visible in value-based oncology program developments and in the expansion of remote and home-oriented dosing preferences highlighted by the market shift toward oral and subcutaneous formulations. Evidence of near-term commercial whitespace in CINV support includes the FDA approval (June 2026) of Azurity Pharmaceuticals Aprepitant Injectable Emulsion, a ready-to-use option that broadens hospital and outpatient infusion center choices in antiemetic prophylaxis.
Recent Industry Developments in Cancer Supportive Care Drugs Market
- June 2026: Azurity Pharmaceuticals' Aprepitant Injectable Emulsion was approved by the FDA for antiemetic prophylaxis in patients undergoing highly emetogenic chemotherapy. The ready-to-use formulation expands hospital and outpatient infusion center options, reducing preparation time and potential dosing errors in busy oncology workflows.
- June 2026: The EMA's CHMP issued positive opinions for Denosumab Ascend and Nylaspeg, signaling broader access to cost-lowering bone-modifying therapies in cancer care. These decisions can influence procurement strategies and payer negotiations in bone health management for oncology patients.
- April 2026: The Netherlands Ministry of Health, Welfare and Sport activated a temporary exemption to allow bendamustine supply without a trade permit due to shortages, preserving continuity of care in regimens requiring this agent. The move demonstrates how national authorities intervene to protect oncology treatment continuity and may influence formulary flexibility and stock management in supportive care pathways.
Cancer Supportive Care Drugs Market Report Scope and Research Methodology
Market Definition and Coverage
This market covers prescription drugs used alongside cancer treatment to prevent, reduce, or manage therapy-related side effects and complications, so patients can stay on treatment and maintain daily functioning. It reflects global revenue generated from these supportive medicines across care settings.
Scope exclusions: Non-drug supportive care such as nutrition supplements, counseling services, and durable medical equipment are excluded from this sizing.
Segments Covered in This Report
- By Drug Class
- G-CSFs
- ESAs
- Antiemetics
- Bisphosphonates
- Opioids
- NSAIDs
- Topical Agents
- Other Drug Classes
- By Indication
- Chemotherapy-induced Neutropenia
- Chemotherapy-induced Anemia
- Nausea & Vomiting
- Cancer-related Bone Loss
- Cancer Pain
- Oral & Dermal Mucositis
- By Distribution Channel
- Hospital Pharmacies
- Retail Pharmacies
- Online Pharmacies
- Geography
- North America
- United States
- Canada
- Mexico
- Europe
- Germany
- United Kingdom
- France
- Italy
- Spain
- Rest of Europe
- Asia-Pacific
- China
- Japan
- India
- Australia
- South Korea
- Rest of Asia-Pacific
- Middle East & Africa
- GCC
- South Africa
- Rest of Middle East & Africa
- South America
- Brazil
- Argentina
- Rest of South America
- North America
Data Sources, Market Sizing, and Validation
Desk Research
Desk work starts with mapping the supportive care drug universe and confirming where revenue is actually booked in oncology care pathways. We rely on public, non-paywalled sources such as the World Health Organization, the US CDC, the US National Cancer Institute (SEER program), OECD health statistics, and publications from peer-reviewed oncology journals to anchor incidence, treatment patterns, and side effect prevalence.
To translate demand into value, we also review company filings and investor presentations for revenue mix cues, regulatory agency releases for approval timelines, and reputable press for major guideline or reimbursement shifts. Paid subscriptions are used selectively for company financials and intelligence, patent databases, and shipment-level import and export signals where they help verify product availability and timing. The sources listed here are illustrative, and many other references were used to collect data, cross-check assumptions, and clarify open questions.
Primary Interviews and Surveys
Primary work is used to test whether the modeled use of supportive drugs matches real-world oncology practice, including inputs from clinicians, hospital pharmacy teams, distributors, and payer-side stakeholders. For a global market, feedback is gathered across the Americas, EMEA, and APAC to validate differences in supportive care protocols, biosimilar uptake, and channel mix, and then to align the final assumptions with what is being prescribed and stocked today.
Distribution of primary research fieldwork respondents
| Company type | Respondent position | Region |
|---|---|---|
| Top tier: 32% | CXOs: 18% | APAC: 37% |
| Mid tier: 50% | Functional/Unit leaders: 25% | EMEA: 37% |
| Smaller Players: 18% | Managers: 57% | Americas: 26% |
Market-Sizing & Forecasting
Sizing is built using a top-down approach where cancer incidence and treatment volumes are translated into a supportive care demand pool, and then into revenue by applying realistic utilization and price assumptions. In practice, we start from treated patient counts by major tumor types and therapy setting, layer in the probability of key adverse events, and then apply expected supportive drug use per cycle or per episode.
The model is shaped by market fingerprints that can be checked repeatedly, such as chemotherapy and radiotherapy procedure volumes, guideline-driven prophylaxis rates for nausea and neutropenia, anemia management triggers, and the share of outpatient infusion versus inpatient oncology care. Pricing is handled with a simple but disciplined logic, where list-to-net adjustments, biosimilar penetration, and therapy switching are reflected so the average selling price trend does not drift away from what stakeholders are seeing. Results are corroborated with selective bottom-up approximations like sampled product class roll-ups and ASP times volume checks from channel conversations, and gaps are handled by using regional proxy rates that are then re-tested in follow-up calls.
For forecasting, scenario analysis is applied around a base case that primary respondents generally align with, and it is supported by variable-level outlooks for cancer burden, treatment intensity, supportive care guideline adoption, and the pace of biosimilar uptake. When one variable moves sharply, the downstream impact is recalculated so the forecast remains explainable and reproducible.
Data Validation & Update Cycle
Validation happens in layers, starting with internal checks to confirm that patient volumes, event rates, and pricing assumptions reconcile with known clinical practice and public signals. We compare outputs with independent indicators such as oncology procedure trends, therapy mix shifts, and the expected timing of new approvals or loss of exclusivity, and then we investigate any outliers before final sign-off.
A second analyst review is used to challenge key assumptions and make sure arithmetic and logic are consistent across regions and drug classes. The report is refreshed annually, and interim updates are made when material events occur, such as major guideline changes, reimbursement shifts, or meaningful biosimilar launches. Before delivery, a fresh pass is completed so clients receive the most current view available at that time.
Mordor Intelligence's Cancer Supportive Care Drugs Market Sizing Compared With Other Published Estimates
It is normal to see different market values for cancer supportive care drugs because each publisher draws the line differently on what is counted and how demand is converted into dollars. The spread usually comes from scope choices, pricing treatment (especially net pricing and biosimilars), and how often key assumptions are updated.
For this market, the biggest gap drivers tend to be whether adjacent non-drug supportive care is included, how broadly supportive categories are grouped, and whether the model uses treated patient based utilization versus broad healthcare spend assumptions. Some estimates also apply aggressive price and volume expansion in later years without re-checking guideline adoption and channel mix changes, which can push the starting year size upward and flatten the implied growth path.
Benchmark comparison
| Source | Market Size | Gaps in Research Methodology |
|---|---|---|
| Mordor Intelligence | USD 7.88 B (2026) | |
| Industry Publisher A | USD 21.76 B (2025) | This figure appears to use a broader supportive care basket and a different year anchor, which can pull in more classes and higher price assumptions, especially when net pricing and biosimilar erosion are not separated clearly. |
| Industry Publisher B | USD 24.38 B (2025) | The estimate is likely based on a wider definition across indications and channels, and it may treat supportive care as a larger oncology adjunct spend pool rather than tying volumes to treated patients and adverse event driven utilization. |
The table shows that scope and pricing logic are doing most of the work behind the differences. When supportive drugs are counted only when they are prescribed to manage therapy-related adverse events, and when ASPs are refreshed for biosimilar mix and list-to-net effects, the value stays closer to an auditable demand pool, which is the approach applied by Mordor Intelligence.
Key Questions Answered in the Report
What is the expected size of the cancer supportive care drugs market by 2031?
The market is projected to reach USD 10.56 billion by 2031, growing at a 6.04% CAGR.
Which drug class currently leads the cancer supportive care drugs market?
G-CSFs lead with 34.62% share, driven by their critical role in neutropenia prophylaxis.
Why are biosimilars important in supportive oncology?
Biosimilars already account for 81% of prescriptions in key categories and cut prices by up to 67%, expanding patient access and reducing healthcare costs.
Which region is growing fastest in the cancer supportive care drugs market?
Asia-Pacific is advancing at a 7.31% CAGR, propelled by aging populations and widening insurance coverage.
How are value-based care models influencing supportive drug use?
Programs like the CMS Enhancing Oncology Model reward practices that deploy supportive therapies to prevent costly complications, driving more consistent use of growth factors and antiemetics.
What safety concerns are limiting opioid growth in cancer care?
Rising scrutiny of misuse has lowered median morphine-equivalent doses and increased reliance on multimodal pain strategies, constraining opioid revenue growth in supportive care.