Cancer Gene Therapy Market Size and Share
Market Overview
| Study Period | 2019 - 2030 |
|---|---|
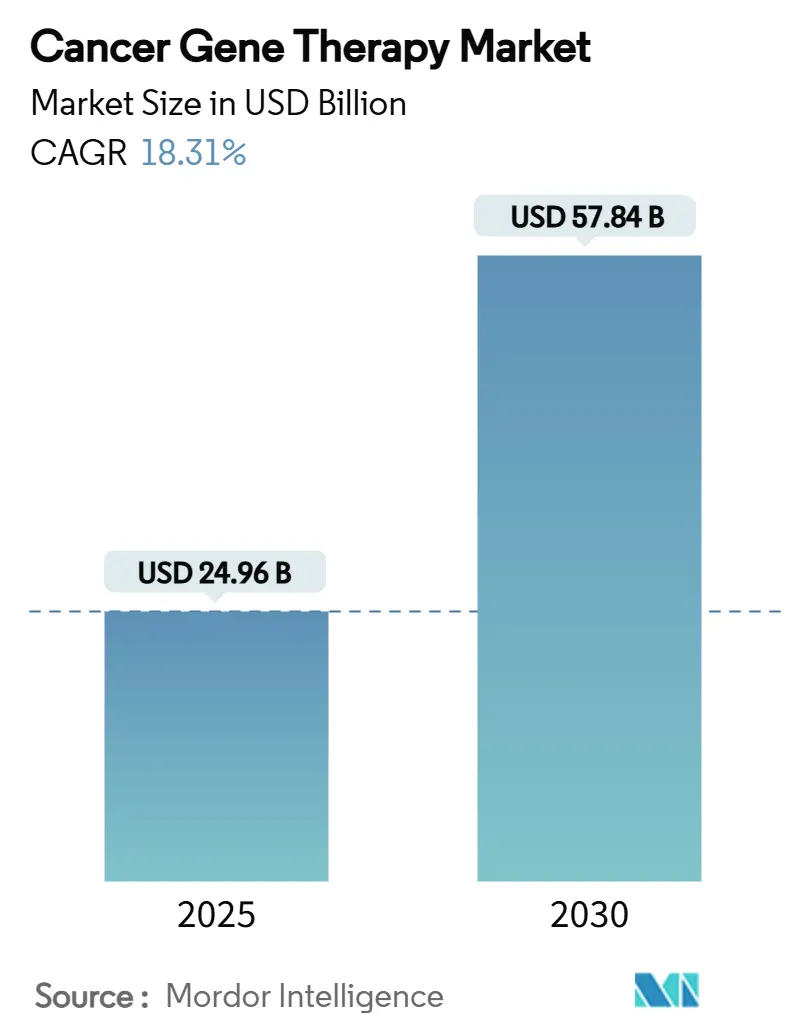
| Market Size (2025) | USD 24.96 Billion |
| Market Size (2030) | USD 57.84 Billion |
| Growth Rate (2025 - 2030) | 18.31% CAGR |
| Fastest Growing Market | Asia Pacific |
| Largest Market | North America |
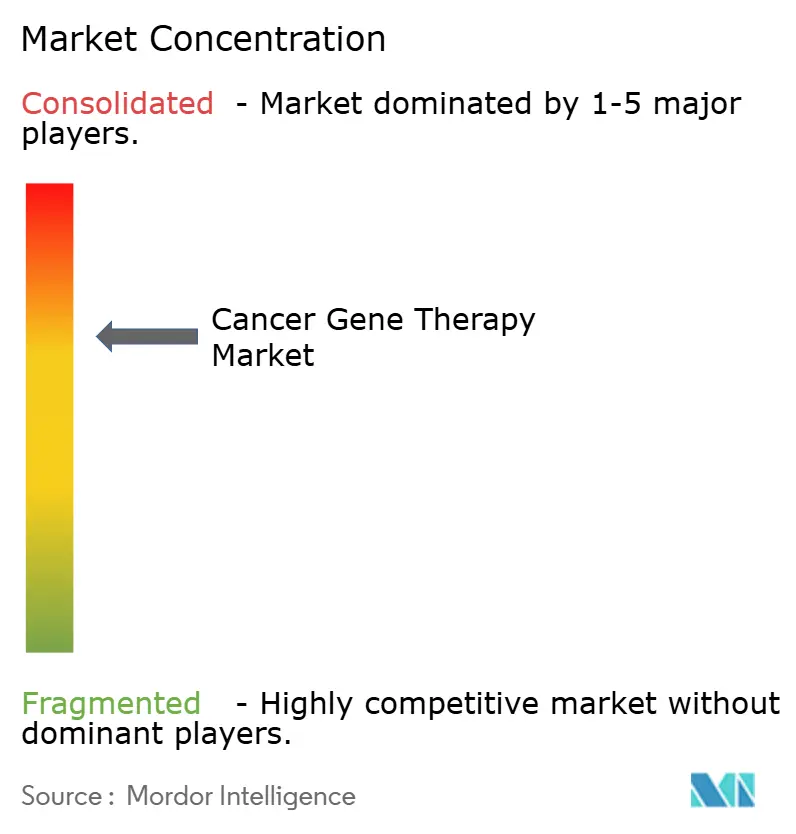
| Market Concentration | Medium |
Major Players*Disclaimer: Major Players sorted in no particular order Image © Mordor Intelligence. Reuse requires attribution under CC BY 4.0. |
|
Cancer Gene Therapy Market Analysis by Mordor Intelligence
The Cancer Gene Therapy Market size is estimated at USD 24.96 billion in 2025, and is expected to reach USD 57.84 billion by 2030, at a CAGR of 18.31% during the forecast period (2025-2030).
Growth is being propelled by landmark regulatory approvals, continued manufacturing scale-up, and maturing delivery technologies that are translating laboratory breakthroughs into routine oncology practice. Robust demand stems from rising cancer incidence, the rapid rollout of precision medicine programs, and the expanding pipeline of late-stage assets targeting both hematologic and solid tumors. Intensifying competition is evidenced by high-profile acquisitions and strategic alliances around vector platforms, while regional capacity additions in North America, Europe, and Asia-Pacific de-risk supply constraints. Collectively, these dynamics position the cancer gene therapy market for sustained double-digit expansion through the end of the decade.
Key Report Takeaways
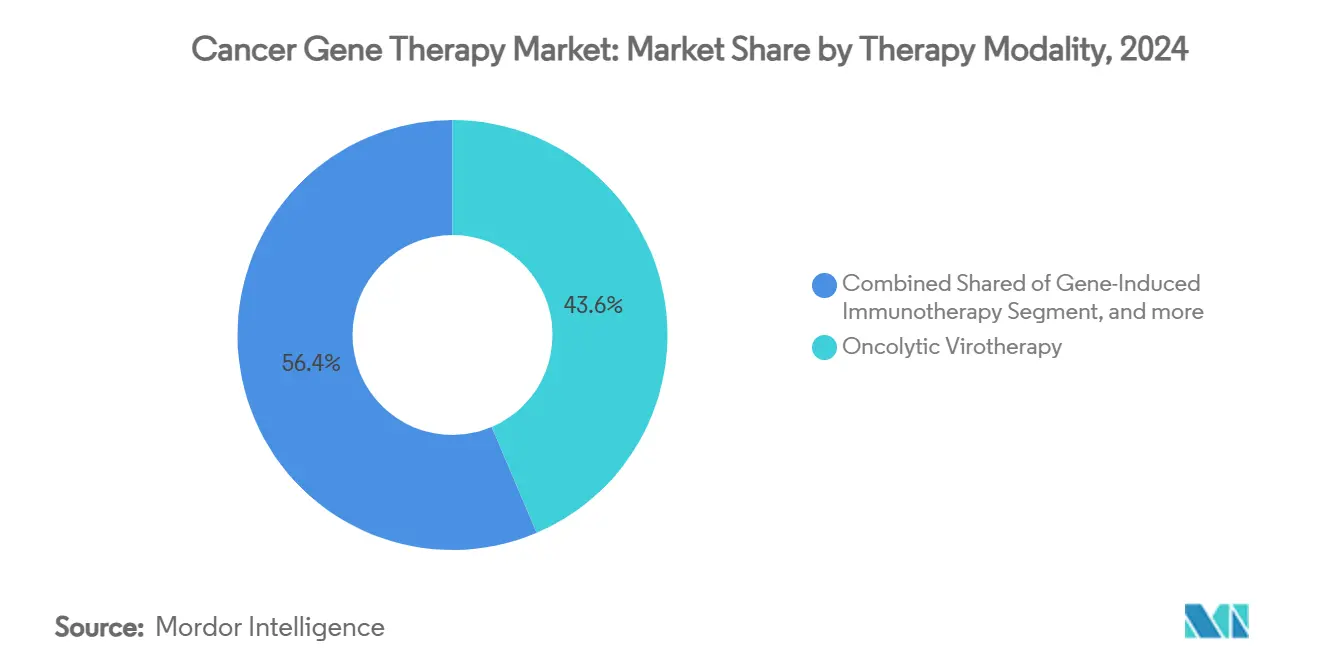
- By therapy modality, oncolytic virotherapy led with 43.61% revenue share in 2024, whereas CRISPR-based gene editing is projected to grow at a 23.22% CAGR to 2030.
- By vector type, viral systems captured 61.82% of the cancer gene therapy market share in 2024, while non-viral systems are anticipated to expand at a 29.08% CAGR through 2030.
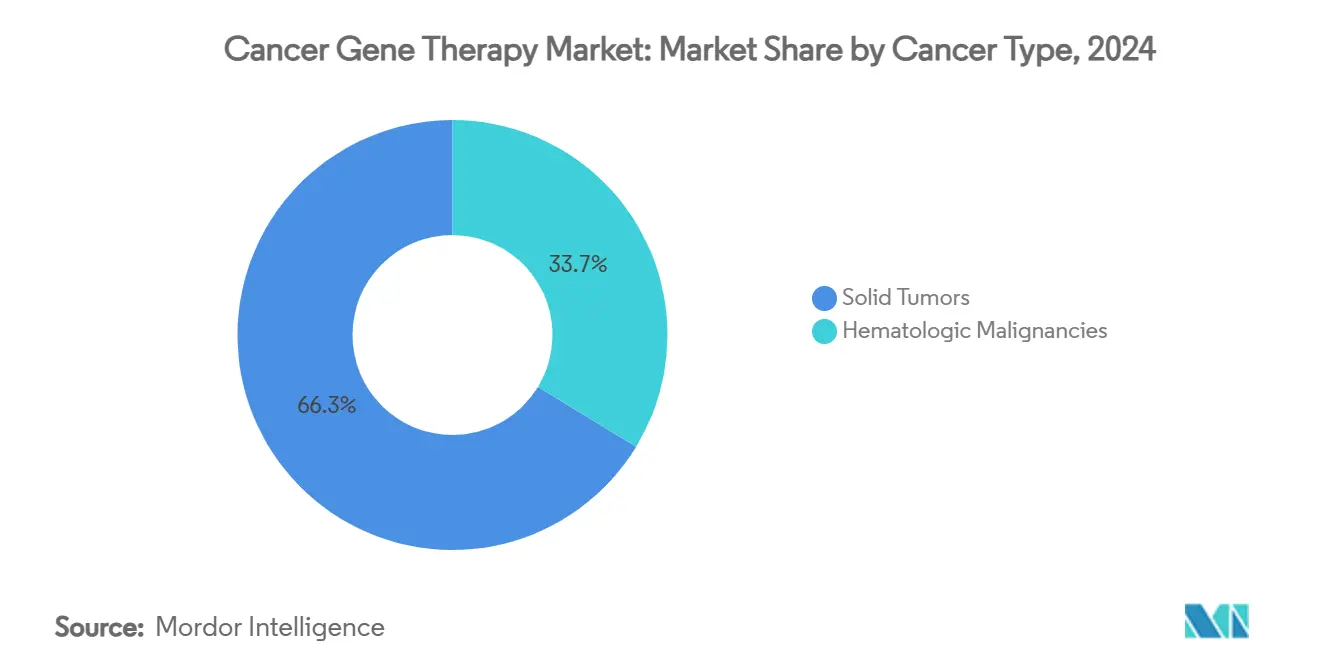
- By cancer type, hematologic malignancies commanded 33.72% of the cancer gene therapy market size in 2024, and solid tumors are forecast to advance at a 28.07% CAGR between 2025 and 2030.
- By end user, hospitals & cancer centers held 47.24% share of the market in 2024, whereas biotechnology & pharmaceutical companies exhibit the fastest growth at 26.91% CAGR to 2030.
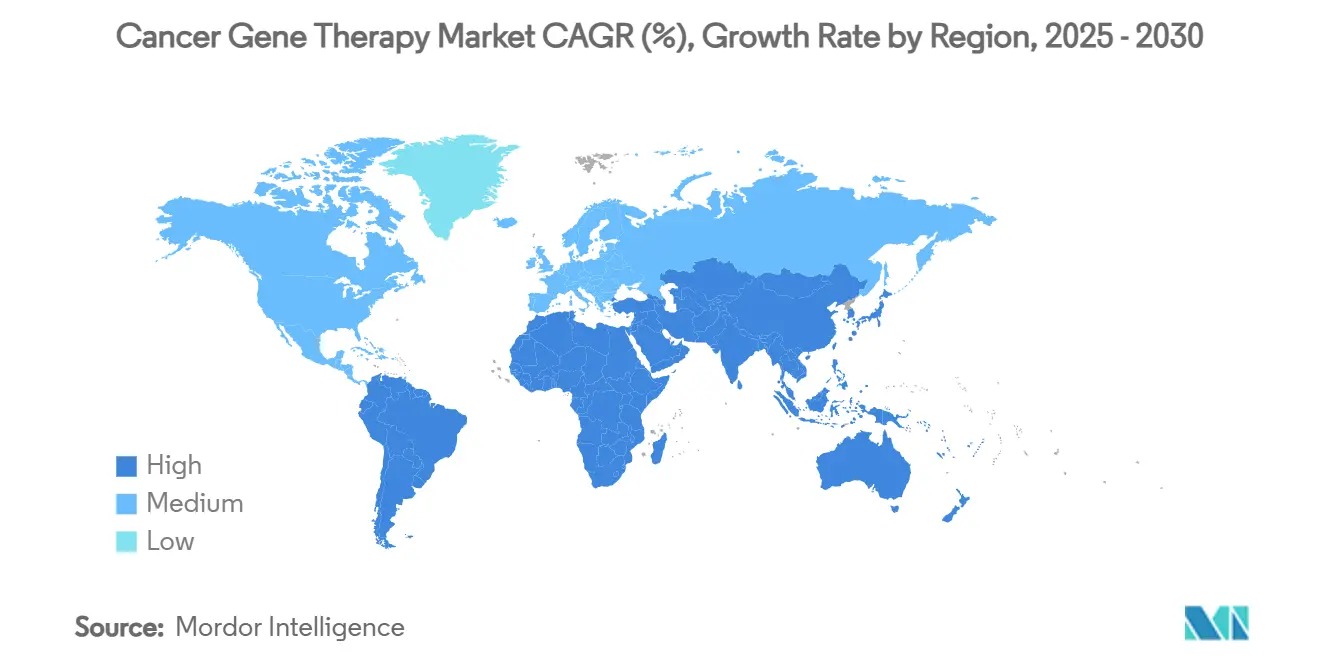
- By geography, North America accounted for 39.16% of global revenues in 2024, while Asia-Pacific is poised for the highest regional CAGR of 30.97% through 2030.
Global Cancer Gene Therapy Market Trends and Insights
Drivers Impact Analysis
| Driver | (~) % Impact on CAGR Forecast | Geographic Relevance | Impact Timeline |
|---|---|---|---|
| Rising prevalence and awareness of cancer | +3.2% | Global, strongest in Asia-Pacific | Long term (≥ 4 years) |
| Increasing FDA approvals of gene-therapy drugs | +4.1% | North America & EU; spill-over to Asia-Pacific | Medium term (2-4 years) |
| Rising public & private R&D funding | +2.8% | Global; hubs in North America and China | Medium term (2-4 years) |
| Programmable lipid-nanoparticle delivery breakthroughs | +3.5% | Global; early leadership in US and Europe | Long term (≥ 4 years) |
| AI-driven vector design accelerating development | +2.9% | Global; leadership in North America and China | Long term (≥ 4 years) |
| Regional GMP cell-and-gene manufacturing hubs | +3.1% | Asia-Pacific core; spill-over to MEA & Latin America | Medium term (2-4 years) |
| Source: Mordor Intelligence | |||
Rising Prevalence and Awareness of Cancer
Global cancer incidence is on a steep climb, with the World Health Organization projecting 35 million new cases by 2050, a 77% jump over 2022 levels.[1]World Health Organization, “Cancer Fact Sheet,” who.int Aging populations in developed economies and lifestyle-driven risk factors in emerging markets enlarge the addressable patient pool for gene therapies. Early detection initiatives broaden patient identification for targeted interventions, further expanding demand. Greater public familiarity with genetic testing and precision oncology enhances receptivity to one-time therapies that correct or replace dysfunctional genes. Governments across Asia-Pacific have rolled out national cancer control plans that include molecular screening programs, accelerating patient stratification and treatment uptake. The convergence of demographic pressure and precision diagnosis creates a durable growth floor for the cancer gene therapy market.
Increasing FDA Approvals of Gene-Therapy Drugs
The US Food and Drug Administration’s accelerated approval pathway has become mainstream, with the agency finalizing guidance for CAR-T and genome-editing products in 2024.[2]U.S. Food and Drug Administration, “Approved Cellular and Gene Therapy Products,” fda.gov Clearer requirements shorten development timelines and attract larger capital inflows to late-stage assets. The agency forecasts 10–20 new gene therapy approvals annually by 2025, signaling regulatory confidence in benefit-risk profiles across diverse indications. Spill-over effects extend to Europe and Japan, where regulators leverage US dossiers to expedite local reviews. As approvals mount, payer familiarity improves, and clinical guidelines incorporate gene therapies earlier in treatment algorithms, reinforcing uptake across the cancer gene therapy market.
Rising Public & Private R&D Funding
Global biotech financing rose 33% year-on-year to USD 28.1 billion in 2024, even as broader capital markets tightened.[3]National Institutes of Health, “Somatic Cell Genome Editing Program Expansion,” nih.gov Mature gene-editing companies attracted sizable follow-on rounds, underscoring investor confidence in late-clinical pipelines. On the public side, the US NIH expanded its Somatic Cell Genome Editing program, and China’s Ministry of Science and Technology launched a multi-year initiative to subsidize manufacturing capacity for viral vectors. Government backing de-risks translational research and crowds in private capital, sustaining a virtuous cycle that fuels pipeline breadth and geographic diffusion within the cancer gene therapy market.
Programmable Lipid-Nanoparticle Delivery Breakthroughs
Lipid nanoparticle (LNP) technology has advanced beyond mRNA vaccines into solid tumor applications. Researchers at UT Southwestern reported tumor regression in ovarian and liver models using LNP-delivered gene editors. Novel ligand and pH-responsive designs improve tumor penetration and minimize systemic exposure. Standardized LNP platforms simplify scale-up, reduce batch variability, and lower cost per dose once commercial volumes are reached. Integration of LNPs with CRISPR payloads unlocks previously inaccessible oncogenic drivers, supporting a new wave of clinical candidates that will enlarge the cancer gene therapy market.
Restraints Impact Analysis
| Restraint | (~) % Impact on CAGR Forecast | Geographic Relevance | Impact Timeline |
|---|---|---|---|
| High cost of cancer gene therapeutics | -2.4% | Global; most acute in price-sensitive regions | Short term (≤ 2 years) |
| Regulatory & reimbursement uncertainty | -1.8% | Global; pronounced in emerging markets | Medium term (2-4 years) |
| Limited scalability of viral-vector production for solid tumors | -1.6% | Global; manufacturing bottlenecks | Long term (≥ 4 years) |
| Tumor heterogeneity lowering transduction efficiency | -1.3% | Global; higher impact in solid tumors | Long term (≥ 4 years) |
| Source: Mordor Intelligence | |||
High Cost of Cancer Gene Therapeutics
One-time treatments priced between USD 373,000 and USD 4.25 million strain payer budgets and delay adoption in benefit-constrained markets. Value-based contracts and installment payment models are emerging, but frameworks differ by country, creating administrative frictions that slow diffusion. The US Centers for Medicare & Medicaid Services introduced an outcomes-based pilot in 2024, yet commercial insurers still face actuarial challenges with small but high-cost patient cohorts. Tiered pricing and regional manufacturing hubs could narrow cost differentials, but the near-term impact of sticker shock remains a meaningful brake on the cancer gene therapy market.
Regulatory & Reimbursement Uncertainty
Country-specific cell and gene therapy regulations vary widely in post-marketing surveillance, environmental risk assessments, and long-term patient follow-up. Multinational sponsors navigate divergent requirements that add cost and time. The FDA’s CoGenT Global pilot aims to coordinate reviews with like-minded agencies, yet broader harmonization is several years away. On reimbursement, many payers have not finalized coding pathways or long-term risk-pooling mechanisms. Inconsistent access policies hamper uptake, particularly in middle-income regions where public budgets are limited. Uncertainty around coverage and monitoring obligations therefore tempers near-term growth in the cancer gene therapy market.
Segment Analysis
By Therapy Modality: CRISPR Technologies Drive Next-Generation Innovation
Oncolytic virotherapy captured 43.61% of the cancer gene therapy market share in 2024, underpinned by established assets such as talimogene laherparepvec in melanoma. Commercial traction benefits from a clear regulatory precedent and decades of safety data. Even so, oncolytic platforms wrestle with manufacturing complexity and immune neutralization when dosed systemically. In parallel, CRISPR-based therapies and are accelerating on the back of precise, multiplexed editing and expanding clinical validation in gastrointestinal malignancies with CAGR of 23.22% during 2025 and 2030. Early-stage data from allogeneic CAR-T programs employing CRISPR knock-outs signal potent antitumor activity with manageable cytokine release profiles.
Future expansion relies on the integration of gene editing with immune-stimulatory payloads to overcome tumor microenvironment barriers. CRISPR pipelines target solid tumors by concurrently disrupting checkpoint genes and inserting cytokine transgenes to bolster T-cell persistence. Ecosystem collaboration is intensifying: academic centers supply novel guide libraries, while contract manufacturers invest in quality-by-design platforms for GMP-grade ribonucleoprotein complexes. As these alliances mature, analysts expect the cancer gene therapy market to tilt further toward programmable editing systems that offer modularity across multiple tumor types.
Note: Segment shares of all individual segments available upon report purchase


By Vector Type: Non-Viral Systems Gain Momentum Despite Viral Dominance
Viral vectors held 61.82% of revenues in 2024, supported by robust adeno-associated virus (AAV) production runs and a track record of six FDA-cleared oncology applications. AAV serotype libraries facilitate selective tissue tropism, and process improvements have lifted batch yields four-fold. Nonetheless, lentiviral capacity constraints limit near-term scaling of autologous CAR-T therapies, prompting sponsors to diversify vector supply chains.
Non-viral vectors are recording a 29.08% CAGR, boosted by lipid nanoparticles, polymeric carriers, and physical-actuation methods such as electroporation. Manufacturing advantages include cell-free synthesis, shorter production cycles, and lower biohazard containment needs. Recent prime-editing studies achieved therapeutically relevant knock-in rates using LNPs, validating a non-viral route for complex repairs. As genome writers transition from research to clinic, sponsors anticipate dual-vector strategies that blend viral initial dosing with non-viral redosing, lowering immunogenicity while expanding addressable indications within the cancer gene therapy market.
By Cancer Type: Solid Tumors Emerge as High-Growth Frontier
Hematologic cancers accounted for 33.72% of 2024 revenue, anchored by six commercial CAR-T cell products that moved from relapsed lines into earlier treatment settings. Response durability remains compelling, with 5-year overall survival exceeding 50% in certain lymphomas. Pipeline depth, however, is shifting toward solid tumors, projected to grow at a 28.07% CAGR. Advances in tumor-penetrating nanocarriers, oncolytic virus–mediated immune priming, and local microinjection techniques converge to breach the immunosuppressive niches of epithelial cancers.
Breast, lung, and prostate cancers head the solid-tumor opportunity pool by prevalence. Tissue-specific promoters and micro-RNA switches refine expression to malignant cells, mitigating off-target toxicity. The recent FDA nod for tumor-infiltrating lymphocyte therapy in melanoma establishes regulatory precedent for cell-based approaches in solid masses. As translational data accumulate, the cancer gene therapy market size attached to solid tumors is expected to outpace hematologic indications beyond 2030.
Note: Segment shares of all individual segments available upon report purchase
By End User: Biotech Companies Drive Innovation and Adoption
Hospitals and dedicated cancer centers processed nearly half of all commercial treatments and 47.24% market share in 2024, reflecting their role as procedure sites for leukapheresis, conditioning regimens, and post-infusion monitoring. Centers of excellence leverage cell-processing suites and multidisciplinary tumor boards to manage complex logistics. Yet, biotechnology and pharmaceutical companies increasingly assume end-to-end control, from vector engineering to point-of-care manufacturing, and are projected to log a 26.91% CAGR. Modular clean-room pods and closed-system bioreactors enable onsite or near-site production, reducing vein-to-vein time and enhancing supply security.
Academic research institutes remain vital for first-in-human trials and mechanistic studies. Government laboratories contribute reference standards and long-term cohort tracking. Diagnostic laboratories, although the smallest segment, are indispensable for companion genetic testing, informing patient eligibility and resistance monitoring. The tightly interwoven stakeholder matrix underpins the steady maturation of the cancer gene therapy industry across commercialization phases.
Geography Analysis
North America retained primacy with 39.16% of global revenue in 2024, supported by an FDA environment favorable to accelerated reviews and a payer mix capable of absorbing six-figure therapies. The region hosts a dense cluster of GMP vector facilities and maintains the world’s largest cell-therapy-ready hospital network. Canada complements US activity through streamlined orphan-drug incentives and provincial pathways that pilot outcome-based reimbursement contracts.
Europe follows with broad participation from Germany, the United Kingdom, Spain, and the Nordic countries, each leveraging centralized health-technology assessments to negotiate value-based pricing. The EU’s Advanced Therapy Medicinal Product regulation provides harmonized dossiers, expediting cross-border clinical trials. National health services pilot annuity payments tied to real-world data, improving affordability without stifling innovation. As a result, the cancer gene therapy market continues to deepen its European footprint, particularly for rare and ultra-rare oncologic indications.
Asia-Pacific is the fastest riser, predicted to clock a 30.97% CAGR through 2030. China’s early approval of Gendicine offers precedent, while the Hainan Boao Lecheng pilot zone allows fast-tracked use of foreign-approved therapies, accelerating real-world adoption. Japan’s Sakigake and Priority Review systems truncate review times, and Singapore’s Cell Therapy Facility provides regional contract manufacturing. Strategic alliances between Western sponsors and local manufacturers unlock cost advantages and accelerate regulatory filings. As reimbursement frameworks mature, the cancer gene therapy market is expected to rebalance geographically, with Asia-Pacific closing the gap on North America before decade-end.
Latin America and the Middle East & Africa remain nascent but strategically important. Brazil has approved tax incentives for domestic vector production, while Saudi Arabia’s Vision 2030 earmarks investment for advanced-therapy infrastructure. International technology-transfer agreements and philanthropic funding aim to expand access, although patient volumes remain modest. Collectively, emerging regions add incremental demand and diversify clinical trial recruitment pools, reinforcing the global trajectory of the cancer gene therapy market.

Competitive Landscape
The sector is moderately consolidated, with platform acquisitions intensifying competitive stakes. Roche’s USD 1 billion purchase of Poseida Therapeutics secured proprietary non-viral DNA vectors and an allogeneic CAR-T pipeline, broadening Roche’s solid-tumor reach. Novartis and Gilead Sciences extend CAR-T leadership by investing in automation that lowers manufacturing costs by 25%, protecting margins as competition rises. AstraZeneca’s USD 245 million stake in Cellectis granted access to gene-editing toolkits adaptable across hematologic and solid tumors, cementing cross-platform optionality.
Strategic alliances rather than outright acquisitions dominate mid-tier players. BioNTech’s USD 200 million tie-up with Autolus creates shared infrastructure for dual-target CAR-T constructs, while CRISPR Therapeutics and Nkarta blend editing know-how with natural-killer cell biology to tackle solid tumors. AI-based vector-optimization start-ups sign multi-project agreements supplying in-silico capsid libraries to incumbents seeking immunoevasive profiles. Competition therefore hinges on control over enabling technological modality, manufacturing execution systems, and data-driven design—rather than single-asset exclusivity.
Barriers to entry escalate as GMP requirements tighten and regulators demand 15-year follow-up on genome-integrating platforms. Market incumbents invest heavily in digital batch-record systems, in-line analytics, and distributed control networks that shorten release testing by 40%. Smaller entrants face a capital-intensive step-up to meet these standards, driving continued consolidation. Against this backdrop, the cancer gene therapy market favors companies capable of marrying scientific depth with industrial scale.
Cancer Gene Therapy Industry Leaders
-
Novartis AG
-
Bristol-Myers Squibb Company
-
Amgen Inc.
-
Merck & Co. Inc.
-
Gilead Sciences (Kite Pharma)
- *Disclaimer: Major Players sorted in no particular order

Recent Industry Developments
- January 2025: bluebird bio completed its acquisition by Carlyle and SK Capital, transitioning to private ownership to enhance gene therapy delivery for severe genetic diseases including sickle cell disease and β-thalassemia, with stockholders receiving USD 3.00 per share plus contingent value rights.
- December 2024: AGC Biologics received FDA approval for its Milan facility to manufacture lentiviral vectors for Autolus Therapeutics' AUCATZYL CAR-T therapy, marking the company's fifth commercial viral vector product approval and highlighting its significant role in supporting 30% of all ex-vivo gene therapies.
- November 2024: Roche announced its USD 1 billion acquisition of Poseida Therapeutics, a cell therapy developer focused on innovative CAR-T and gene therapy platforms, significantly expanding Roche's oncology portfolio and manufacturing capabilities.
- April 2024: Pfizer Inc., a biopharmaceutical company, reported that the US Food and Drug Administration (FDA) had approved BEQVEZ (fidanacogene elaparvovec-dzkt) for the treatment of adults with moderate to severe hemophilia B, who are on use factor IX (FIX) prophylaxis therapy or have current or historical life-threatening hemorrhage.


Global Cancer Gene Therapy Market Report Scope
Cancer gene therapy is a technique used for the treatment of cancer, where therapeutic DNA is introduced into the patient's gene. In the treatment, a functional gene, also known as therapeutic DNA, is inserted into the cells of a cancer patient to modify metabolism, alter or repair acquired genetic abnormalities, and impart new functions to cells.
The cancer gene therapy market is segmented by therapy, end user, and geography. By therapy, the market is segmented into gene-induced immunotherapy, oncolytic virotherapy, and gene transfer. By end user, the market is segmented into cancer research institutes, diagnostic centers, and others (hospitals and biotechnology companies). By geography, the market is segmented into North America, Europe, Asia-Pacific, Middle East and Africa, and South America. The report also covers the estimated market sizes and trends for 17 countries across major regions globally. The report offers values (USD) for all the above segments.
| Gene-Induced Immunotherapy |
| Oncolytic Virotherapy |
| Gene Transfer Therapy |
| CRISPR-based Gene-Editing Therapies |
| RNAi-based Gene-Silencing Therapies |
| Viral Vectors |
| Non-Viral Vectors |
| Hematologic Malignancies | |
| Solid Tumors | Breast Cancer |
| Lung Cancer | |
| Prostate Cancer | |
| Colorectal Cancer | |
| Melanoma | |
| Other Cancers |
| Cancer Research Institutes |
| Academic & Government Laboratories |
| Hospitals & Cancer Centers |
| Biotechnology & Pharma Companies |
| Diagnostic Laboratories |
| North America | United States |
| Canada | |
| Mexico | |
| Europe | Germany |
| United Kingdom | |
| France | |
| Italy | |
| Spain | |
| Rest of Europe | |
| Asia-Pacific | China |
| Japan | |
| India | |
| Australia | |
| South Korea | |
| Rest of Asia-Pacific | |
| Middle East & Africa | GCC |
| South Africa | |
| Rest of Middle East & Africa | |
| South America | Brazil |
| Argentina | |
| Rest of South America |
| By Therapy Modality | Gene-Induced Immunotherapy | |
| Oncolytic Virotherapy | ||
| Gene Transfer Therapy | ||
| CRISPR-based Gene-Editing Therapies | ||
| RNAi-based Gene-Silencing Therapies | ||
| By Vector Type | Viral Vectors | |
| Non-Viral Vectors | ||
| By Cancer Type | Hematologic Malignancies | |
| Solid Tumors | Breast Cancer | |
| Lung Cancer | ||
| Prostate Cancer | ||
| Colorectal Cancer | ||
| Melanoma | ||
| Other Cancers | ||
| By End User | Cancer Research Institutes | |
| Academic & Government Laboratories | ||
| Hospitals & Cancer Centers | ||
| Biotechnology & Pharma Companies | ||
| Diagnostic Laboratories | ||
| By Geography | North America | United States |
| Canada | ||
| Mexico | ||
| Europe | Germany | |
| United Kingdom | ||
| France | ||
| Italy | ||
| Spain | ||
| Rest of Europe | ||
| Asia-Pacific | China | |
| Japan | ||
| India | ||
| Australia | ||
| South Korea | ||
| Rest of Asia-Pacific | ||
| Middle East & Africa | GCC | |
| South Africa | ||
| Rest of Middle East & Africa | ||
| South America | Brazil | |
| Argentina | ||
| Rest of South America | ||


Key Questions Answered in the Report
What is the current size of the cancer gene therapy market?
The cancer gene therapy market size reached USD 24.96 billion in 2025 and is projected to grow rapidly at an 18.31% CAGR to 2030.
Which therapy modality holds the largest market share?
Oncolytic virotherapy leads with 43.61% share, benefiting from established clinical use and regulatory familiarity.
Which region is expanding fastest?
Asia-Pacific is forecast to post a 30.97% CAGR through 2030, supported by China’s manufacturing base and accelerated regulatory pathways.
How are high therapy prices being addressed?
Payers and manufacturers are piloting value-based contracts and installment payment models to spread costs and tie reimbursement to outcomes.
What technological trend is most disruptive?
CRISPR-based editing platforms, especially when paired with lipid nanoparticle delivery, are reshaping pipelines for both hematologic and solid tumors.
Page last updated on:


