
Market Overview
| Study Period | 2021 - 2031 |
|---|---|
| Forecast Data Period | 2026 - 2031 |
| Base Year Market Size (2025) | USD 0.98 Billion |
| Market Size (2026) | USD 1.04 Billion |
| Market Size (2031) | USD 1.4 Billion |
| Growth Rate (2026 - 2031) | 6.14 % |
| Market Concentration | Medium |
Major Players *Disclaimer: Major Players sorted in no particular order Image © Mordor Intelligence. Reuse requires attribution under CC BY 4.0. | |
Canada Transformer Market Analysis by Mordor Intelligence
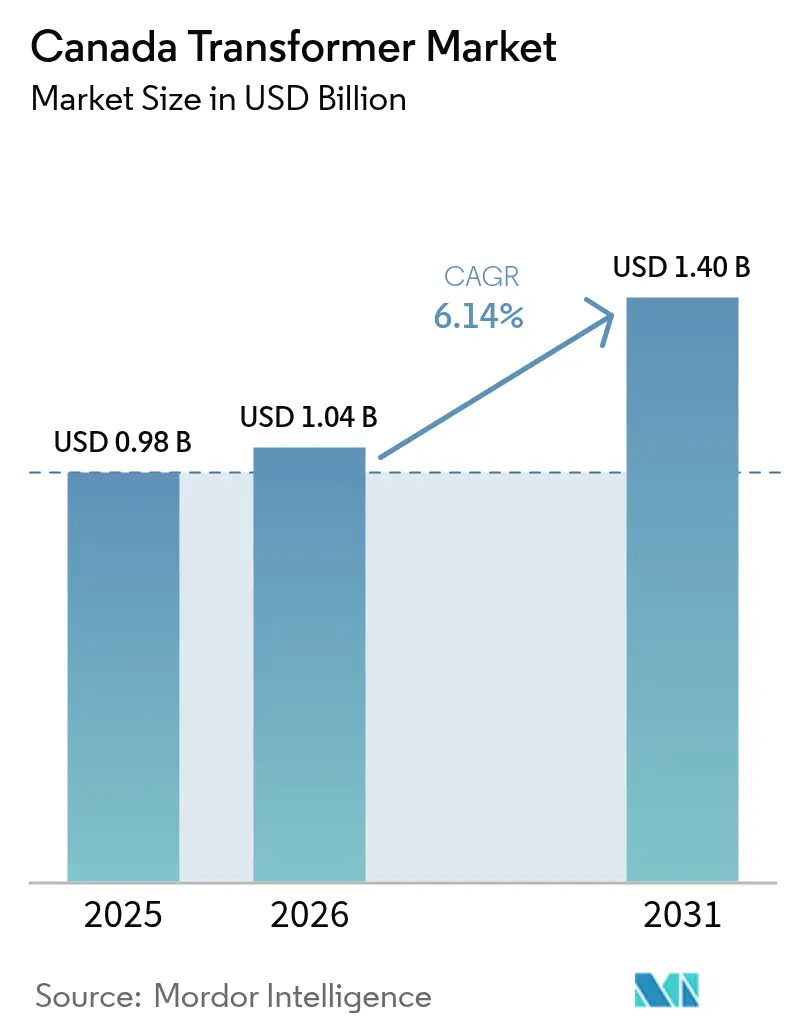
Canada Transformer Market size in 2026 is estimated at USD 1.04 billion, growing from 2025 value of USD 0.98 billion with 2031 projections showing USD 1.4 billion, growing at 6.14% CAGR over 2026-2031.
This momentum aligns with federal plans to invest more than CAD 60 billion (USD 45 billion) in clean-power assets over the next decade and to achieve net-zero grid emissions by 2035.(1)Natural Resources Canada, “Powering Canada’s Future: A Clean Electricity Strategy,” NATURAL-RESOURCES.CANADA.CA Canada's transformer market growth is further reinforced by projections that national electricity output will need to more than double by 2050 to service electrification across transportation, industry, and heating. Medium-power units currently dominate the market due to distribution utility upgrades; however, large transformers above 100 MVA represent the fastest-growing category as renewable megaprojects demand higher ratings. Federal tax credits covering 15% of eligible transmission investments, alongside a CAD 3 billion (USD 2.3 billion) Smart Renewables fund, anchor steady procurement lines for manufacturers. Canada's transformer market participants are also responding to load-center densification, where air-cooled units are gaining favor for data centers and urban settings, even though oil-cooled equipment still holds the leadership.
Key Report Takeaways
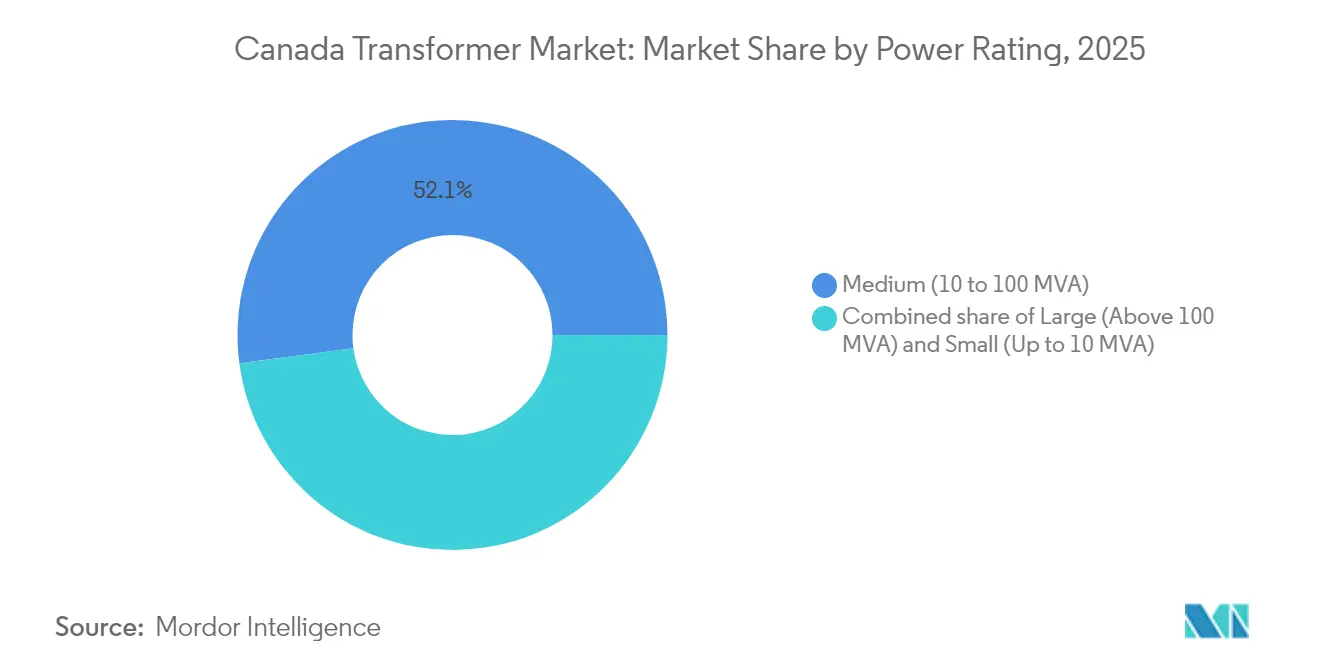
- By power rating, medium-power transformers held a 52.10% revenue share in 2025, while large-power units are projected to record the fastest growth of 6.74% CAGR through 2031.
- By cooling type, oil-cooled designs captured 62.20% of Canada's transformer market share in 2025; however, air-cooled counterparts are set to advance at a 6.93% CAGR to 2031.
- By phase, three-phase equipment commanded a 73.60% share of the Canadian transformers market size in 2025 and is forecast to grow at a 7.22% CAGR during 2026-2031.
- By transformer type, distribution transformers accounted for 59.10% of the Canada transformer market size in 2025, whereas power transformers show lower volumes but higher ticket prices.
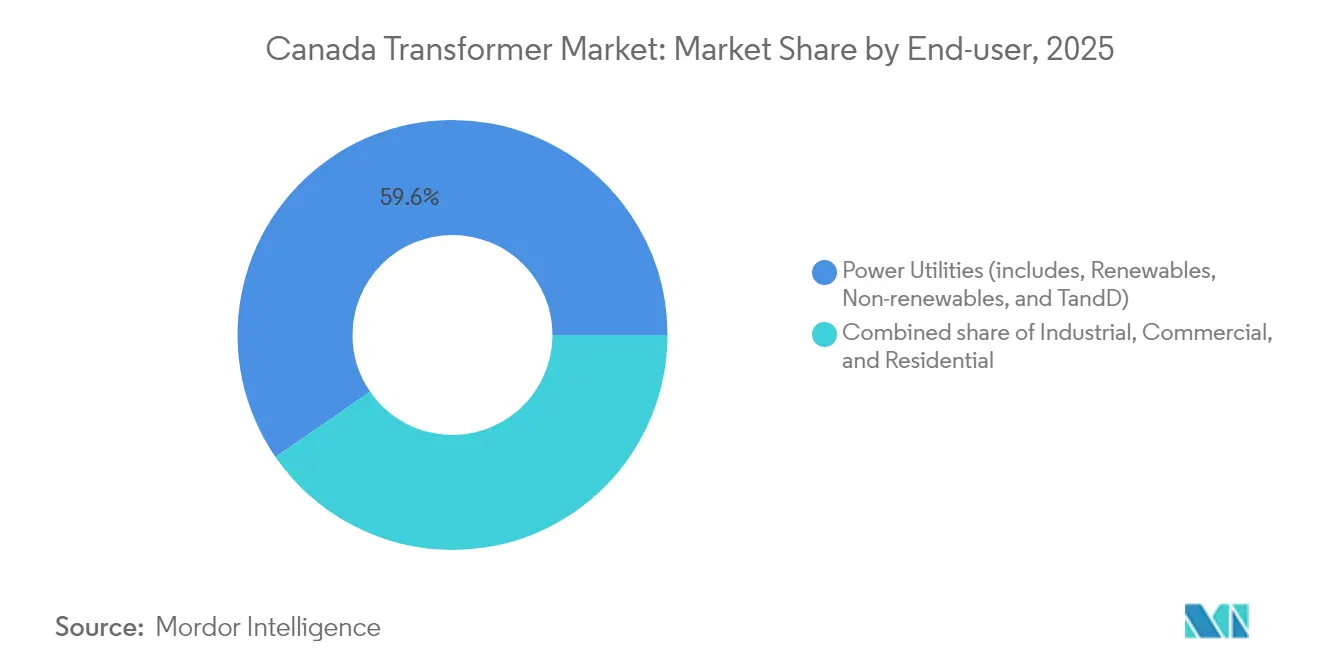
- By end-user, utilities remained the top spenders with a 59.60% share in 2025; however, industrial customers are poised for the sharpest growth, with a 7.58% CAGR through 2031.
Note: Market size and forecast figures in this report are generated using Mordor Intelligence’s proprietary estimation framework, updated with the latest available data and insights as of 2026.
Canada Transformer Market Trends and Insights
Drivers Impact Analysis*
| Driver | (~) % Impact on CAGR Forecast | Geographic Relevance | Impact Timeline |
|---|---|---|---|
| Rising electricity demand and grid-modernization programs | 2.1% | National, concentrated in Ontario, Quebec, Alberta | Medium term (2-4 years) |
| Surge in renewable-energy interconnections | 1.8% | Western provinces, spill-over to Atlantic Canada | Short term (≤ 2 years) |
| Federal "Clean Electricity Regulations" incentivising T-D upgrades (proposed 2025) | 1.5% | National excluding territories | Long term (≥ 4 years) |
| Electrification of heavy industries in Western Canada (steel, mining, LNG) | 1.2% | Alberta, Saskatchewan, British Columbia | Medium term (2-4 years) |
| Utility-led adoption of digital twin-enabled transformers (under-reported) | 0.8% | Ontario, Quebec, British Columbia | Long term (≥ 4 years) |
| Micro-grid deployments in Indigenous & remote communities (under-reported) | 0.6% | Northern territories, remote First Nations communities | Medium term (2-4 years) |
| Source: Mordor Intelligence | |||
Federal Clean Electricity Regulations Drive Unprecedented Infrastructure Investment
Canada’s Clean Electricity Regulations, published in December 2024, require all generating units of at least 25 MW that connect to the North American grid to meet annual intensity limits of 65 tCO₂/GWh from 2035 and zero after 2050.(2)Environment and Climate Change Canada, “Clean Electricity Regulations: SOR/2024-263,” CANADA.CA Asset owners therefore face a mandatory retirement or retrofit pathway that boosts demand for replacement high-voltage and medium-voltage transformers throughout the Canada transformers market. Federal modeling indicates 181 Mt CO₂e of cumulative abatement by 2050, necessitating vast transmission additions so that renewable projects in resource-rich regions can move power to urban load hubs. A CAD 25.7 billion (USD 19.3 billion) investment-tax-credit pool accelerates procurement schedules, though prevailing-wage clauses tighten labor supply and raise project budgets, prompting utilities to prefer manufacturers with domestic footprints.
Renewable Integration Accelerates Large Transformer Demand
Federal clean-power programs already back 2,700 MW of new renewables and 2,100 MWh of storage, and upcoming procurements in British Columbia, Ontario, and Quebec total 17.5 GW. Each wind or solar block requires step-up transformers in the 90-200 MVA, 240/34.5 kV range. The North American Electric Reliability Corporation recommends 12-14 GW of fresh interprovincial links to mitigate extreme-weather blackouts, translating into larger HV units and converter step-ups. These project clusters provide the Canadian transformers market with strong forward visibility and encourage manufacturers to expand their domestic test bays, capable of certifying 800 kV class equipment.(3)Hitachi Energy, “Hitachi Energy Announces Modernization of Power Transformer Factory,” HITACHIENERGY.COM
Digital Twin Technology Adoption Enhances Asset Management
Hydro-Québec’s CAMP program links sensor-equipped transformers into a real-time twin, which reduced unplanned outages during the summer peak of 2025 by 14%. Utilities in Ontario and British Columbia replicate the model, requesting embedded fiber-optic winding temperature probes, dissolved gas analyzers, and LTE gateways in new units. Natural Resources Canada’s Digital Utility Platform in Cobourg demonstrates how load-flow analytics identify overloaded transformers and trigger preventive dispatch.(4)Natural Resources Canada, “Powering Canada’s Future: A Clean Electricity Strategy,” NATURAL-RESOURCES.CANADA.CA Adoption barriers include retrofit costs for legacy fleets, data-serialization gaps, and the need for cybersecurity compliance across provincial regimes. Even so, bid specifications now routinely mandate digital-ready features, fostering a smart-equipment premium inside the Canada transformers market.
Supply Chain Bottlenecks Constrain Market Growth
Average transformer lead times have increased from 50 weeks in 2020 to nearly two years for units exceeding 100 MVA. Canada exports approximately 47% of U.S. laminated stacked cores, but domestic grain-oriented electrical steel (GOES) still fails to meet surging needs.(5)U.S. Department of Energy, “Large Power Transformers and HVDC Systems Supply Chain Deep-Dive,” ENERGY.GOV With copper prices 60-80% higher than five years ago, overall transformer pricing has risen at similar rates. Skilled manufacturing labor is also scarce, particularly for coil winding and brazing specialties, which are concentrated in Ontario and Quebec factories. These constraints shave roughly 0.9 percentage points from the attainable CAGR of the Canada transformers market.
Restraints Impact Analysis*
| Restraint | (~) % Impact on CAGR Forecast | Geographic Relevance | Impact Timeline |
|---|---|---|---|
| Long permitting cycles for new high-voltage substations | -1.2% | National, with delays concentrated in Ontario, Alberta | Short term (≤ 2 years) |
| Supply-chain bottlenecks in grain-oriented electrical steel | -0.9% | Global, with spillover to Canadian manufacturing | Medium term (2-4 years) |
| Exchange-rate volatility impacting imported core components (under-reported) | -0.6% | National, particularly affecting import-dependent manufacturers | Short term (≤ 2 years) |
| Scarcity of skilled transformer-design engineers in Canada (under-reported) | -0.5% | Ontario, Quebec manufacturing centers | Long term (≥ 4 years) |
| Source: Mordor Intelligence | |||
Regulatory Approval Delays Impact Project Timelines
Major switching stations need certificates from provincial regulators, environmental clearances, and Indigenous consultations. Nova Scotia Power’s NS-NB Reliability Intertie, which includes a 345 kV substation rebuild, illustrates the typical 2-3 year wait between filing and groundbreaking. Lengthy reviews defer transformer procurement and inflate carrying costs for utilities, removing roughly 1.2 percentage points from the five-year CAGR potential of the Canada transformers market.
Skilled Labor Shortages Threaten Manufacturing Capacity
Roughly one-third of Canada’s journey-level transformer trade workers will retire within five years. Although federal apprenticeship incentives reach CAD 17,000 (USD 12,700) per hire, the pipeline remains thin. Manufacturers must raise wages and invest in automated coil-winding, moves that can lift unit costs and constrain delivery schedules for the Canadian transformers market.
*Our forecasts treat driver/restraint impacts as directional, not additive. The impact forecasts reflect baseline growth, mix effects, and variable interactions.
Segment Analysis
By Power Rating: Large Transformers Lead Growth Despite Medium Dominance
Medium-power units, ranging from 10 MVA to 100 MVA, held the largest slice of Canada's transformer market share in 2025, driven by distribution utility replacements and industrial service upgrades. Orders in the 40-60 MVA range increased sharply after utilities introduced loop schemes to enhance redundancy, and smaller municipalities opted for 25 MVA units to facilitate feeder reconfiguration. Despite this dominance, the Canada transformers market size for large-power equipment (>100 MVA) is forecast to rise 6.74% annually to 2031 as renewable megaprojects require 120-200 MVA step-ups.
Large-scale growth is evident in Alberta wind contracts and Ontario long-term resource plans, which together specify more than 30 units exceeding 150 MVA through 2028. Supply constraints mean lead times stretch up to four years, forcing buyers to secure slots early and often from the Varennes facility or U.S. plants that recently added 800 kV bays. This dynamic positions large-transformer makers for margin upside while driving consortium bids that bundle financing and service warranties in the Canada transformers market.


By Cooling Type: Air-Cooled Growth Accelerates Urban Applications
Oil-cooled transformers retained a 62.20% share of the Canada transformers market in 2025 because they achieve higher power density, support overload cycles, and fit existing substation footprints. Utilities still prefer oil for bulk systems, but stringent fire-protection and spill-containment rules introduced in 2024 increase secondary costs. The alternative air-cooled segment—comprising cast-resin and ventilated dry-type designs—will notch a 6.93% CAGR by 2031 as data-center clusters in Toronto, Montréal, and Vancouver demand equipment that meets low-smoke and confined-space codes.
End-users also favor air-cooled transformers for temporary feeders, underground vaults, and modular micro-grids where oil pans are impractical. Cast-resin cores rated at 2.5-10 MVA are the dominant choice for these applications. Suppliers refine epoxy formulations to handle tropical storage and rapid load changes, thereby expanding the addressable revenue for air-cooled producers within the Canadian transformers market.
By Phase: Three-Phase Dominance Reflects Grid Architecture
Three-phase transformers represented 73.60% of the Canadian transformers market size in 2025, a figure that is expected to increase as utilities decommission aging single-phase banks in favor of integrated units. Advantages include smaller footprints, factory-calibrated impedance balance, and simplified protection schemes. The segment’s anticipated 7.22% CAGR rests on bulk procurement programs tied to the Clean Electricity Regulations.
Single-phase demand holds in rural feeders and certain industrial processes; however, its share continues to erode as municipalities convert overhead reconstruction projects to three-phase backbone structures. Manufacturers address residual single-phase demand through standard designs ranging from 167 kVA to 500 kVA; however, investment emphasis remains on three-phase innovations, such as flux-shunted cores and lower no-load losses, for the Canadian transformers market.

By Transformer Type: Distribution Segment Leads Utility Modernization
Distribution transformers captured 59.10% of the Canadian transformer market share in 2025, driven by accelerated pole-top and pad-mount replacement plans. Federal grid-modernization grants support voltage conversion from 4.16 kV to 13.8 kV in small towns, stimulating orders for 50 kVA to 167 kVA units with amorphous-metal cores. Upgraded CSA C802.3 efficiency rules, effective 2025, further drive swap-outs of legacy silicon-steel cores, adding volume to the distribution category.
While power-transformer volumes are lower, average selling prices can exceed USD 4 million for 300 MVA autotransformers, contributing materially to the overall Canada transformers market size. Domestic fabrication remains limited to a single plant, so utilities secure positions at least 36 months in advance. This gap sparks interest in joint-venture factories that could localize production of 230 kV-400 kV class if demand persists.
By End-User: Industrial Growth Outpaces Utility Segment
Utilities booked 59.60% of transformer spending in 2025, driven by aging infrastructure; however, industrial customers—from miners to AI data center operators—will grow the fastest at a 7.58% CAGR to 2031. The mining electrification wave in British Columbia and Alberta favors mobile 25-40 MVA skid packages with onboard harmonic filters. Data-center investors specify redundant dry-type units fed from ring banks to maintain Tier IV uptime.
Commercial office retrofits are migrating toward smaller, high-efficiency pad-mounts that comply with noise ordinances, while residential heat-pump uptake is pushing distribution utilities to reinforce split-phase service transformers. Together, these shifts diversify revenue streams and enhance resilience against regulatory delays in the Canada transformers market.
Geography Analysis
Ontario remains the largest provincial buyer, underpinned by Hydro One's CAD 11.8 billion (USD 8.8 billion) capital plan through 2027, which allocates roughly CAD 900 million (USD 675 million) annually to station rebuilds and distribution hardening. Projects such as the CAD 1.2 billion (USD 900 million) East-West Tie spur high-voltage transformer demand, and automotive battery factories in Windsor add mid-range substation orders. Ontario's grid-integration roadmap estimates 650 MVA of incremental transformer capacity per year through 2030, positioning the province as a central player in Canada's transformer market opportunities.
Quebec functions as both a production hub and a major demand center. Hitachi Energy's Varennes plant, which underwent a CAD 140 million (USD 105 million) upgrade in 2024, can now build and test single-unit ratings of up to 1,200 MVA. Hydro-Québec's plan to add 3,900 MW of hydro and wind capacity by 2030 necessitates large-scale step-ups and converter transformers. Provincial incentives also foster digital-twin pilots that utilize advanced sensors and communication modules, reinforcing technology leadership and underscoring Quebec's strategic role in the Canadian transformers market.
Western provinces record the fastest growth. Alberta's competitive renewables auction pipeline exceeds 6 GW, while British Columbia's 5 GW wind procurement and Site C megaproject call for multiple 240/34.5 kV and 500/230 kV transformers. Cross-border power-export ambitions and energy storage rollouts add further pull. Although the volumes in Manitoba and Saskatchewan are smaller, interconnection plans, such as the Kivalliq Hydro-Fibre Link, introduce new high-voltage corridors that are expected to raise transformer needs by the late 2020s. Collective western demand is projected to represent roughly 29.20% of the Canada transformers market size by 2031, up from 22.60% in 2025.
Regulatory Landscape
Canada’s transformer market operates under federal emissions policy, federal product compliance rules, and provincial grid codes. Environment and Climate Change Canada finalized the Clean Electricity Regulations (SOR/2024-263) in December 2024, establishing tightening emissions-intensity limits for grid-connected generating units (25 MW and above) starting in 2035. This direction reinforces long-horizon transmission and substation renewal programs that pull through demand for power and large distribution transformer orders.
On the equipment side, Natural Resources Canada administers energy-efficiency requirements for transformer categories, including dry-type transformers, with associated compliance, testing, and reporting obligations. CSA Group transformer standards, including CSA C802-series requirements, shape technical conformity, while Measurement Canada requirements for instrument transformers used in revenue metering add another layer of approval for grid-connected projects. Trade measures also affect procurement and pricing: the Canada Border Services Agency maintains anti-dumping duties on certain small power transformers (3 MVA to 60 MVA) from specified origins, which influences sourcing decisions for utilities and EPCs.
Competitive Landscape
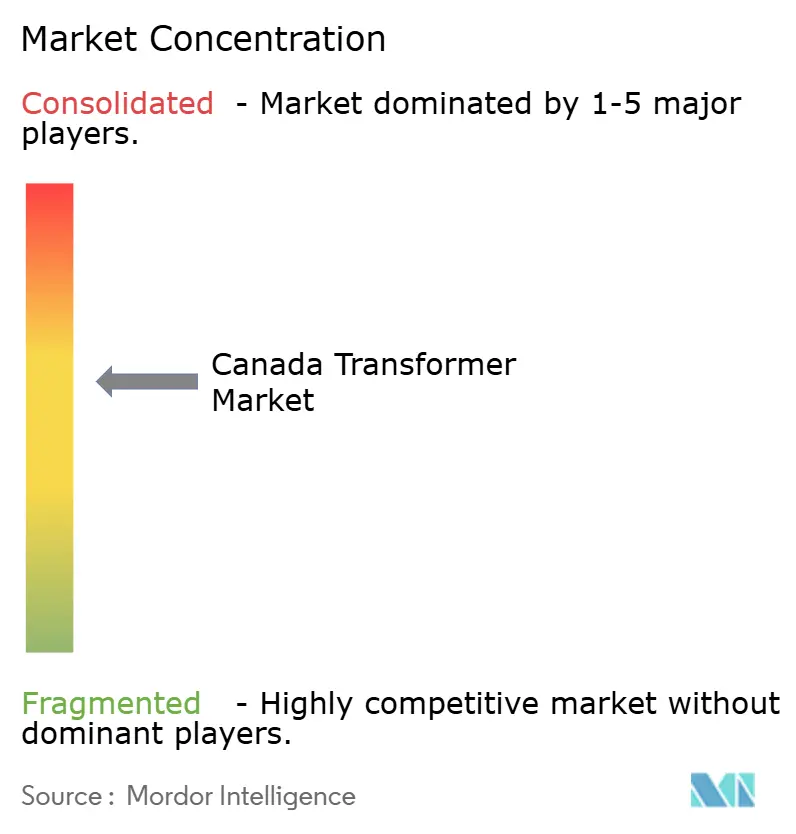
The Canada transformer market exhibits moderate concentration. The five largest vendors control an estimated 60% of national revenue, with recent mergers tightening capacity in distribution grades. Central Moloney’s February 2024 purchase of Cam Tran formed a 1,000-employee network across eight plants, giving the group scale in amorphous-core production while retaining dual branding. The combined entity now markets rapid-ship 50-kVA pole units under 12-week delivery commitments that appeal to rural utilities facing storm rebuilds.
Hitachi Energy holds the pole position for high-voltage and HVDC transformers thanks to its Varennes complex. The 130,000-square-foot high-voltage test bay, added in 2025, trims certification lead times by several months, making the plant the only North American site that can type-test 800 kV equipment locally. The company followed up with a USD 250 million global expansion in 2025, allocating roughly 40% of the funds to North American facilities that support Canadian orders.
Domestic independents such as PTI Transformers, Atlas Transformer, and Niagara Transformer compete on customization and after-sales service. Their core proposition lies in manufacturing agility—encompassing short runs, quick design changes, and bilingual field crews. Yet, they face rising input costs and must navigate the scarcity of GOES Partnerships. However, joint material purchasing and recycling programs with utilities help partly offset volatile steel prices. Overall, strategic investments and supply-chain integration maintain competitive intensity at a high level, enabling customers to diversify risk while still achieving lifecycle support within Canada.
Canada Transformer Industry Leaders
Siemens AG
Schneider Electric SE
ABB Ltd
Hammond Power Solutions Inc
Hitachi Energy Ltd
- *Disclaimer: Major Players sorted in no particular order

Market Opportunities and Future Outlook
A near-term opportunity lies in domestic capacity additions and localization programs aimed at shortening lead times for distribution and smaller power transformers. CES Transformers opened an expanded 160,000 sq. ft. manufacturing facility in Markham, Ontario in January 2026, supported by federal funding (FedDev Ontario and NRC IRAP), reflecting active public-private efforts to add Canadian production capacity for utility replacement cycles and C&I electrification projects.
Large power transformer and high-voltage capability remains a key whitespace area as Canadian projects increasingly call for higher MVA step-ups, intertie equipment, and expanded testing capacity. Hitachi Energy’s September 2025 announcement of a CAD 270 million expansion at Varennes, Quebec (building on earlier modernization) targets large power transformer manufacturing constraints. On the demand side, the federal government’s May 2026 launch of a National Electricity Strategy (focused on actions tied to doubling grid capacity by 2050) and the June 2026 emphasis on financial and regulatory support for transmission interties, including Alberta-British Columbia and the Regina-Winnipeg corridor, strengthen the procurement pipeline for interconnection-driven transformer purchases, particularly for engineered-to-order, long-lead high-voltage units and digital-ready specifications.
Recent Industry Developments
- June 2026: Hammond Power Solutions completed the acquisition of AEG Power Solutions for approximately CAD 365 million following regulatory approvals. The combination broadens HPS capabilities in power conversion and industrial power solutions alongside its transformer portfolio, enabling more bundled bids for electrification and critical power projects.
- September 2025: Hitachi Energy announced an additional CAD 270 million investment to expand large power transformer manufacturing capacity at its Varennes, Quebec facility. The expansion targets a material increase in domestic supply of long-lead, high-MVA units used in transmission, renewables interconnections, and major substation programs.
- July 2024: The Government of Canada committed CAD 30 million to support Hitachi Energy in modernizing its Varennes power transformer factory and establishing an HVDC simulation center. This funding supports higher-end engineering and test capabilities tied to HVDC and high-voltage projects, strengthening local support for complex grid builds.


Research Methodology Framework and Report Scope
Market Definition and Coverage
We define the Canada transformer market as the revenue earned from selling electrical transformers used to step voltage up or down across the Canadian power system and end-use networks, covering both utility and customer-side demand.
Scope exclusions: Services such as installation labor, on-site commissioning, and long-term maintenance contracts are excluded when they are billed separately from transformer equipment.
Segmentation Overview
- By Power Rating
- Large (Above 100 MVA)
- Medium (10 to 100 MVA)
- Small (Up to 10 MVA)
- By Cooling Type
- Air-cooled
- Oil-cooled
- By Phase
- Single-Phase
- Three-Phase
- By Transformer Type
- Power
- Distribution
- By End-User
- Power Utilities (includes, Renewables, Non-renewables, and T&D)
- Industrial
- Commercial
- Residential
Data Sources, Market Sizing, and Validation
Desk Research
Desk work starts by anchoring transformer demand to Canada electricity and grid build activity, then mapping that activity to transformer needs by voltage level and application. For macro context and industrial indicators, we used public sources such as Statistics Canada and supporting energy system context from Natural Resources Canada. For supply and infrastructure signals that influence network investment, we also used inputs from the Canada Energy Regulator.
To keep the model practical, we checked trade and manufacturing direction using sources such as Canada Border Services Agency trade statistics and UN Comtrade to track import and export trends in transformer-related categories. Supporting context was pulled from utility filings and capital plans, public procurement notices, company annual reports, and energy and electrical engineering journals. Where gaps remained, we used paid subscriptions for company financials and intelligence, patent lookups, and import-export shipment-level checks to reduce coverage gaps. These examples are not exhaustive, and many other public documents were reviewed to collect, validate, and clarify data points.
Primary Interviews and Surveys
Primary work was used to pressure-test desk assumptions that are not always stated explicitly, including typical replacement cycles, lead times, price movement by transformer class, and ordering patterns across end users. We spoke with manufacturers, distributors, utilities, and EPC-related stakeholders, then cross-checked what we heard across provinces so the estimates reflect Canada-wide buying behavior. When responses diverged, we re-contacted sources and adjusted the inputs only after the supporting evidence aligned with procurement and trade signals.
Distribution of primary research fieldwork respondents
| Company type | Respondent position |
|---|---|
| Top tier: 34% | CXOs: 16% |
| Mid tier: 46% | Functional/Unit leaders: 29% |
| Smaller Players: 20% | Managers: 55% |
Market-Sizing & Forecasting
The core model uses a top-down approach where Canada grid investment and equipment replacement activity are translated into transformer revenue pools by type, rating, and cooling choice, then aggregated to a total. To keep the estimate grounded, we ran selective bottom-up checks, including sampled average selling prices multiplied by expected unit volumes, channel checks on delivery timing, and supplier-side revenue hints from public reporting where available.
Key inputs that materially move the totals include utility capital spending direction, transmission and distribution expansion and refurbishment cadence, the mix shift between distribution and power transformers, pricing momentum for core materials that influence selling prices, and the share of projects requiring three-phase units. Forecasting uses scenario analysis, since lead times, project starts, and replacement timing can shift quickly. The scenarios were calibrated using what interviewees described as the most likely award and delivery pattern over the next few years. When a clean bottom-up unit count was not available for a niche application, we handled the gap by applying validated penetration rates to the most relevant demand pool, then rechecking the result against import intensity and procurement signals.
Data Validation & Update Cycle
Before results are finalized, we triangulate totals across independent signals, and we review the model for outliers that do not match the direction of grid spending, trade flows, or known project timing. If a segment shows a jump without a clear driver, the assumptions are revisited, and we re-contact respondents when clarification is needed.
An internal review is done in steps, starting with input checks, followed by cross-tab reviews across transformer type and end user, and then a final consistency pass before sign-off. Reports are refreshed annually, and interim updates are made when a material event changes the demand picture, such as a major policy shift, supply disruption, or an unusually large utility procurement cycle. Right before delivery, we do a fresh scan so the outputs align with the latest available public signals for clients.
Mordor Intelligence's Canada Transformer Market Estimate Compared With Other Published Estimates
Published market sizes for transformers in Canada can vary even when the topic sounds the same, because the boundary of what gets counted is not consistent across publishers. Differences often come from which transformer types are included, whether equipment-only revenue is separated from services, and how prices are updated when input costs and lead times move.
Import and export direction, utility capex plans, and procurement timing are the checks that keep Mordor Intelligence's estimate tied to equipment revenue that is actually addressable in Canada, rather than a broader electrical equipment bucket. Some published figures also mix in adjacent categories or present an optimistic case without showing the underlying replacement cycle and project start assumptions, which can push totals upward in ways that are hard to validate.
Benchmark comparison
| Source | Market Size | Gaps in Research Methodology |
|---|---|---|
| Mordor Intelligence | USD 0.98 B (2025) | |
| Regional Consultancy A | USD 1.30 B (2024) | Uses an earlier base year and tends to blend transformer equipment with adjacent grid hardware and project services, which inflates the equipment-only revenue pool. |
| Trade Journal B | USD 0.12 B (2021) | Focuses on a narrower slice (for example, a single transformer class), and the value is often closer to a submarket total rather than the full Canada-wide transformer demand. |
Taken together, the spread mostly reflects scope boundaries and timing, not a simple disagreement on demand direction. By keeping the steps traceable to practical signals like trade movement, utility buying cycles, and realistic price progression, the final number is easier to reproduce and explain.


Key Questions Answered in the Report
What is the current value of the Canada transformers market?
It stood at USD 1.04 billion in 2026 and is projected to reach USD 1.4 billion by 2031.
How fast is transformer demand growing across Canada?
The market is forecast to post a 6.14% CAGR from 2026 to 2031, aided by clean-power investments and grid upgrades.
Which transformer segment is expanding the quickest?
Large-power units above 100 MVA are expected to grow at a 6.74% CAGR through 2031, mainly for utility-scale renewable interconnections.
Why are air-cooled transformers gaining traction in Canada?
Data-center buildouts and urban substation space limits are driving adoption of dry-type or cast-resin units that avoid oil-spill compliance burdens.
How are federal regulations affecting transformer procurement?
The Clean Electricity Regulations mandate net-zero grid emissions by 2035 and offer 15% tax credits on transmission projects, accelerating purchases of both distribution and high-voltage transformers.
Page last updated on:


 Your data is secure and never sold or shared.


