
Market Overview
| Study Period | 2020 - 2031 |
|---|---|
| Forecast Data Period | 2026 - 2031 |
| Base Year Market Size (2025) | USD 49.96 Billion |
| Market Size (2026) | USD 52.28 Billion |
| Market Size (2031) | USD 65.59 Billion |
| Growth Rate (2026 - 2031) | 4.65 % |
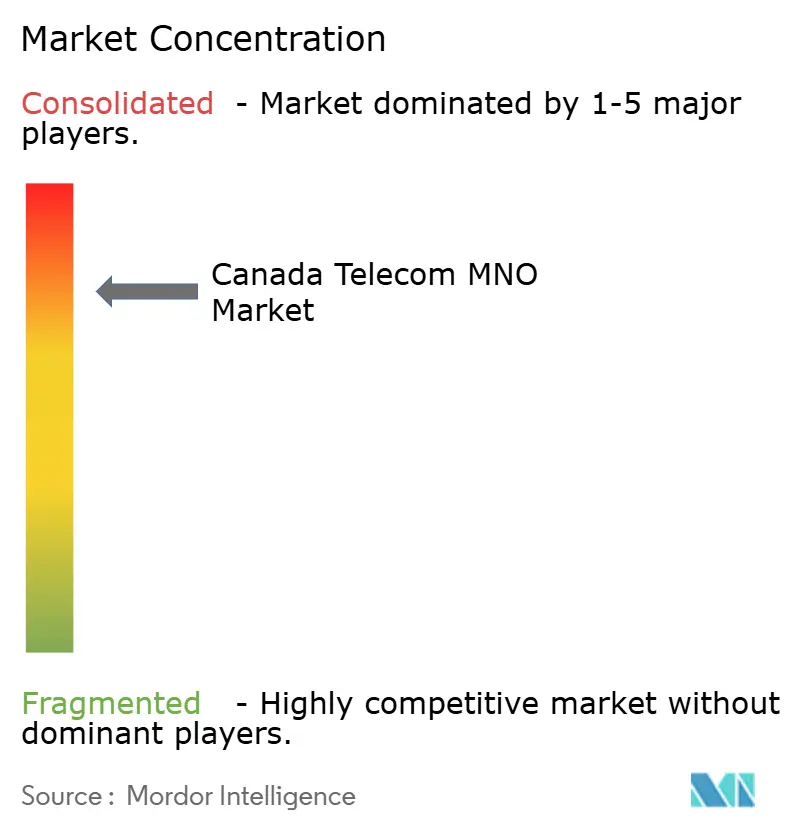
| Market Concentration | High |
Major Players *Disclaimer: Major Players sorted in no particular order Image © Mordor Intelligence. Reuse requires attribution under CC BY 4.0. | |
Canada Telecom MNO Market Analysis by Mordor Intelligence
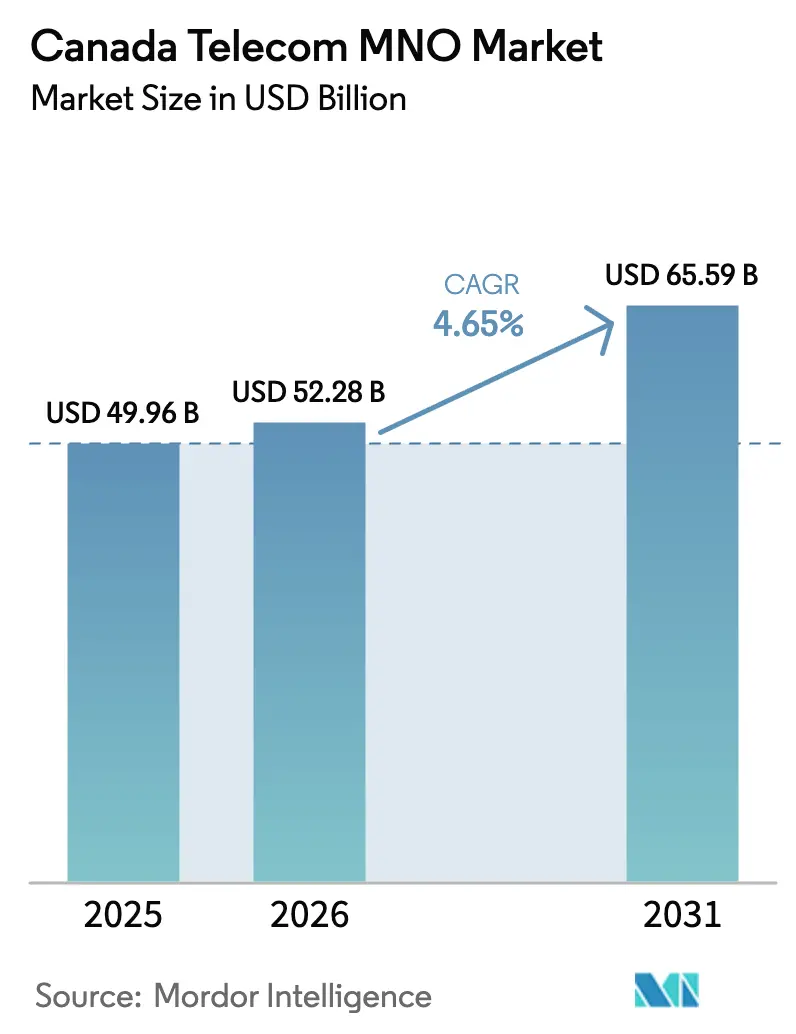
The Canada Telecom MNO Market size was valued at USD 49.96 billion in 2025 and estimated to grow from USD 52.28 billion in 2026 to reach USD 65.59 billion by 2031, at a CAGR of 4.65% during the forecast period (2026-2031).
Robust growth stems from the ongoing migration away from voice toward data-heavy use cases and the rapid nationwide roll-out of 5G infrastructure that now reaches more than 85% of the population. [1]TELUS Communications, “2025 Annual Report,” telus.comMomentum is reinforced by federal broadband subsidies that remove the economics of last-mile deployment barriers, a policy-driven MVNO framework that expands competition, and steady enterprise digitalization in mining, agriculture, and manufacturing. At the same time, multi-year spectrum auctions that have extracted USD 8.9 billion in fees, as well as cybersecurity legislation requiring the removal of Chinese network equipment, weigh on operator free cash flow.[2]Reuters Staff, “Canada 3500 MHz Auction Nets USD 8.9 Billion,” reuters.comThe Canada Telecom MNO market continues to balance the need for capacity investment with retail pricing pressure created by the entry of Quebecor-owned Freedom Mobile as a fourth national competitor.
Key Report Takeaways
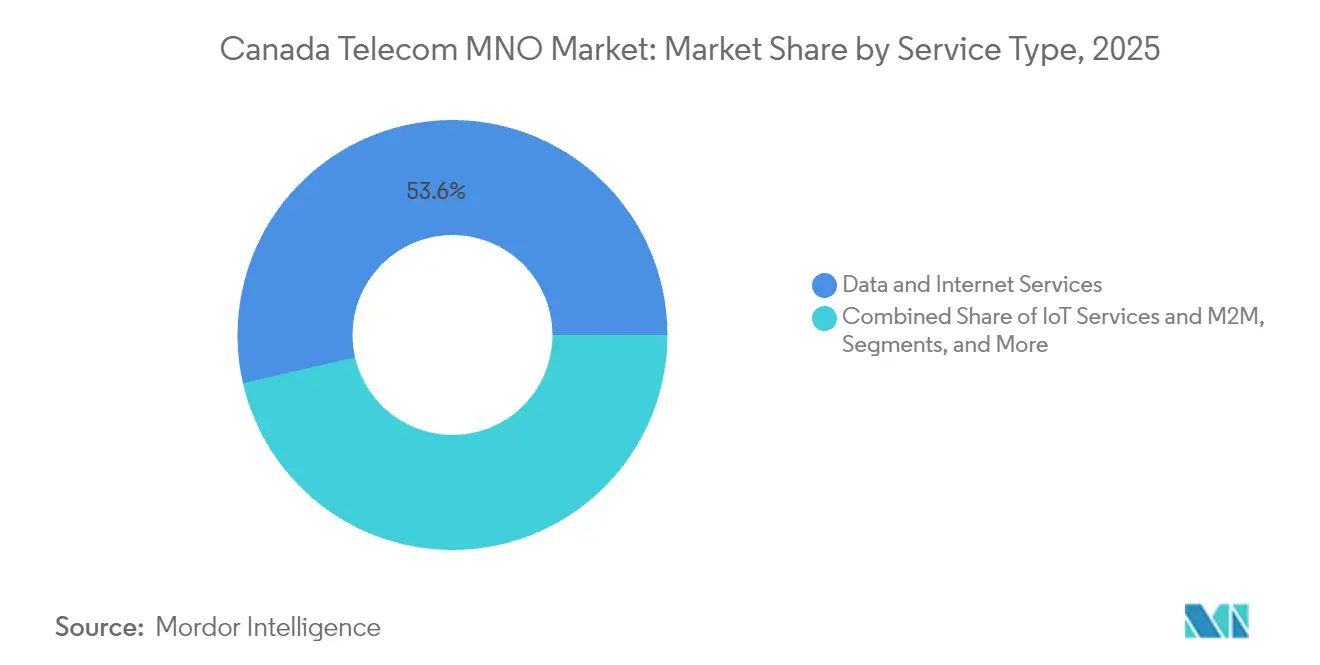
- By service type, Data and Internet Services led with 53.60% of the Canada Telecom MNO market share in 2025 while IoT and M2M Services logged the highest projected 5.15% CAGR through 2031.
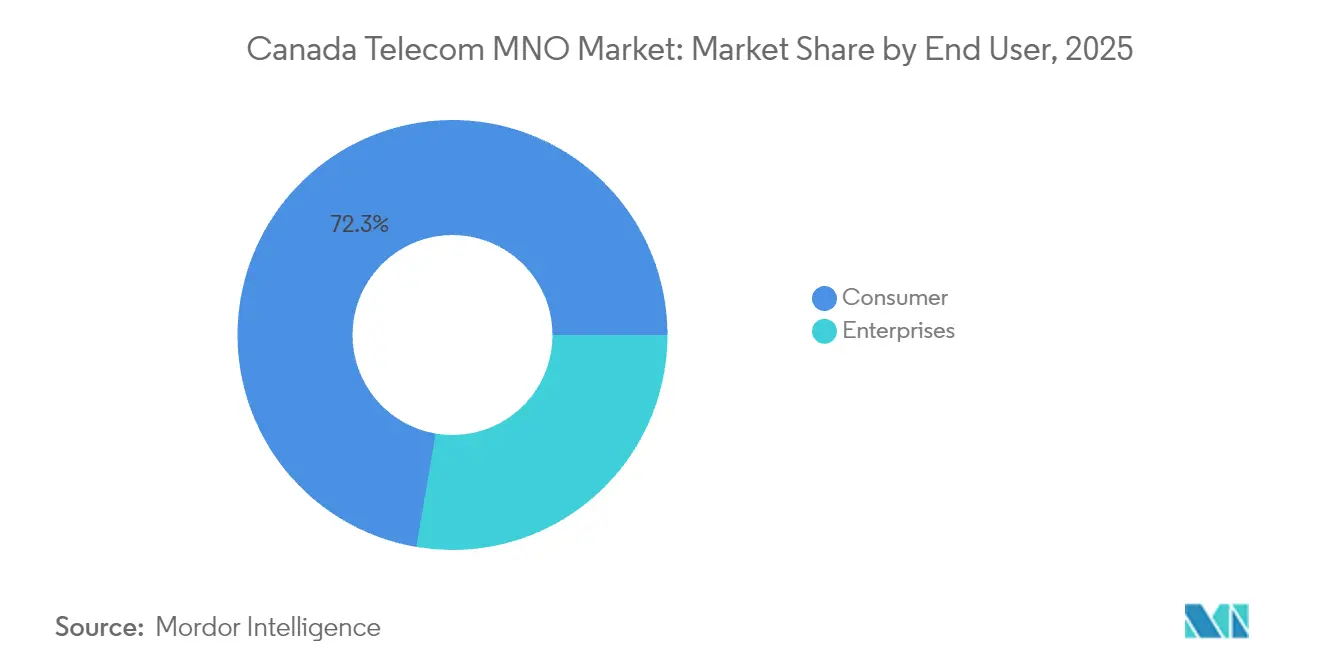
- By end user, the Consumer segment accounted for 72.30% of revenue in 2025, whereas the Enterprise segment is forecast to grow at 5.12% CAGR to 2031.
Note: Market size and forecast figures in this report are generated using Mordor Intelligence’s proprietary estimation framework, updated with the latest available data and insights as of 2026.
Canada Telecom MNO Market Trends and Insights
Drivers Impact Analysis*
| Driver | (~) % Impact on CAGR Forecast | Geographic Relevance | Impact Timeline |
|---|---|---|---|
| 5G rollout and handset upgrade cycle | +1.8% | Toronto, Vancouver, Montréal, national spill-over | Medium term (2-4 years) |
| Surge in data consumption and unlimited plans | +1.5% | Urban centers nationwide | Short term (≤ 2 years) |
| Federal funding for rural fiber builds | +0.9% | Rural and remote regions, Indigenous communities | Long term (≥ 4 years) |
| Enterprise IoT adoption (eSIM, LPWAN) | +1.2% | Alberta and Ontario manufacturing corridors, national | Medium term (2-4 years) |
| Indigenous community-owned connectivity | +0.4% | Northern territories and remote Indigenous areas | Long term (≥ 4 years) |
| MVNO-friendly wholesale rate reforms | +0.7% | National | Short term (≤ 2 years) |
| Source: Mordor Intelligence | |||
5G network deployment accelerates enterprise transformation
Major mobile network operators have surpassed 85% population coverage with 5G service, and the technology is now influencing enterprise architecture far beyond enhanced smartphone speeds. Bell activated 3800 MHz spectrum clusters in Toronto and Kitchener–Waterloo that deliver peak 4 Gbps throughput, enabling latency-sensitive manufacturing use cases such as machine-vision quality control and real-time telehealth diagnostics. [3]Bell Canada, “Bell 5G 3800 MHz Trial Results,” bell.ca Nutrien uses an underground private LTE network in its Saskatchewan potash mine to monitor worker safety and automate heavy equipment, reducing downtime and incident rates. Rogers and Expeto have commercialized Enterprise First private-network solutions that give large firms direct policy control over mobile assets without relying on public cores . Together, these deployments establish a proof-of-value cycle that is expected to widen enterprise spend per connection and sustain elevated capital intensity for operators.
Data consumption surge drives unlimited-plan proliferation
Mobile data traffic has increased from 3.4 million PB in 2022 to a projected 9.7 million PB by 2027, powered by remote work, video streaming, and a net immigration wave that added more than 1 million residents between 2022 and 2023. Freedom Mobile responded by folding 5G+ access into every monthly plan and adding cost-competitive roaming in more than 100 markets to siphon share from the incumbents. Unlimited tiers reduce churn and lengthen customer lifetime value for all carriers but require continuous RAN densification to avoid congestion. Operators consequently earmark a growing share of annual capex for mid-band spectrum utilization, small-cell builds, and traffic-offload partnerships with cable Wi-Fi footprints.
Federal connectivity investments transform rural infrastructure
The Universal Broadband Fund injects USD 3.225 billion in grants and low-interest loans and has already connected over 1,100 communities—nearly quadruple its original goal—through the Connect to Innovate branch program. Provincial co-funding compounds impact, such as British Columbia’s USD 830 million target to reach universal service by 2027. In Nunavut, a USD 271 million CRTC Broadband Fund award launches a 1,300 km subsea fiber line, replacing satellite backhaul for four Inuit communities and opening incremental revenue pools for backhaul wholesalers. These initiatives lower build-out cost per premise, accelerate the commercial payoff of rural expansion, and narrow the urban-rural speed gap.
Enterprise IoT adoption accelerates across key sectors
TELUS reports IoT network footprint coverage of 87% of Canadians, supporting NB-IoT, LTE-M, and 5G SA slices for sector-specific deployments. Bell partners with Farmers Edge for precision agriculture that automates fertilizer scheduling via remote sensor telemetry. ExactET irrigation projects cut landscape water use by 40% by harnessing TELUS IoT data streams to trigger localized watering. Henry of Pelham Winery overlays Bell LTE-M sensors on fermentation tanks to control temperature in real time, minimizing spoilage and energy expense. These case studies illustrate a transition from pilot projects to scale production as enterprises quantify operational cost savings that exceed recurring connectivity fees.
Restraints Impact Analysis*
| Restraint | (~) % Impact on CAGR Forecast | Geographic Relevance | Impact Timeline |
|---|---|---|---|
| Spectrum and infrastructure capex burden | -1.4% | National, most acute for rural roll-outs | Medium term (2-4 years) |
| Regulatory retail price ceilings | -0.8% | Nationwide, high-tier service packages | Short term (≤ 2 years) |
| Municipal small-cell permit delays | -0.6% | Toronto, Vancouver, Calgary downtown cores | Medium term (2-4 years) |
| Cybersecurity compliance costs (Huawei ban) | -1.1% | All provinces, especially among tier-1 MNOs | Long term (≥ 4 years) |
| Source: Mordor Intelligence | |||
Spectrum acquisition costs constrain network investment
Canadian operators have paid USD 8.9 billion for airwaves since 2021, locking in near-term leverage ratios above historical norms and squeezing discretionary cash for RAN densification. Rogers alone invested USD 3.3 billion for 3500 MHz licenses and subsequently raised USD 7 billion through an infrastructure joint venture with Blackstone to recycle capital into coverage expansion. TELUS argues that auction design inflated clearing prices by roughly USD 1.1 billion and ultimately raises end-user costs. Smaller challengers face even higher relative burdens, risking slower build plans and potentially diluting the competitive benefits policy makers intended.
Cybersecurity compliance costs escalate infrastructure investments
The federal prohibition of Huawei and ZTE equipment sets removal deadlines of June 2024 for 5G and December 2027 for 4G gear, with Bill C-26 adding mandatory incident-reporting duties and certified cyber programs. Operators must write down stranded assets, source approved vendors, and integrate continuous threat-monitoring platforms that push up opex. Penalties for non-compliance reach 10-figure magnitudes, effectively compelling accelerated vendor swaps even where equipment still operates within original life cycles.
*Our forecasts treat driver/restraint impacts as directional, not additive. The impact forecasts reflect baseline growth, mix effects, and variable interactions.
Segment Analysis
By Service Type: Data services underpin revenue expansion
Data and Internet Services contributed the largest revenue pool at 53.60% in 2025 and are projected to widen their lead as video streaming, cloud gaming, and real-time collaboration apps become ingrained in daily usage. The segment’s weight means it is the primary determinant of the Canada Telecom MNO market trajectory. IoT and M2M Services represent the fastest-growing niche, expected to post 5.15% CAGR to 2031 as enterprises deploy sensor networks for asset tracking, predictive maintenance, and smart-city systems. While Voice Services still monetize legacy plan allowances, their share declines as over-the-top substitutes like WhatsApp and FaceTime cannibalize minutes. Messaging revenue similarly tapers off, but premium A2P traffic (e.g., two-factor authentication) softens the fall. OTT and PayTV Services face cord-shaving behavior; yet, operators use bundling to preserve average revenue per account. Other Services, including wholesale backhaul and international roaming, receive an uplift under new MVNO regulations that broaden third-party access at regulated tariffs.
The Canada Telecom MNO market size for Data and Internet Services is projected to reach USD 35.62 billion by 2031, while IoT and M2M revenues are predicted to surpass USD 4.43 billion on the back of LPWAN roll-outs. Collectively, service diversification helps insulate the revenue mix against voice stagnation and supports the overall Canada Telecom MNO market expansion path.


By End User: Enterprise demand accelerates digital adoption
The Consumer segment retained 72.30% share in 2025, fueled by population growth and sustained appetite for unlimited plans. However, enterprise accounts will expand at 5.12% CAGR through 2031, meaning they will capture a progressively larger slice of incremental revenue. Private LTE deployments in remote mining operations, programmable SIM profiles for logistics fleets, and hospital tele-diagnostics illustrate the shift from best-effort public networks to deterministic, SLA-based connectivity. Telecom operators now bundle managed security and edge-compute to raise switching costs, and spectrum auctions carve out local-licensing options that permit companies to own or lease capacity directly.
Canada Telecom MNO market share for the Enterprise segment is likely to edge up by 5.80 percentage points by 2031, supported by regulatory clarity on local licensing and falling equipment prices for 5G industrial gear. The Canada Telecom MNO industry therefore evolves toward a dual-track model where mass-market consumer traffic funds baseline coverage and higher-margin enterprise use cases bankroll next-generation innovation.
Geography Analysis
Ontario and Quebec account for an estimated 59.80% of Canada Telecom MNO market revenue, anchored by dense urban clusters and extensive fiber backhaul. Bell’s activation of 3800 MHz channels in Toronto and Kitchener–Waterloo attains headline speeds of 4 Gbps, underscoring the performance gap that often separates central Canada from the rest of the country. Montréal’s vibrant AI ecosystem also acts as an early adopter of 5G low-latency features for edge inference workloads.
Alberta and British Columbia are the fastest-growing provincial clusters, with resource-sector automation and provincial-federal matching grants driving above-average network spend. The USD 830 million British Columbia digital infrastructure agreement targets universal connectivity by 2027, while Alberta mining firms increasingly mandate private network coverage beyond public grid boundaries. Freedom Mobile leverages its peak-capacity 5G+ spectrum to grab suburban market share, adding 373,300 connections in 2024 after completing network densification in Edmonton, Calgary, and Vancouver outer rings.
The Atlantic provinces and Northern territories remain small in absolute terms but contribute outsized growth owing to high service gaps that carry large addressable upside once fiber or satellite backhaul reaches critical mass. The Nunavut subsea fiber project alone unlocks opportunities for backhaul leasing, enterprise VPNs, and government agency links. A landmark deal that enables Indigenous communities to acquire Northwestel for up to USD 1 billion illustrates a governance model where community ownership aligns service design with local socioeconomic goals. The result is a corridor of new wholesale customers and a test case for reconciliatory infrastructure investment.
Regulatory Landscape
Canada's telecom MNO framework operates under the CRTC and ISED, guided by the Renewed Approach to Telecommunications Policy (SOR/2023-23). Amendments to the Telecommunications Act came into force on 30 October 2025 with consumer protections around contract modification and cancellation; new plan switching and cancellation protections take effect on 12 June 2026.
Competitive Landscape
Rogers, Bell, and TELUS collectively held roughly 90% of wireless revenue in 2024, reflecting high network-build entry barriers and historic spectrum aggregation. The acquisition of Freedom Mobile by Quebecor created a fourth national carrier that now operates across Ontario, Alberta, and British Columbia. Its aggressive pricing catalyzed an 18.2% national average decline in wireless tariffs during 2023, forcing incumbents to prioritize experience differentiation via network quality and bundled services.
Capital recycling strategies feature prominently in competitive playbooks. Rogers secured USD 7 billion in outside equity for its tower and fiber assets while retaining operational control, freeing funds for coverage densification without balance-sheet stress. Bell paid USD 5 billion to purchase Ziply Fiber, adding 2.3 million passings in the United States and vaulting its combined fiber footprint to 12 million. TELUS continues to focus on sector-specific verticals such as health, ag-tech, and smart cities to protect margins amid retail-price moderation.
Technology partnerships form a secondary battleground. Rogers licenses Comcast’s DOCSIS 4.0 architecture to enable symmetrical multi-gig cable speeds nationwide. TELUS collaborates with WestJet to deliver complimentary in-flight Starlink broadband, a perk designed to showcase brand innovation and cross-sell to frequent flyers. Meanwhile, satellite-to-handset initiatives gain traction as Rogers launches an SMS-over-satellite beta that covers 5.4 million km², thereby reducing dead-zone churn risk and positioning the operator as a first mover in direct-to-device services.
Canada Telecom MNO Industry Leaders
Rogers Communications Inc.
Telus Communications Inc.
Freedom Mobile (Videotron)
Bell Canada
- *Disclaimer: Major Players sorted in no particular order

Market Opportunities and Future Outlook
Regulated wholesale access and rural deployment subsidies anchor near-term whitespace for MNOs and MVNOs. The final aggregated wholesale high-speed access rates effective 24 April 2026 create room for tiered wholesale offerings, including managed Wi-Fi, backhaul, and enterprise connectivity bundles, while protecting margins through service differentiation. Rural and underserved builds are being pulled forward by public programs and provincial initiatives, including the CRTC Broadband Fund and Quebec's Opération couverture cellulaire phase three to add 17 new cell towers by September 2028 operated by Bell Canada, Sogetel Mobilité, TELUS, and Vidéotron.
Recent Industry Developments
- July 2026: Rogers Communications Inc. signed an agreement to acquire the remaining 25% ownership stake in Maple Leaf Sports & Entertainment (MLSE) from Kilmer Sports Inc. for C$4.35 billion, pending league approvals. The action consolidates a high value media asset with potential cross-sell opportunities in telecom bundles, reinforcing the operator's media rights footprint.
- June 2026: Rogers Communications Inc. announced receiving the Best and Most Reliable 5G+ Network award from umlaut for the eighth consecutive year. The validation supports competitive positioning through proven network quality.
- May 2026: TELUS Communications Inc. announced commitment to invest over $66 billion in Canada through 2030 to expand network infrastructure and support AI development. The scale of capex strengthens network leadership and AI enabled offerings across the country, influencing market dynamics and competitive ability.


Research Methodology Framework and Report Scope
Market Definition and Coverage
For this report, the market covers telecom mobile network operator services delivered in Canada, measured as service revenue generated from connectivity and related mobile service categories across consumer and enterprise users.
Scope exclusions: Revenues from device sales, handset financing, and most non-telecom digital or media businesses are excluded from this market sizing.
Segmentation Overview
- Overall Telecom Revenue and ARPU
- Service Type
- Voice Services
- Data and Internet Services
- Messaging Services
- IoT and M2M Services
- OTT and PayTV Services
- Other Services (VAS, Roaming and International Services, Enterprise and Wholesale Services, etc.)
- End-User
- Enterprises
- Consumer
Data Sources, Market Sizing, and Validation
Desk Research
Desk research started with public market indicators that can be checked year over year, and then it was narrowed to the MNO revenue pool. We relied on official and non-paywalled sources such as CRTC Telecom Monitoring reports, Statistics Canada releases on communications services, Innovation, Science and Economic Development Canada spectrum and licensing updates, and OECD telecom indicators to frame demand, pricing, and adoption direction.
We then layered in company filings, investor presentations, audited annual reports, and credible press coverage to map the service mix and timing of pricing moves. In a few places, paid subscriptions were used for company financials and intelligence (news, financials) and patent databases, mainly to confirm timelines and fill gaps in disclosure. These examples are not exhaustive, and many other sources were also used to collect data, validate assumptions, and clarify open research points.
Primary Interviews and Surveys
Primary work focused on interviews and surveys with operator-side roles, channel and infrastructure stakeholders, and enterprise telecom buyers who influence plan selection and fleet policies. We covered major provinces and a mix of urban and rural contexts so adoption, churn, and network upgrade impacts could be cross-checked, and then assumptions from desk research were adjusted when repeated feedback showed a consistent difference.
Distribution of primary research fieldwork respondents
| Company type | Respondent position |
|---|---|
| Top tier: 35% | CXOs: 13% |
| Mid tier: 48% | Functional/Unit leaders: 36% |
| Smaller Players: 17% | Managers: 51% |
Market-Sizing & Forecasting
Market sizing was built using a top-down approach where national telecom service revenue and mobile service splits were reconstructed from official reporting series, and then filtered to the MNO-only service scope. The totals were corroborated with selective bottom-up approximations, mainly by using sampled plan pricing multiplied by subscriber counts, plus channel checks on service mix, which helped us adjust outliers without forcing a full supplier roll-up.
Inputs used in the model included mobile subscriber base and net adds, service revenue mix across voice and data, ARPU direction, 5G coverage and upgrade cadence, and enterprise line growth versus consumer lines. Where a variable was not consistently reported, a gap-handling step was used by anchoring to the closest official time series and validating the implied trend with interview feedback. For forecasting, we leaned on scenario analysis linked to ARPU progression and subscriber growth, and then stress-tested it using expected effects from pricing actions, migration to higher data plans, and macro sensitivity shared by respondents.
Data Validation & Update Cycle
Before numbers are finalized, we run multi-step checks that compare the model output against independent signals such as reported telecom revenues, subscriber trends, and visible price-plan movements in the market. Any unusual jumps are reviewed, and follow-up outreach is triggered when a change cannot be explained by known events like acquisitions, spectrum outcomes, or major plan repricing.
A second analyst review is completed for assumption logic, unit consistency, and currency handling, and only then is the final view signed off. Reports are refreshed annually, and interim updates are made when material events affect market direction. Right before delivery, a fresh data pass is completed so clients receive the most current version available.
Mordor Intelligence's Canada Telecom Market Size Compared With Other Published Estimates
Published market size values for Canada telecom can look far apart because the scope line is drawn differently, and because pricing and subscriber inputs are refreshed at different times. We keep the sizing traceable to a clear revenue pool, and then cross-check it using public reporting series plus primary feedback so the final number is not driven by a single assumption.
Device sales and handset financing sit outside Mordor Intelligence's scope for this study, which is a common reason some published figures land higher when they blend services with hardware revenue. Differences also come from whether the estimate counts only mobile network operator services or blends in fixed broadband, pay TV, or broader communications services, and from how ARPU changes are projected during 5G plan migration. Another gap driver is timing, since exchange rates, promotional intensity, and annual reporting updates can move the value even if underlying usage stays steady.
Benchmark comparison
| Source | Market Size | Gaps in Research Methodology |
|---|---|---|
| Mordor Intelligence | USD 49.96 B (2025) | |
| Industry Regulator Summary A | USD 59.62 B (2024) | Uses total telecom services revenue across the sector, which can include fixed Internet, local and long distance, and other service lines beyond the MNO-only service basket, and it reflects a different base year. |
| Industry Association Brief B | USD 56.90 B (2025) | Often cites a broader operator revenue view that can include non-core lines and different treatment of bundled offers, and it may apply simplified ARPU growth assumptions without separately validating subscriber mix shifts. |
The comparison points to scope and timing as the main reasons for the spread, especially when total telecom services are mixed with mobile-only services or when hardware-linked revenue is not separated. By keeping the model anchored to service revenue categories and checking it against subscriber and ARPU signals, we can provide a number that is easier to reproduce and explain on a planning call.


Key Questions Answered in the Report
How large is the Canada Telecom MNO market in 2026?
The Canada Telecom MNO market size stands at USD 52.28 billion in 2026 and is forecast to reach USD 65.59 billion by 2031.
What is the expected growth rate of wireless revenue over the next five years?
Aggregate revenue is projected to grow at a 4.65% CAGR from 2026 to 2031, driven by data-centric services and enterprise IoT demand.
Which service segment grows fastest through 2031?
IoT and M2M Services post the highest forecast CAGR of 5.15% as industries adopt connected sensors and private networks.
How will 5G coverage expand in rural Canada?
Federal programs such as the USD 3.225 billion Universal Broadband Fund subsidize backhaul and last-mile builds, leading to full 5G coverage in many rural and Indigenous regions by 2027.
What competitive change most affects consumer pricing?
Freedom Mobile’s nationwide expansion under Quebecor has already driven an 18.2% drop in average wireless tariffs and is expected to maintain downward pressure on prices through 2026.
How does spectrum cost impact capital allocation?
Operators spent USD 8.9 billion on recent auctions, creating balance-sheet strain that they offset through tower monetization and infrastructure joint ventures.
Page last updated on:


 Your data is secure and never sold or shared.


