
Market Overview
| Study Period | 2021 - 2031 |
|---|---|
| Forecast Data Period | 2026 - 2031 |
| Base Year Market Size (2025) | 6.58 gigawatt |
| Market Volume (2026) | 7.12 gigawatt |
| Market Volume (2031) | 10.25 gigawatt |
| Growth Rate (2026 - 2031) | 7.54 % |
| Market Concentration | Medium |
Major Players *Disclaimer: Major Players sorted in no particular order Image © Mordor Intelligence. Reuse requires attribution under CC BY 4.0. | |
Canada Solar Energy Market Analysis by Mordor Intelligence
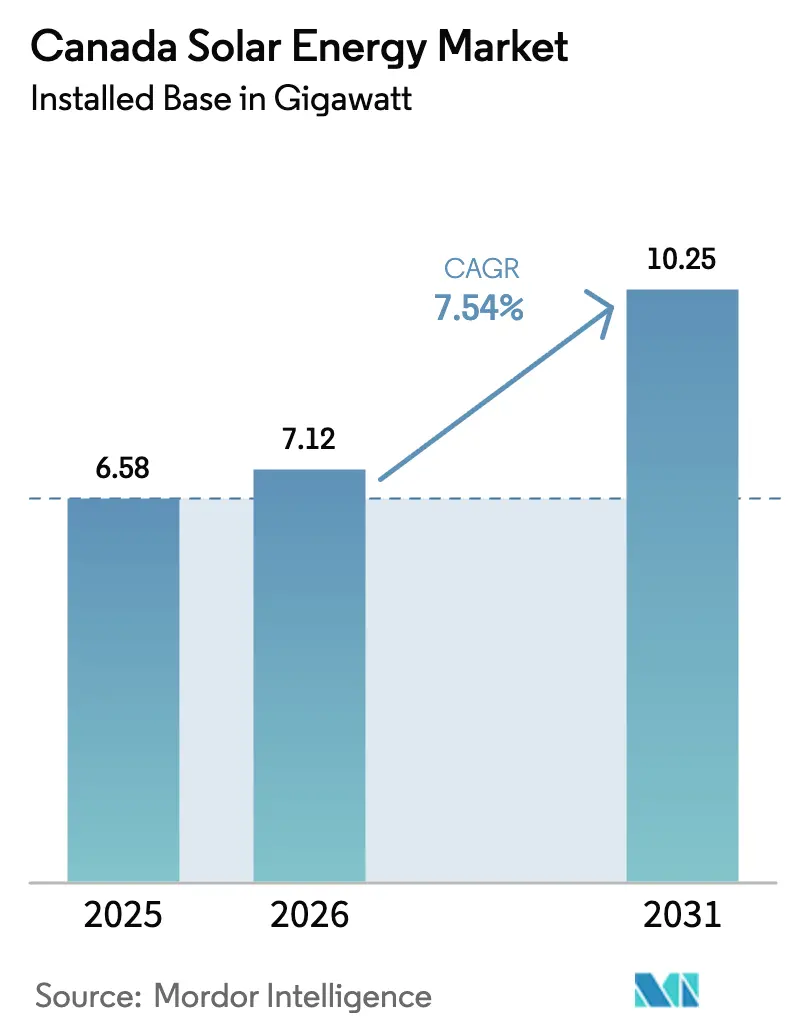
The Canada Solar Energy Market in terms of installed base was valued at 6.58 gigawatt in 2025 and expected to grow from 7.12 gigawatt in 2026 to reach 10.25 gigawatt by 2031, at a CAGR of 7.54% during the forecast period (2026-2031).
Federal investment tax credits, faster coal-plant retirements, and a jump in corporate power-purchase agreements are accelerating utility-scale procurement schedules even as provincial regulators tighten interconnection procedures. Alberta’s decision in early 2025 to end a seven-month pause on renewable approvals immediately freed more than 2 GW of shovel-ready capacity, underscoring that permitting timelines now steer deployment speed more than technology costs. Ottawa’s 30% clean-technology manufacturing credit, active since March 2024, is already lowering landed module costs by as much as 12% and cutting supply-chain lead times to under ten weeks for tier-one developers. Utility-scale projects still dominate the installed base, yet the off-grid segment is growing at a 9.9% CAGR as Indigenous communities adopt solar-plus-storage microgrids to replace diesel. Competitive pressure is increasing as vertically integrated manufacturers use domestic production to underprice stand-alone independent power producers by nearly 8% on a levelized basis.
Key Report Takeaways
- By technology, solar photovoltaic held 100% of the Canada solar energy market share in 2025; bifacial upgrades are expanding the segment at a 7.54% CAGR through 2031.
- By grid type, on-grid assets accounted for 67.1% of installed capacity in 2025, while off-grid systems are advancing at a 9.9% CAGR as diesel displacement accelerates in northern territories.
- By end-user, utility-scale plants represented 57.6% of capacity in 2025, but residential rooftops are growing fastest at a 10.2% CAGR on the back of strengthened net-metering programs in Ontario and British Columbia.
Note: Market size and forecast figures in this report are generated using Mordor Intelligence’s proprietary estimation framework, updated with the latest available data and insights as of January 2026.
Canada Solar Energy Market Trends and Insights
Drivers Impact Analysis*
| Driver | (~) % Impact on CAGR Forecast | Geographic Relevance | Impact Timeline |
|---|---|---|---|
| Accelerating provincial RPS and clean-energy auctions | +1.8% | Alberta, Saskatchewan, Ontario | Medium term (2-4 years) |
| Accelerated coal-to-renewables displacement mandate | +1.5% | Alberta, Saskatchewan, Nova Scotia | Short term (≤ 2 years) |
| Declining LCOE of bifacial and TOPCon PV modules | +1.2% | National, with early gains in Alberta, Ontario | Long term (≥ 4 years) |
| Corporate PPAs from data-center and mining sectors | +1.0% | Ontario, Quebec, British Columbia | Medium term (2-4 years) |
| Federal 30% ITC on clean-tech manufacturing (2024 Budget) | +0.9% | National, manufacturing hubs in Ontario, Quebec | Long term (≥ 4 years) |
| AI-optimized grid-integration software adoption | +0.6% | Alberta, Ontario (IESO, AESO grids) | Medium term (2-4 years) |
| Source: Mordor Intelligence | |||
Accelerating Provincial RPS & Clean-Energy Auctions
Competitive procurements in Alberta, Saskatchewan, and Ontario continue to push bid prices below CAD 50 per MWh and provide developers with long-term revenue certainty that lowers debt costs by up to 50 basis points. Auction calendars published two years in advance allow suppliers to lock in module contracts early, which in turn reduces construction risk and accelerates balance-sheet commitments from institutional investors.[1]Independent Electricity System Operator, “2026 Resource Procurement Plan,” ieso.ca Indexed pricing mechanisms, where tariffs glide with inflation but cap annual escalation, further protect cash flows for pension-fund financiers.
Accelerated Coal-To-Renewables Displacement Mandate
Federal regulations that end coal generation by 2030 are forcing utilities in Alberta and Saskatchewan to bring replacement solar and storage online faster than previously scheduled. Retiring coal sites supply existing transmission corridors, cutting connection costs by as much as CAD 200 million per GW. New solar farms deployed adjacent to decommissioned units access pre-built substations, shaving nine to twelve months from project timelines and raising internal rates of return by roughly two percentage points for sponsors such as TransAlta and Capital Power.
Declining LCOE of Bifacial & TOPCon PV Modules
Domestic production of bifacial TOPCon modules with 24.5% efficiency began in Ontario in late 2024, bringing module prices below USD 0.16 per watt after federal incentives. Higher yield lifts capacity factors beyond 20% in southern Alberta, enabling solar to compete directly with gas peakers that cleared Alberta’s energy-only market at an average CAD 87 per MWh in 2025. Balance-of-system costs fall 10% per installed watt because fewer modules are needed to reach the same output.
Corporate PPAs from Data-Center & Mining Sectors
Hyperscale operators booked 2.3 GW of long-term solar contracts by end-2025, with AWS and Microsoft each signing 200-MW-plus deals priced below CAD 50 per MWh. These agreements stabilize cash flows, allowing projects to obtain non-recourse loans at rates 100-basis-points cheaper than merchant plants. In remote mining, Teck Resources showed that a 20 MW solar-plus-storage system can remove 12 million liters of diesel annually and cut operating expenditure by CAD 18 million.
Restraints Impact Analysis*
| Restraint | (~) % Impact on CAGR Forecast | Geographic Relevance | Impact Timeline |
|---|---|---|---|
| Interconnection queue congestion in Alberta & Ontario | -0.8% | Alberta, Ontario - provinces with centralized grid operators and capacity-constrained transmission corridors | Short term (≤ 2 years) |
| Seasonal irradiance mismatch affecting capacity-factors | -0.5% | National, with acute impact in northern Ontario, Quebec, and Atlantic provinces where winter capacity factors drop below 12% | Long term (≥ 4 years) |
| Rising anti-dumping vigilance on Asian module imports | -0.8% | National, with heightened scrutiny on Southeast Asian manufacturers with alleged Chinese ownership links | Medium term (2-4 years) |
| Skilled-labour shortages in remote provinces | -0.5% | Saskatchewan, Manitoba, Atlantic provinces, and northern territories—regions with limited solar installation workforce | Medium term (2-4 years) |
| Source: Mordor Intelligence | |||
Interconnection Queue Congestion in Alberta & Ontario
System-impact studies stretch to 18 months in Alberta and 24 months in Ontario, delaying project cash flows and eroding developer returns.[2]Alberta Electric System Operator, “2025 Solar Integration Study,” aeso.ca Fast-track pathways for projects under 50 MW shorten timelines to nine months, yet utility-scale assets that account for 58% of provincial capacity additions remain subject to lengthy reviews. Cluster-study pilots that evaluate multiple projects together may cut per-project costs by 30%, but full deployment is unlikely before 2027.
Seasonal Irradiance Mismatch Affecting Capacity Factors
Canada’s high-latitude profile creates a six-month output imbalance that forces grid operators to maintain gas peakers for winter demand spikes, adding up to CAD 12 per MWh to system costs. Four-hour lithium-ion batteries can cover daily ramps but fall short during week-long low-sun stretches. Developers respond by pairing solar with wind, which peaks in winter, raising combined capacity factors above 38% in hybrids such as Boralex’s 150 MW Apuiat project.
*Our forecasts treat driver/restraint impacts as directional, not additive. The impact forecasts reflect baseline growth, mix effects, and variable interactions.
Segment Analysis
By Technology: PV Dominates, CSP Absent
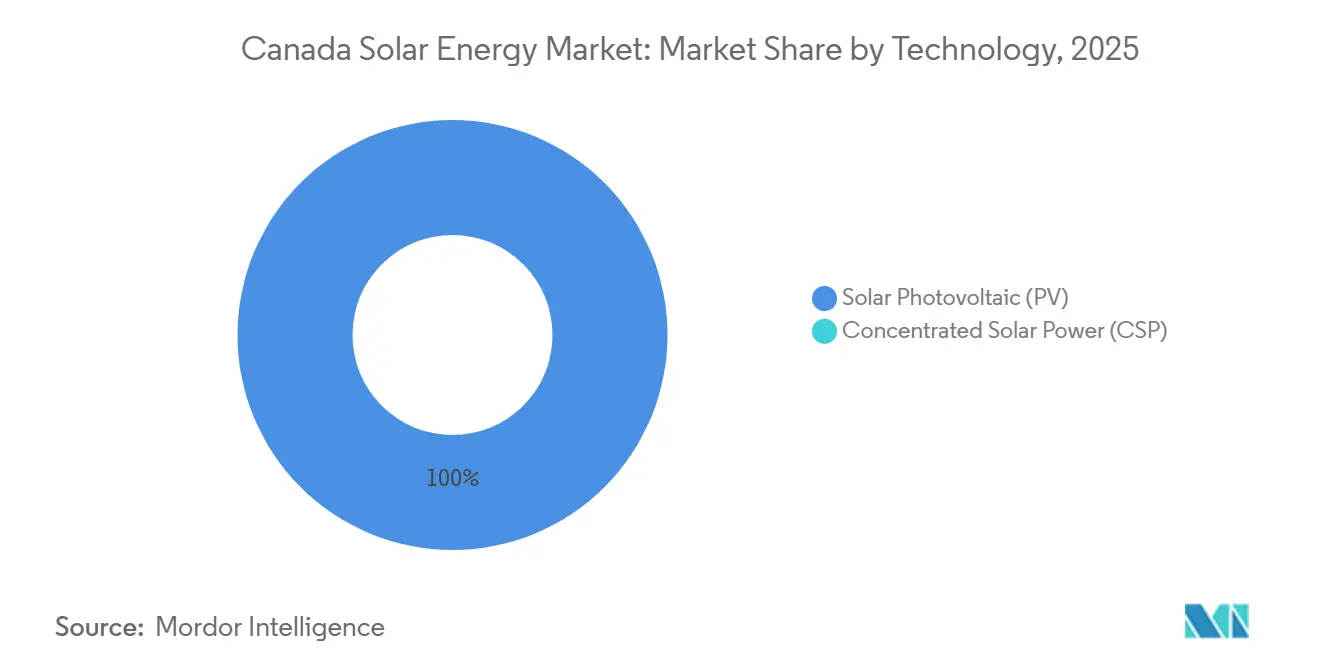
Photovoltaic systems represented the entire installed base in 2025 and will remain the sole commercial technology through 2031, expanding in lockstep with the overall Canada solar power market. Breakthroughs in bifacial TOPCon cells have pushed module efficiency to 24.5%, lowering installed costs to CAD 1,200 per kW for utility-scale plants. Fixed-tilt projects are giving way to single-axis trackers that lift annual energy yield by 20%, a gain that compensates for winter irradiance losses.
Cost and performance metrics leave concentrated solar power economically unviable because direct normal irradiance averages only 1,300 kWh per square meter compared with the 2,000 kWh benchmark required for CSP competitiveness.[3]Natural Resources Canada, “Photovoltaic Performance in Canada,” nrcan.gc.ca Half-cut cell formats, multi-busbar interconnects, and string inverters further raise production efficiency while trimming maintenance expense.


By Grid Type: Off-Grid Surges In Remote Regions
On-grid installations maintained 67.1% of capacity in 2025, driven by Alberta and Ontario auction pipelines. Yet off-grid systems are climbing at 9.9% CAGR as communities north of 60° latitude displace diesel that costs CAD 0.45 per kWh. Natural Resources Canada funded 18 microgrids totaling 35 MW in 2025, each pairing 4-hour to 8-hour batteries with PV arrays sized between 500 kW and 5 MW.
Diesel savings translate into six-year to nine-year paybacks even before carbon-price credits. Mining operators such as Agnico Eagle have validated economics by trimming 8 million liters of fuel annually at the Meadowbank site in Nunavut, confirming a template now replicating across Yukon and the Northwest Territories.
By End User: Residential Outpaces Utility-Scale Growth
Utility-scale facilities still held 57.6% of total capacity in 2025, but the residential slice is growing fastest at 10.2% CAGR. Net-metering reforms adopted in Ontario and British Columbia allow households to bank surplus generation for up to one year, slashing payback periods to six years on a 5 kW system priced near CAD 2.50 per watt.
Commercial-and-industrial customers follow close behind, motivated by time-of-use tariffs that can swing CAD 0.12 per kWh between peak and off-peak windows. Integrators such as Saturn Power bundle rooftop PV with 2-hour batteries and demand-response software, creating new revenue streams in Ontario’s capacity auction and ancillary-service markets.

Geography Analysis
Alberta commanded 42% of national solar capacity in 2025 thanks to superior isolation and an energy-only market that rewards flexible assets during high-price hours. Removing the 2024–2025 permitting pause unleashed 2 GW of ready-to-build projects, and the province expects solar additions to equal 35% to 40% of all new generation by 2030. Ontario followed with 28%, supported by a 2 GW clean-capacity tender that may allocate half of the awarded volume to solar-plus-storage assets slated for 2028 startup.
Saskatchewan is rising rapidly from a smaller base as SaskPower’s 300 MW solicitation targets brownfield sites at retiring coal plants where transmission is already in place, trimming interconnection costs by up to 50%.[4]SaskPower, “Solar RFP 2025,” saskpower.com British Columbia and Quebec have historically leaned on hydro, but now see faster rooftop uptake after net-metering revisions in 2025 that expanded credit-carry rules for households and data-center operators.
Remote northern territories deploy solar-plus-storage microgrids to displace imported diesel. Eighteen funded projects totaling 35 MW relied on Natural Resources Canada’s Indigenous Off-Diesel Initiative, producing fuel savings of up to 75% and reducing generation costs by CAD 0.30 per kWh. Atlantic provinces lag because of lower irradiance and constrained transmission, though Nova Scotia Power’s 100 MW tender announced in 2025 suggests early momentum as the last coal unit retires in 2030.
Regulatory Landscape
Canada's solar deployment is shaped by federal decarbonization rules and refundable tax credits, alongside province-specific permitting and grid-connection requirements. At the federal level, the Clean Electricity Regulations (SOR/2024-263), published in December 2024, set a net-zero pathway for the electricity system by 2035 through annual emissions limits for fossil-fuel units. This reinforces the coal phase-out trajectory and increases the value of non-emitting generation and hybrids. Investment support is anchored by the refundable Clean Technology Investment Tax Credit (up to 30%) for eligible photovoltaic electrical generation equipment acquired and available for use from March 28, 2023 through December 31, 2034, complemented by the Clean Electricity Investment Tax Credit (up to 15%) with technical guidance administered by Natural Resources Canada.
Provincial frameworks determine execution speed and compliance burdens. In Alberta, projects fall under Alberta Utilities Commission oversight and are registered through the Digital Regulatory Assurance System (DRAS) under the Code of Practice for Solar and Wind Renewable Energy Operations, which raises land-use, reclamation, and operating requirements as development pipelines restart following the 2024-2025 approval pause. In British Columbia, the Renewable Energy Projects (Streamlined Permitting) Act (effective July 1, 2025) expands the BC Energy Regulator's role, and B.C. Regulation 28/2026 under the Energy Resource Activities Act introduces solar project standards including glare prevention. In Nova Scotia, Renewable Electricity Regulations require Nova Scotia Power Inc. to procure at least 160 GWh of dispatchable renewable electricity annually from 2025 to 2027. This supports firmed renewable procurement structures where solar can participate through storage-backed or hybrid configurations.
Competitive Landscape
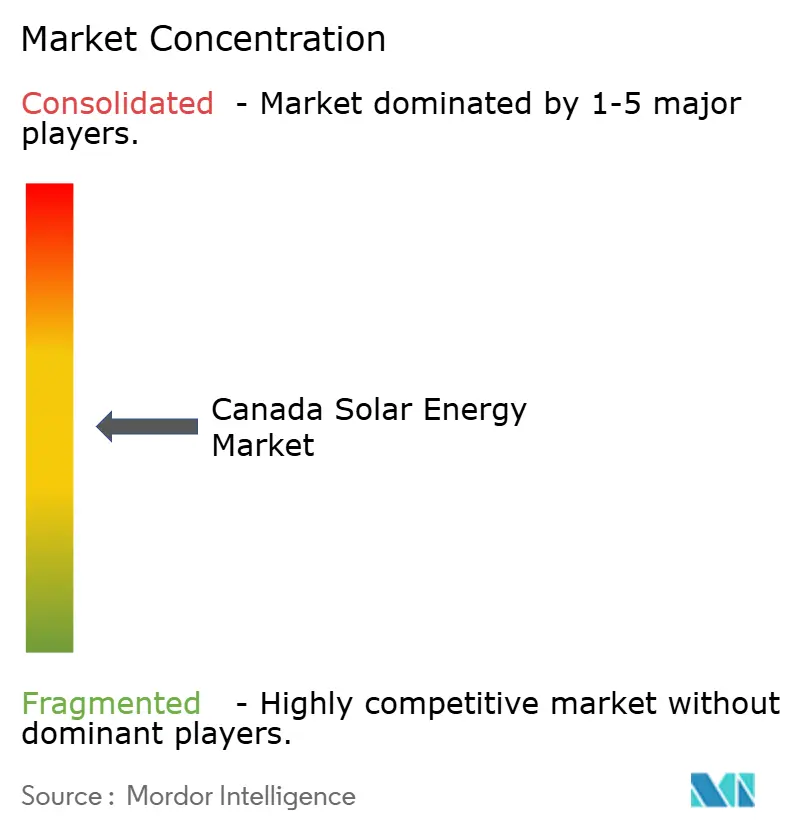
The Canada solar power market is moderately fragmented. The five largest players, Canadian Solar, Brookfield Renewable, Boralex, Innergex, and EDF Renewables, jointly controlled about 48% of installed capacity in 2025, but no single participant exceeded a 12% share. Vertically integrated manufacturers capitalize on domestic module production to underprice independent developers by up to 8% on levelized cost, while international firms such as EDF Renewables leverage global procurement to secure lower-cost financing.
Strategic moves pivot toward supply-chain localization. Canadian Solar added 1 GW of annual assembly capacity in Ontario under the 30% investment tax credit, and Siemens Energy will open a 500 MW inverter line in Quebec during 2026. Brookfield Renewable expanded via the acquisition of a 150 MW Alberta portfolio in 2024, signaling a gradual consolidation path. Indigenous-owned developers like Lumos Energy continue to capture niche off-grid projects with community-equity models that resonate in federal grant programs.
Technology leadership is becoming a differentiator. Northland Power’s 200 MW Claresholm plant employs AI dispatch to time battery discharge for price spikes, lifting project returns by three percentage points in Alberta’s merchant market. Patent filings for bifacial optimization climbed 35% from 2023 to 2025, with Canadian Solar and Siemens Energy filing 40% of applications.
Canada Solar Energy Industry Leaders
Canadian Solar Inc.
Brookfield Renewable Partners
Boralex Inc.
Innergex Renewable Energy Inc.
EDF Renewables Canada
- *Disclaimer: Major Players sorted in no particular order

Market Opportunities and Future Outlook
Utility-scale contracting and firming needs are expanding the addressable market beyond standalone PV into solar-plus-storage and hybrid builds, particularly in provinces running competitive procurements. Ontario offers a clear example: in April 2026, Neoen Canada, in partnership with Garden River First Nation, secured a 20-year contract from the Independent Electricity System Operator for a 200 MWac (253 MWp) solar project near Sault Ste. Marie. The deal highlights how long-term offtake is accelerating large-site solar development and how Indigenous partnership models are being used to structure projects. Saskatchewan is also advancing utility-scale buildout tied to system transition needs, with construction starting on the Turning Sun Solar facility in Estevan (SaskPower/Greenwood Sustainable Infrastructure). The project received CAD 15 million in federal funding through the Smart Renewables and Electrification Pathways Program announced in June 2026.
Supply-chain localization is emerging as a competitive lever alongside the existing federal ITC structure. The Clean Technology ITC (up to 30%) and Clean Electricity ITC (up to 15%) support project and equipment investment, while the federal government opened consultations in February 2026 on potential domestic content requirements for these credits. This is pushing developers, EPCs, and manufacturers to align procurement strategies and documentation to remain eligible. On the distributed side, the whitespace is strongest in integrated offerings that package rooftop PV with batteries and EV infrastructure. That pattern is reflected in July 2026, when Stardust Solar Energy Inc. opened a new franchise location in the Kitchener-Waterloo region to serve residential and commercial customers with solar, storage, and EV charging solutions.
Recent Industry Developments
- June 2026: SaskPower and Greenwood Sustainable Infrastructure commenced construction of a major utility-scale solar project in Estevan, Saskatchewan, supported by CAD 15 million in Smart Renewables and Electrification Pathways Program funding. The project anchors near-term large-scale solar development in Saskatchewan and illustrates federal-provincial collaboration to advance solar buildouts.
- November 2025: Canadian Solar Inc.'s e-STORAGE contracted to deliver turnkey EPC services and 1.86 GWh of battery energy storage for the Skyview 2 Energy Storage Project in Ontario. The award strengthens e-STORAGE's position in Ontario's grid-firming buildout and ties Canadian Solar more directly to long-duration system-balancing needs that support higher penetrations of solar PV.
- December 2024: The Government of Canada announced CAD 152 million in funding for nine clean electricity projects in Alberta through the Smart Renewables and Electrification Pathways Program. The funding package supports grid modernization and renewable integration in Canada's largest solar province, tightening the linkage between transmission-readiness initiatives and solar project execution timelines.


Research Methodology Framework and Report Scope
Market Definition and Coverage
For this study, the Canada solar energy market is defined as the installed solar power base in Canada, tracked in gigawatts, across solar PV and CSP systems that generate electricity for on-grid and off-grid use.
Scope exclusions: We exclude non-solar renewable capacity and standalone grid equipment that is not directly tied to solar generation capacity additions.
Segmentation Overview
- By Technology
- Solar Photovoltaic (PV)
- Concentrated Solar Power (CSP)
- By Grid Type
- On-Grid
- Off-Grid
- By End-User
- Utility-Scale
- Commercial and Industrial (C&I)
- Residential
- By Component (Qualitative Analysis)
- Solar Modules/Panels
- Inverters (String, Central, Micro)
- Mounting and Tracking Systems
- Balance-of-System and Electricals
- Energy Storage and Hybrid Integration
Data Sources, Market Sizing, and Validation
Desk Research
Desk research was used to set the factual skeleton of the market, and then to keep the model anchored to Canada specific policy and grid realities. We relied on public and official sources such as Natural Resources Canada for energy context, Statistics Canada for macro baselines, the Canada Energy Regulator for system level views, and provincial system operators for capacity and interconnection signals. To keep the market narrative grounded, we also used public procurement and program pages for federal and provincial incentives, followed by reputable press and association releases that confirm timing of utility scale awards and commissioning.
A second desk pass focused on data that helps translate capacity movement into consistent annual adds, which is where filings, project announcements, and investor materials are useful even when some numbers are partial. In parallel, a paid subscription for company financials and another for patent and innovation tracking were used selectively to validate supply chain direction and price trend assumptions, without over leaning on any one source. The sources listed here are illustrative only, and many other public documents and data points were reviewed for collection, validation, and clarification.
Primary Interviews and Surveys
Primary work focused on checking what is actually getting built and connected, and what pricing and procurement terms look like in the current cycle. We spoke with a mix of developers, EPC and installer participants, equipment channel contacts, utilities facing teams, and large C&I buyers. Coverage was balanced across major demand pockets in Canada so assumptions could be corrected when desk sources were out of date. These inputs were used to validate grid type splits, typical system sizing, commissioning lags, and the realistic pace of additions.
Distribution of primary research fieldwork respondents
| Company type | Respondent position |
|---|---|
| Top tier: 27% | CXOs: 21% |
| Mid tier: 52% | Functional/Unit leaders: 25% |
| Smaller Players: 21% | Managers: 54% |
Market-Sizing & Forecasting
Sizing is built around a top-down reconstruction of Canada's solar installed base, where annual capacity additions are derived from project commissioning timelines and grid connection indicators, and then rolled into the total GW base. That total is subsequently checked using selective bottom-up approximations, including sampling typical project sizes by end user, using reported additions where they are public, and stress testing the implied build pace against on-ground channel feedback.
A few practical inputs drive most of the model, including annual installed capacity additions in GW, the share split between solar PV and CSP, the on-grid versus off-grid mix, and typical project size patterns across utility-scale and distributed deployments. Policy markers, such as tax credits and provincial procurement signals, were also treated as leading indicators because they change ordering behavior before capacity appears in the field. For forecasting, scenario analysis was used, with a base case shaped by expert consensus on connection queues, expected permitting lead times, and likely price movements for modules and balance of system, which then influences the pace of economically viable builds.
Where bottom-up visibility is incomplete, gaps are handled through conservative interpolation that is tied to known commissioning cadence and verified through re-checks with installer and developer respondents, and then adjusted if the implied run-rate conflicts with grid and policy signals.
Data Validation & Update Cycle
Validation is handled through a series of cross checks so that no single dataset can pull the result off course. Model outputs are compared against independent signals such as grid interconnection updates, announced commissioning dates, and observed changes in procurement activity, and then outliers are investigated before sign-off. When a variance is large, we re-contact relevant respondent types to confirm whether the shift is timing, scope, or a one-off project effect.
Reports are refreshed annually, and interim updates are made when there are material policy changes, major procurement rounds, or price shocks that change build economics. Before delivery, an analyst completes a fresh pass on key inputs so clients receive the most current view that can be supported by traceable assumptions.
Mordor Intelligence's Canada Solar Energy Market Sizing Compared With Other Published Estimates
Published market sizes for Canada solar can look far apart because the unit of measurement is not always the same and the timing behind the number is often unclear. Some sources report revenue, others report capacity, and even within capacity the boundary can shift based on whether pipeline projects are counted before commissioning.
The biggest practical gap drivers are refresh cadence and currency timing, followed by how prices are applied and validated. When estimates use a fixed average price for a full year, or keep an older exchange rate, revenue totals can drift quickly in periods where module pricing and procurement terms are moving. In our approach, the conversion logic is refreshed using current period price checkpoints and commissioning based validation, and then the final figure is locked using the latest consistent FX window, which is why Mordor Intelligence reports the market as installed capacity in GW rather than a revenue total for this title.
Benchmark comparison
| Source | Market Size | Gaps in Research Methodology |
|---|---|---|
| Mordor Intelligence | USD 6.58 B (2025) | |
| Industry Publisher A | USD 2.20 B (2024) | This figure is presented as a revenue value, which can understate or overstate the same market when pricing assumptions and the FX timing are not aligned with the commissioning calendar used for capacity. |
| Industry Publisher B | USD 6.80 B (2026) | This estimate appears to cover PV systems as a revenue market, so adjacent scope choices like what is counted as a system and how EPC and balance-of-system pricing is handled can shift totals compared with an installed base capacity view. |
The spread in the table mainly comes from mixing revenue and capacity views, plus differences in how often assumptions are refreshed and what timing window is used for pricing and currency conversion. By keeping the model tied to commissioning led capacity adds and using repeatable checks, the sizing stays easier to trace back to real build activity and year specific assumptions.


Key Questions Answered in the Report
How large is the Canada solar power market in 2026?
Installed capacity is on track to reach 7.12 GW by 2026, in line with the 7.54% CAGR trajectory.
Which province is adding solar capacity the fastest?
Alberta leads additions due to high insolation and an energy-only market that streamlines financing and dispatch.
What incentive supports domestic solar manufacturing?
A 30% refundable investment tax credit introduced in 2024 reduces capital costs for module, inverter, and racking production.
Are off-grid solar systems economical in northern Canada?
Yes, microgrids already cut diesel use by up to 75% and achieve six-year to nine-year paybacks, even before carbon credits.
How are corporate PPAs shaping new projects?
Data-center and mining firms locked in 2.3 GW of PPAs by 2025, providing bankable revenues that lower borrowing costs by up to 100 basis points.
Page last updated on:


 Your data is secure and never sold or shared.


