
Canada Pension Funds Market Size and Share
Market Overview
| Study Period | 2020 - 2031 |
|---|---|
| Forecast Data Period | 2026 - 2031 |
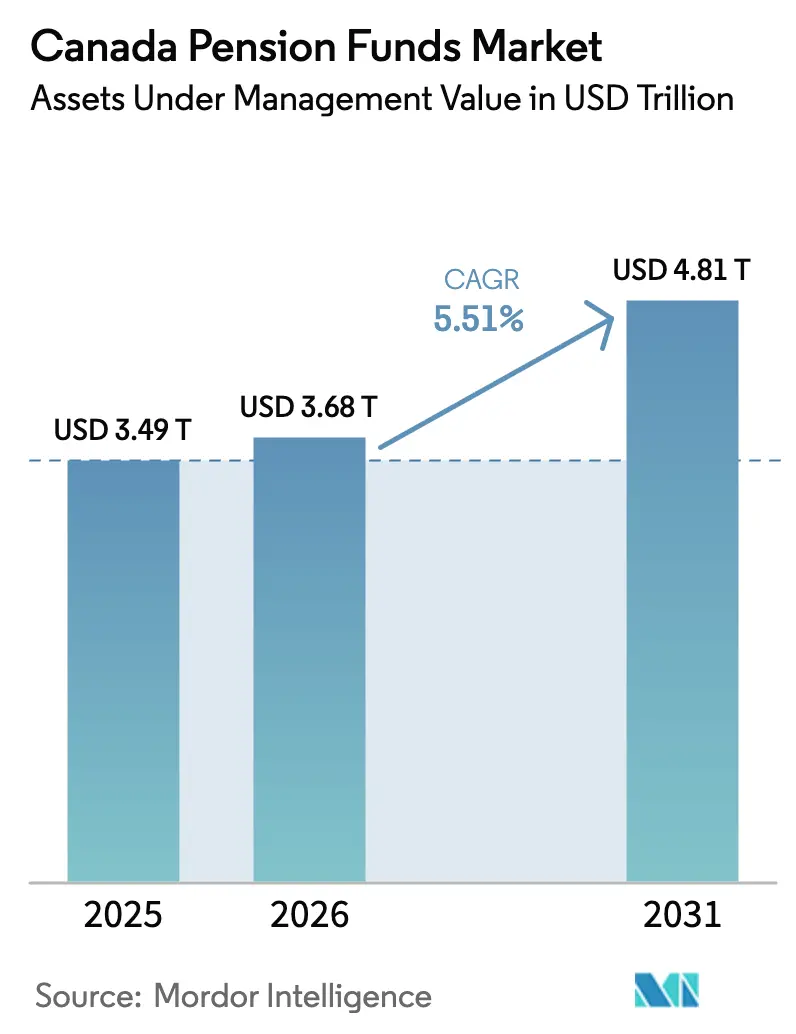
| Base Year Market Size (2025) | USD 3.49 Trillion |
| Market Size (2026) | USD 3.68 Trillion |
| Market Size (2031) | USD 4.81 Trillion |
| Growth Rate (2026 - 2031) | 5.51 % |
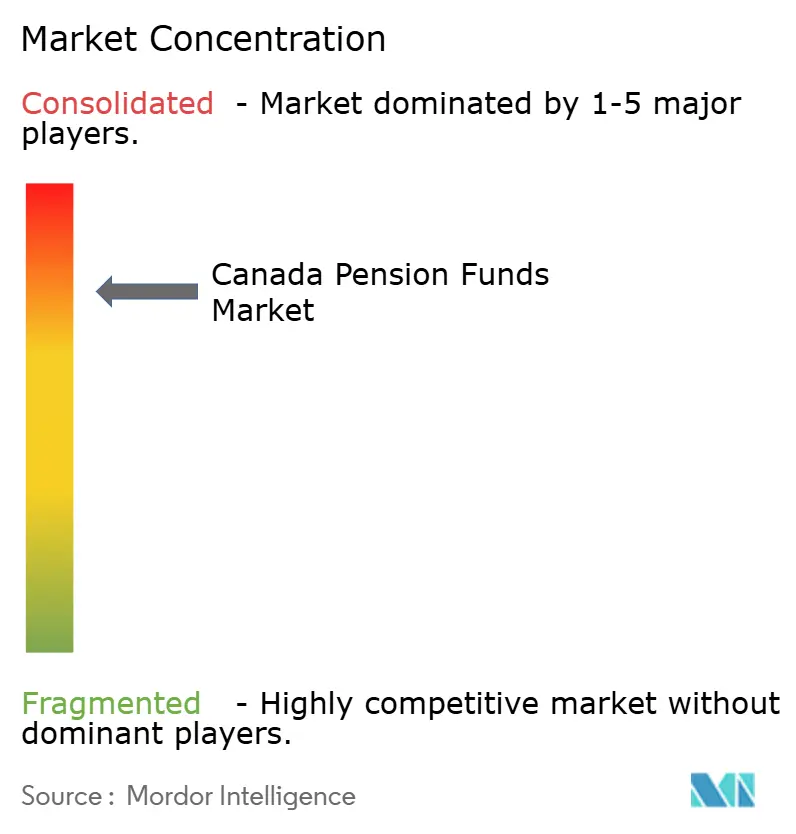
| Market Concentration | High |
Major Players *Disclaimer: Major Players sorted in no particular order Image © Mordor Intelligence. Reuse requires attribution under CC BY 4.0. | |
Canada Pension Funds Market Analysis by Mordor Intelligence
Canada pension funds market size in 2026 is estimated at USD 3.68 trillion, growing from 2025 value of USD 3.49 trillion with 2031 projections showing USD 4.81 trillion, growing at 5.51% CAGR over 2026-2031. Demand for capital-light retirement products, rapid technology adoption, and growing allocations to alternative assets underpin this expansion. Public-sector plans still dominate the Canada pension fund market, yet private-sector sponsors record faster growth as employers migrate to defined-contribution arrangements. Offshore diversification continues to reshape portfolio construction, while the eight largest public plans—the “Maple Eight”—reinforce their global reputation for in-house active management excellence. Persistent demographic pressure, property market write-downs, and liquidity shocks temper the outlook but also accelerate strategic pivots toward infrastructure, renewable energy, and cross-border pension-risk-transfer transactions.
Key Report Takeaways
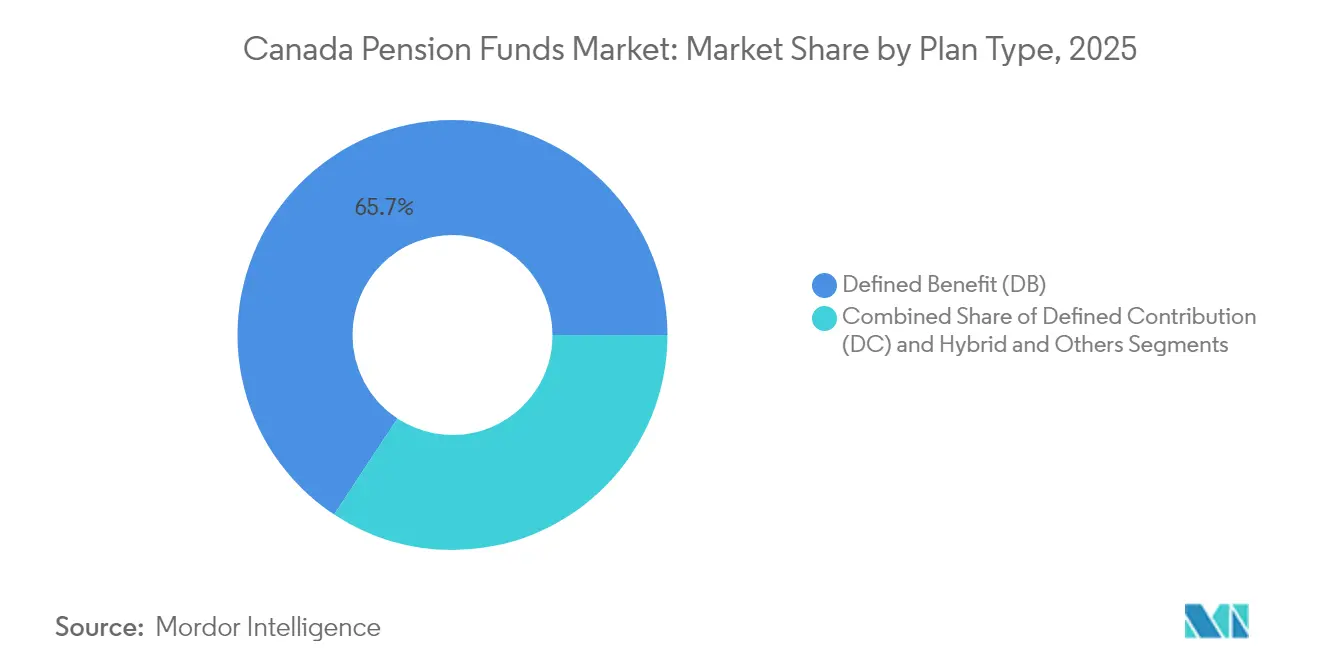
- By plan type, defined benefit schemes held 65.72% of the Canada pension funds market share in 2025, whereas defined contribution plans are expanding at a 6.85% CAGR through 2031.
- By investment strategy, active management retained 62.15% share of the Canada pension funds market size in 2025; passive mandates post the highest projected CAGR of 6.41% to 2031.
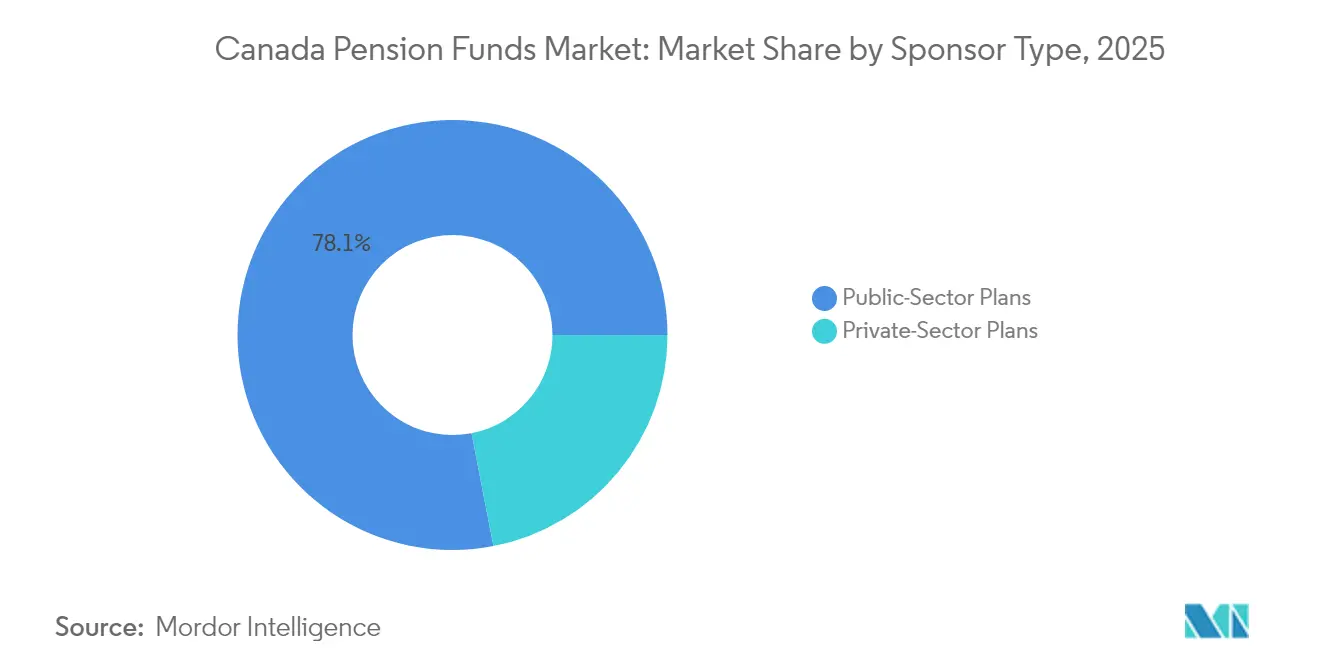
- By sponsor type, public-sector plans commanded 78.05% revenue share of the Canada pension funds market in 2025, while private-sector plans are expected to exhibit the quickest growth at 7.32% CAGR.
- By geography of investment, offshore assets represented 57.05% of Canada's pension funds market allocations in 2025 and are projected to grow at a 6.05% CAGR.
Note: Market size and forecast figures in this report are generated using Mordor Intelligence’s proprietary estimation framework, updated with the latest available data and insights as of 2026.
Canada Pension Funds Market Trends and Insights
Drivers Impact Analysis*
| Driver | (~) % Impact on CAGR Forecast | Geographic Relevance | Impact Timeline |
|---|---|---|---|
| Increasing shift to capital-light retirement products | +1.2% | Global, with early gains in Ontario, Quebec, British Columbia | Medium term (2-4 years) |
| Technology-driven member engagement platforms | +0.8% | National, concentrated in major urban centers | Short term (≤ 2 years) |
| Rapid expansion of alternative investments in portfolios | +1.5% | Global, with APAC and North America focus | Long term (≥ 4 years) |
| In-house asset-management cost advantage of “Maple Eight” | +0.9% | National, with spillover to international markets | Long term (≥ 4 years) |
| Climate-aligned infrastructure programs opened by federal government | +1.1% | National, concentrated in renewable-energy corridors | Medium term (2-4 years) |
| Cross-border buy-out deals of closed UK/US DB plans | +0.7% | International, focused on UK and US markets | Medium term (2-4 years) |
| Source: Mordor Intelligence | |||
Increasing Shift to Capital-Light Retirement Products
Employers continue to exit guaranteed benefit structures, pushing the pension-risk-transfer market toward CAD 10 billion in 2024. Defined contribution plans appeal to organizations looking to curb balance-sheet volatility and streamline compliance expenditures. Insurers meet demand with innovative bulk-annuity offerings that absorb longevity and investment risk, broadening access to mid-market sponsors. Sun Life reports a steady rise in buy-ins as companies view liability transfer as proactive balance-sheet management rather than a last resort. The result is faster asset growth for DC mandates within the Canada pension fund market and improved capital efficiency for corporate Canada.
Technology-Driven Member Engagement Platforms
Artificial-intelligence engines now curate personalized dashboards that guide contribution rates, asset allocation, and retirement income projections [1]CFA Institute, “AI in Public-Sector Pension Funds,” cfainstitute.org. CAAT Pension Plan’s cloud migration with DXC and ServiceNow shows how digital workflows can scale to 100,000+ participants while cutting administrative overhead. Predictive analytics refine actuarial assumptions, helping trustees calibrate contribution schedules. Yet regulators urge vigilance on data privacy and algorithmic bias. Successful adopters therefore balance innovation, cybersecurity, and fiduciary accountability—elements that sharpen competitive positioning in the Canada pension fund market.
Rapid Expansion of Alternative Investments in Portfolios
Infrastructure, private equity, and venture capital now absorb growing slices of aggregate assets as conventional public-market yields remain compressed. CDPQ’s Verene Energia acquisition of a 124-kilometer Brazilian transmission asset illustrates the search for long-duration, inflation-protected cash flows. PSP Investments and KKR’s purchase of American Electric Power’s transmission units highlights the scale advantage Canadian funds wield in competitive auctions [2]Charles Émond, “CDPQ 2024 Sustainable Investing Progress Update,” cdpq.com. Alternative allocations defend funded status against demographic strain and heighten the appeal of the Canada pension fund market to global project sponsors seeking sovereign-grade co-investors.
In-House Asset-Management Cost Advantage of “Maple Eight”
CPPIB generated CAD 16 billion in excess value over five years, even after incurring CAD 5.5 billion in annual operating costs on an asset base of CAD 714.4 billion. Internal teams negotiate lower deal fees, retain proprietary expertise, and accelerate decision cycles. International observers increasingly benchmark against this model, but its upkeep demands relentless talent recruitment and high-performance data architecture. For smaller plans, partnering with or merging into larger peers offers a path to similar economics, intensifying consolidation themes within the Canada pension fund market.
Restraints Impact Analysis*
| Restraint | (~) % Impact on CAGR Forecast | Geographic Relevance | Impact Timeline |
|---|---|---|---|
| Market volatility and liquidity shocks | -1.8% | Global, with concentrated exposure in emerging markets | Short term (≤ 2 years) |
| Adverse demographic dependency ratio | -2.1% | National, with acute pressure in Atlantic provinces | Long term (≥ 4 years) |
| Greater solvency-funding disclosure requirements | -0.6% | National, affecting federally regulated plans | Medium term (2-4 years) |
| Office-real-estate write-downs pressuring returns | -1.3% | Global, concentrated in major metropolitan areas | Medium term (2-4 years) |
| Source: Mordor Intelligence | |||
Market Volatility and Liquidity Shocks
Geopolitical friction drives CPPIB to pare emerging-market exposure from 22% to 20% and lift US holdings from 36% to 42% by March 2024. Such defensive tilts cushion short-term downside but concentrate assets in crowded trades, compressing future return potential. Liquidity protocols now incorporate stress testing for sudden collateral calls linked to private-credit drawdowns or secondary-market freezes. Boards monitor these dynamics closely, knowing that sustained shocks could derail performance targets for the Canada pension fund market.
Adverse Demographic Dependency Ratio
The support ratio slide toward 59% by 2027, threatening to inflate provincial healthcare liabilities to CAD 2 trillion and eat into fiscal room for pension top-ups. Higher contributions or trimmed benefits loom, especially in Atlantic regions facing steep out-migration. Ottawa eyes targeted immigration to replenish the workforce, but accelerated population growth strains housing and public services. These demographic forces weigh heavily on actuarial projections and long-range asset-liability models throughout the Canada pension fund market.
*Our forecasts treat driver/restraint impacts as directional, not additive. The impact forecasts reflect baseline growth, mix effects, and variable interactions.
Segment Analysis
By Plan Type: Defined Benefit Resilience amid DC Acceleration
Defined benefit assets accounted for 65.72% of the Canada pension funds market size in 2025, as decades of compounded contributions locked in a formidable capital base. High-profile sponsors such as CPPIB and CDPQ continue to leverage scale for negotiated deal access, cushioning the impact of funding volatility. Still, defined contribution pools clock a 6.85% CAGR to 2031 as employers embrace risk transfer strategies and younger workers prioritize portability. The Canada pension fund market now balances mature DB liabilities against a fresh influx of DC cash flows, shifting service-provider economics and sparking product innovation.
DC momentum is reinforced by capital-light accounting treatment and lower regulatory burden. Hybrid designs that splice DB guarantees with DC flexibility gain niche appeal among industries with cyclical earnings. Consultants increasingly recommend lifecycle and target-date solutions to streamline asset choices for participants. As DC balances rise, passive index funds absorb greater inflows, creating competitive tension between low-cost structures and the Maple Eight’s high-touch active approach.


By Investment Strategy: Active Management under Pressure
Active mandates controlled 62.15% of the Canada pension funds market in 2025, yet fee-aware sponsors are steering incremental cash to passive vehicles at a 6.41% CAGR through 2031. Smaller plans often lack the scale to justify bespoke private-market teams and therefore gravitate toward indexed building blocks. Conversely, the Maple Eight keep internal deal pipelines humming, defending their alpha narrative by highlighting five-year outperformance versus blended benchmarks.
Technology dissolves rigid style boundaries: smart-beta ETFs fold factor tilts into passive wrappers, while quantitative managers automate research that once required armies of analysts. These cross-currents reshape talent requirements and drive cooperative platforms where large funds share data lakes or AI engines to cut duplicative spend. Regulatory focus on value-for-money reporting amplifies scrutiny, nudging trustees to articulate clear performance thresholds for retaining active strategies within the Canada pension fund market.
By Sponsor Type: Public-Sector Strength versus Private-Sector Growth
Public plans, anchored by statutory contribution inflows and sovereign backing, represented 78.05% of total assets in 2025. Their expansive time horizons support multidecade infrastructure bets and patient capital alliances that private peers rarely match. Nonetheless, private-sector plans notch the swiftest expansion at 7.32% CAGR as SMEs adopt group RRSPs and capital-accumulation platforms to compete for talent.
Policy tweaks that simplify governance and permit broader investment menus lower entry barriers for mid-market employers. Insurance-company record-keepers seize the opportunity, bundling education, wellness, and robo-advice features that resonate with digitally savvy employees. Together, these trends broaden the stakeholder base for the Canada pension fund market and diversify cash-inflow sources beyond the public sphere.
By Geography of Investment: Offshore Dominance Drives Returns
Foreign holdings made up 57.05% of portfolios in 2025 and are projected to expand at a 6.05% CAGR to 2031. The Canada pension funds market benefits from APAC infrastructure pipelines, European logistics, and US data-center builds that offer scalable, inflation-linked cash flows. CPPIB now allocates roughly 90% of its assets outside Canada to mitigate domestic commodity-cycle volatility.
Onshore deployments still appeal where government co-investment de-risks early-stage climate ventures. Ottawa’s removal of the 30% rule and new transparency standards aim to entice greater domestic capital without constraining funds’ fiduciary latitude. Trustees, therefore, weigh political optics against risk-return calculus, refining portfolio-mix triggers that guide home-bias adjustments across the Canada pension fund market.
Geography Analysis
Offshore allocations held 57.05% share of aggregate assets in 2025 and remain the fastest-growing slice of the Canada pension fund market. Asia-Pacific absorbs a rising proportion, led by Australia, which captures over half of regional inflows. India overtakes China at 25% of APAC exposure as funds seek regulatory stability and demographic vibrancy . Heightened geopolitical tension prompts trimming of Chinese equities, while resilient rule-of-law jurisdictions attract incremental capital.
North America still anchors overall exposure. CPPIB lifted its US weighting from 36% to 42% by March 2024, favoring energy infrastructure, digital-utility platforms, and high-grade real estate. PSP’s CAD 300 million hospitality partnership with Eurazeo amplifies European diversification and taps post-pandemic travel recovery tailwinds. European green-field renewables and mature toll-road concessions also draw Canadian bids, underscoring the global reach of the Canada pension fund market.
Domestic investments remain substantial but face opportunity-cost scrutiny. Federal authorities encourage “buy Canada” alignment through matched-funding for clean-tech ventures and advanced manufacturing corridors. The Maple Eight responds selectively, prioritizing climate-aligned infrastructure, digital backbone assets, and affordable housing that match liability timelines. While political stakeholders press for deeper home-market engagement, portfolio managers emphasize that fiduciary duty mandates globally optimized, risk-adjusted returns.
Regulatory Landscape
Canada pension funds operate under a mix of federal and provincial rules, with the largest federally linked investment entities governed by statute and regulation. CPPIB is established under the Canada Pension Plan Investment Board Act and the Canada Pension Plan Investment Board Regulations (SOR/99-190, current to May 26, 2026), which set out governance, investment powers, and accountability for managing CPP assets.
Other major public pension investment organizations also have legislated mandates and formal policy requirements. PSP Investments operates under the Public Sector Pension Investment Board Act and related regulations (SOR/2000-77), with annual audit oversight, including the Auditor General of Canada and Deloitte LLP referenced in its reporting, and a Board-approved Statement of Investment Policies, Standards and Procedures. Together, these requirements reinforce fiduciary discipline, risk controls, and disclosure expectations across the Canada pension fund market.
Value Chain Analysis
The Canada pension fund market value chain begins with plan sponsors (public-sector employers and private employers) and members, then moves through contributions and actuarial governance before capital flows into investment management. Delivery is carried out either internally, notably among the Maple Eight, or via external managers, custodians, and specialized operating partners. Investment implementation increasingly blends strategic and dynamic asset allocation with direct investing and co-investments in private markets, which reduces reliance on traditional commingled fund structures while raising expectations for internal due diligence, portfolio analytics, and risk management.
Administration and oversight form the other core legs of the chain, covering record-keeping, member engagement platforms, and reporting to boards and regulators. PSP Investments, for example, acts as the independent and exclusive investment manager of Canada Growth Fund Inc. (CGF) since June 2023, while operating within Crown-related accountability frameworks and maintaining board-approved investment policy documentation. These arrangements shape how pension capital is sourced, governed, deployed, and monitored across the market.
Competitive Landscape
Canada’s pension ecosystem is concentrated, with the Maple Eight controlling a significant share of the assets. CPPIB leads at CAD 714.4 billion, followed by CDPQ at CAD 473 billion and OTPP at CAD 247.5 billion. Each pursues distinct mandates: CPPIB maximizes long-term returns for contributors and beneficiaries nationwide; CDPQ balances returns with Quebec economic development; OTPP tailors to Ontario educators. Their heft assures seat-at-table status in multi-billion-dollar global deals, giving the Canada pension fund market a disproportionate presence in cross-border transactions.
Active direct-investment models, bolstered by data science and AI tools, remain central to competitive strategy. CPPIB’s North American energy purchase of California Resources Corporation stock through the Aera Energy merger demonstrates ambition to scale traditional energy alongside transition-ready assets. PSP’s entry into Highway 407 ETR signals rising domestic-infrastructure appetite as valuations stabilize. CDPQ’s private takeover of fintech Nuvei, where it retains a 12% stake post-LBO, advances the fund’s digital-economy thesis.
Smaller provincial plans weigh collaboration or consolidation to unlock comparable scale efficiencies. Shared-service models and pooled-asset vehicles help reduce fee drag and broaden alternative-asset access. Regulatory transparency mandates raise the bar on cost disclosure, nudging underperforming outfits to benchmark against Maple Eight results. Technology investment, talent recruitment, and climate-risk integration form the next arena of competitive differentiation across the Canada pension fund market.
Canada Pension Funds Industry Leaders
Canada Pension Plan Investment Board (CPPIB)
Caisse de dépôt et placement du Québec (CDPQ)
Ontario Teachers’ Pension Plan (OTPP)
Public Sector Pension Investment Board (PSP Investments)
Healthcare of Ontario Pension Plan (HOOPP)
- *Disclaimer: Major Players sorted in no particular order

Market Opportunities and Future Outlook
There is room for providers and plan sponsors to expand defined-contribution (DC) and capital-accumulation solutions, particularly where low-cost default investment designs are paired with modern administration and engagement tools. The asset base continues to deepen: Statistics Canada reported Canadian trusteed pension fund assets at CAD 2.6 trillion in Q4 2025, up CAD 151.9 billion year over year. This level of growth supports more outsourced CIO offerings, target-date and lifecycle implementations, and integrated member digital experiences that reduce administrative friction for mid-market employers.
Another opportunity is broader institutional access to private markets and cross-border real assets through structured partnerships, co-investments, and platform deals, alongside tighter liquidity and risk governance for those exposures. Foreign assets were CAD 1,313.5 billion in Q4 2025 versus CAD 951.1 billion domestically, which points to ongoing demand for global origination, manager selection, and operational capabilities. Recent large-ticket infrastructure and real estate transactions by major Canadian funds reinforce how the Canada pension fund market functions as a partner of choice for global operators and sponsors seeking long-duration capital.
Recent Industry Developments
- July 2026: Canada Pension Plan Investment Board announced a US$1.75 billion investment to support EQT and EdgeConneX in AI-focused digital infrastructure. The investment targets AI-centric data center development, expanding capacity and scale. The action deepens CPPIB's exposure to global AI infrastructure, enhancing cross-border portfolio diversification.
- July 2026: Canada Pension Plan Investment Board entered a definitive agreement with Brookfield Asset Management to acquire US$5.2 billion LXP Industrial Trust. The deal acquires U.S. industrial real estate assets. The cross-border acquisition strengthens CPPIB's real assets with a large-scale industrial portfolio.
- June 2026: Canada Pension Plan Investment Board committed up to INR 70 billion to a strategic partnership with CtrlS Datacenters for data center capacity in India. The partnership expands data center capacity in a key growth market. It strengthens CPPIB's international infrastructure footprint and active infra exposure.


Research Methodology Framework and Report Scope
Market Definition and Coverage
This market is sized as the total value of pension fund assets that are managed for retirement obligations in Canada, measured in USD. It reflects the investable pool held by pension plans and related pension fund entities, based on reported assets and standard valuation practices.
Scope exclusions: We exclude assets that sit fully outside pension fund balance sheets, such as pure retail savings products that are not structured as pension plan assets, and any double counting across pooled holdings.
Segmentation Overview
- By Plan Type
- Defined Contribution (DC)
- Defined Benefit (DB)
- Hybrid and Others
- By Investment Strategy
- Active
- Passive
- By Sponsor Type
- Public-Sector Plans
- Private-Sector Plans
- By Geography of Investment
- Onshore
- Offshore
Data Sources, Market Sizing, and Validation
Desk Research
Desk research is used to build the base fact set, especially pension assets, the mix of plan types, and broad allocation shifts between public and private sponsors. We rely on official publications and standard statistics to avoid anchoring the estimate to one-off press figures.
Typical inputs include public sources such as Statistics Canada tables and releases, OSFI pension plan oversight publications, Government of Canada pension policy notes, OECD pension statistics, and central bank macro series used for currency and inflation context. We also scan plan annual reports, investor presentations, and major financial press to understand reported AUM movements and any structural changes, such as consolidation of plans. When needed, paid subscriptions covering company financials and intelligence, news and financials, and patent databases are used as timing and cross-check aids to capture material events. This list of desk research sources is not exhaustive, and other public documents were reviewed during data collection, validation, and clarification.
Primary Interviews and Surveys
Primary work is used to test how the reported asset pool is used in practice and to validate what should be counted as pension fund assets versus adjacent retirement savings. We spoke with plan executives, investment teams, administrators, advisors, and related service providers across Canada so assumptions on plan coverage, reporting timing, and asset valuation could be aligned before finalizing the model.
Distribution of primary research fieldwork respondents
| Company type | Respondent position |
|---|---|
| Top tier: 32% | CXOs: 20% |
| Mid tier: 46% | Functional/Unit leaders: 37% |
| Smaller Players: 22% | Managers: 43% |
Market-Sizing & Forecasting
Sizing starts from a top-down reconstruction of the Canada pension asset pool using official asset statistics, plan reporting, and macro signals that explain year-to-year movement. Once the pool is built, we corroborate it with selective bottom-up approximations, such as roll-ups of sampled plan AUM disclosures and channel checks on how much retirement savings is actually held inside pension plan structures. We then adjust only when gaps can be explained using observable plan reporting differences.
Key inputs that move the model include pension asset valuations reported by official statistics, contribution and benefit payout patterns, funded status and plan closures or conversions, and the observed mix shift between defined benefit and defined contribution arrangements. Investment allocation trends, including higher alternatives, offshore exposure, and passive adoption, are also tracked because they can change growth rates even when membership grows slowly. For forecasting, scenario analysis is used around return assumptions and contribution growth, and these are aligned to expert views gathered in primary discussions. When a bottom-up data point is missing for smaller plans, the gap is handled through calibrated ratios derived from known coverage slices, for example scaling from the portion of trusteed funds reported to an all-plan view, and then stress testing the factor against independent checks.
Data Validation & Update Cycle
Model outputs are checked against independent signals such as official pension asset releases, GDP and market return context, and directional changes seen in plan disclosures. If a year shows an unusual jump or drop, we re-check currency timing, valuation points, and whether a definition change or plan transfer is driving the variance, then review the assumptions again.
Before sign-off, the work goes through multi-step analyst reviews focused on unit consistency, year alignment, and scope consistency across sections. Reports are refreshed annually, and interim updates are made when material events change the asset base or the reporting definition. Right before delivery, a final pass is completed so clients receive the latest updated view.
Mordor Intelligence's Canada Pension Fund Market Size Measured Against Other Published Estimates
Published pension asset estimates can differ even when everyone is trying to measure the same thing, because underlying definitions and coverage are not always aligned. Differences usually come from what is treated as a pension fund asset, how much of the smaller-plan universe is captured, the currency and timing used for conversion, and whether reported data is point-in-time or averaged.
Some published figures focus on trusteed employer plans only, which can pull the total down, and others broaden the pool by folding in individual retirement accounts, which can push totals up. In Mordor Intelligence sizing, pension fund value is counted as plan-level assets in Canada and it is kept separate from adjacent personal savings pools unless they are reported as pension plan assets. The totals are reconciled to the stated base year and USD conversion timing.
Benchmark comparison
| Source | Market Size | Gaps in Research Methodology |
|---|---|---|
| Mordor Intelligence | USD 3.68 T (2026) | |
| Industry Institute A | USD 3.27 T (2024) | Uses a global pension asset study lens that now includes individual assets, and the Canada value is an estimated year-end figure, which changes comparability versus plan-asset-only totals. |
| Government Statistical Office B | USD 2.47 T (2024) | Covers the market value of assets held by Canadian trusteed pension funds for the largest plans, excludes assets held fully under annuity insurance contracts, and is reported in local currency units and a specific quarter timing. |
The spread in the table is mainly explained by what is included in the pension pool and how fully the long tail of plans is captured. By keeping the scope tied to plan assets and then cross-checking it against independent official releases and disclosure-based roll-ups, the final number stays traceable to clear inputs and repeatable steps for updates.


Key Questions Answered in the Report
What is the current size of the Canada pension fund market?
The Canada pension fund market stands at USD 3.68 trillion in 2026 and is projected to reach USD 4.81 trillion by 2031.
Which plan type is growing fastest?
Defined contribution schemes are expanding at a 6.85% CAGR as employers seek capital-light retirement solutions.
How much of Canadian pension capital is invested abroad?
Offshore assets account for 57.05% of total allocations, with APAC and North America absorbing the bulk of new flows.
Why are Canadian funds increasing alternative investments?
Infrastructure, private equity, and renewables offer long-duration, inflation-linked returns that better match pension liabilities.
What role does technology play in member engagement?
AI-powered platforms personalize retirement planning, cut administrative costs, and enhance actuarial precision across the pension value chain.
How concentrated is the market among top players?
The five largest public plans hold a significant share of assets, giving the market a concentration score of 8.
Page last updated on:


 Your data is secure and never sold or shared.


