
Market Overview
| Study Period | 2020 - 2031 |
|---|---|
| Forecast Data Period | 2026 - 2031 |
| Base Year Market Size (2025) | USD 1.43 Billion |
| Market Size (2026) | USD 1.66 Billion |
| Market Size (2031) | USD 3.47 Billion |
| Growth Rate (2026 - 2031) | 15.92 % |
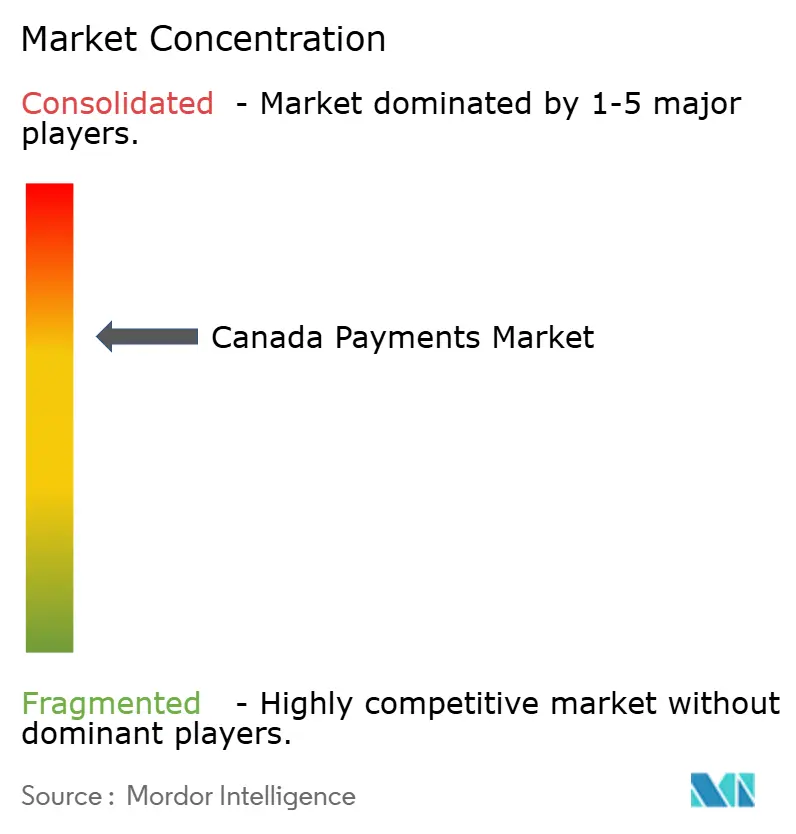
| Market Concentration | Medium |
Major Players *Disclaimer: Major Players sorted in no particular order Image © Mordor Intelligence. Reuse requires attribution under CC BY 4.0. | |
Canada Payments Market Analysis by Mordor Intelligence
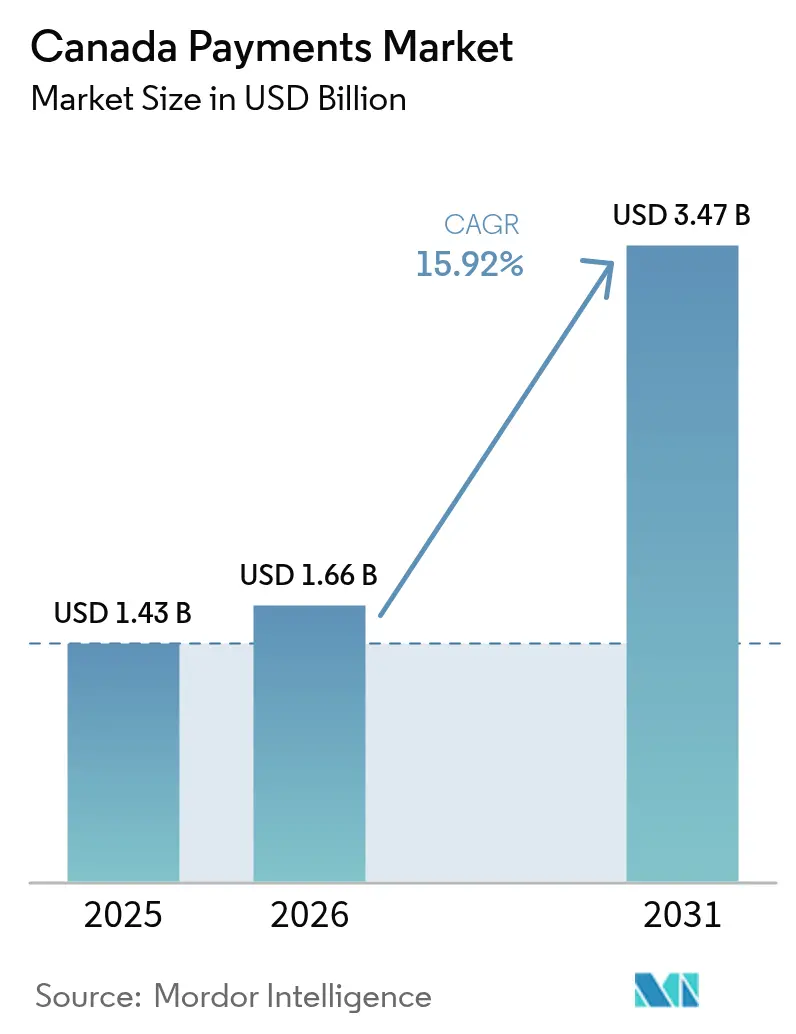
The Canada payments market size is expected to grow from USD 1.43 billion in 2025 to USD 1.66 billion in 2026 and is forecast to reach USD 3.47 billion by 2031 at 15.92% CAGR over 2026-2031. Rapid regulatory modernization under the Retail Payment Activities Act (RPAA), accelerating contactless adoption, and the surge of e-commerce all reinforce a nationwide shift toward digital rails. The mandatory November 2024 registration of every payment service provider with the Bank of Canada boosts systemic trust and sets consistent risk-management baselines, which in turn fuels merchant and consumer confidence. Meanwhile, the federal agreement that trims interchange on small-ticket credit transactions to 0.95% improves merchant economics and redirects spending toward innovation. Growing dual-network contactless card issuance, together with Apple’s Tap-to-Pay rollout, signals a decisive pivot away from mag-stripe and chip-and-PIN architectures and redefines the competitive canvas for issuers, networks, and fintechs. Untapped upside remains in cross-border U.S.–Canada corridors, where harmonized rule sets and real-time settlement rails promise to unlock meaningful fee savings and faster liquidity cycles for exporters.
Key Report Takeaways
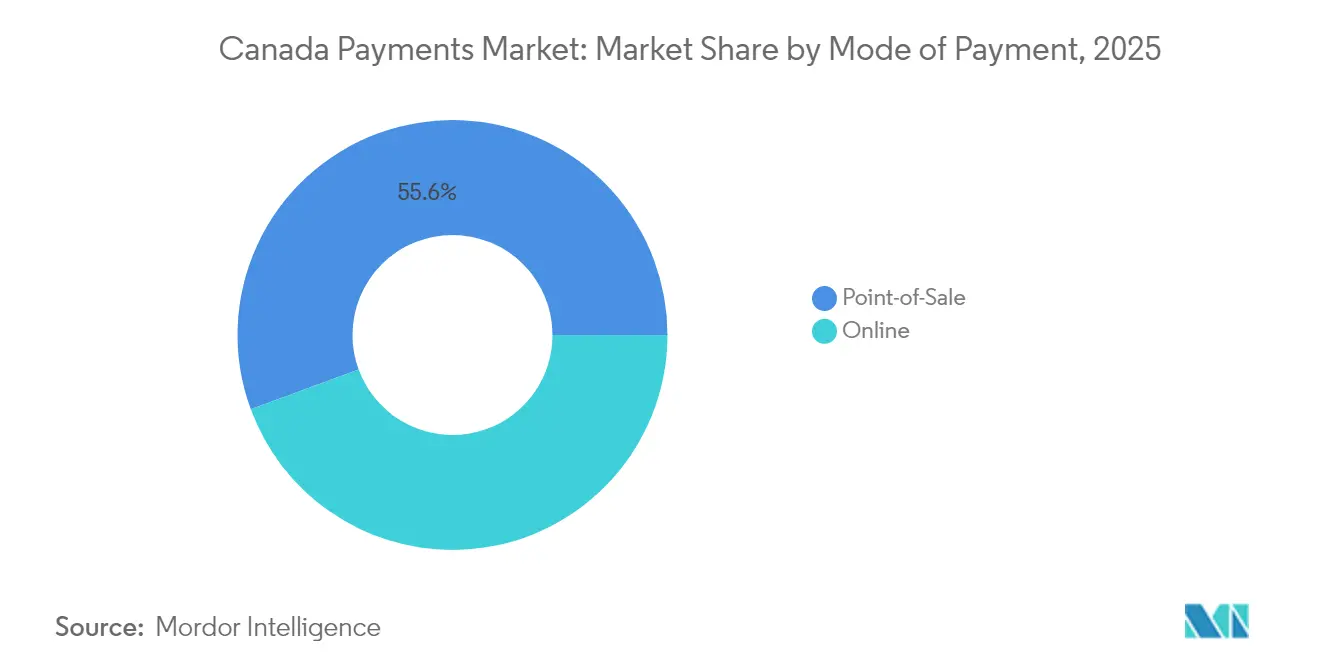
- By mode of payment, card transactions led with 44.60% revenue share in 2025, while digital wallets are projected to advance at an 17.82% CAGR to 2031. Overall Point-of-Sale led with 55.62% revenue share.
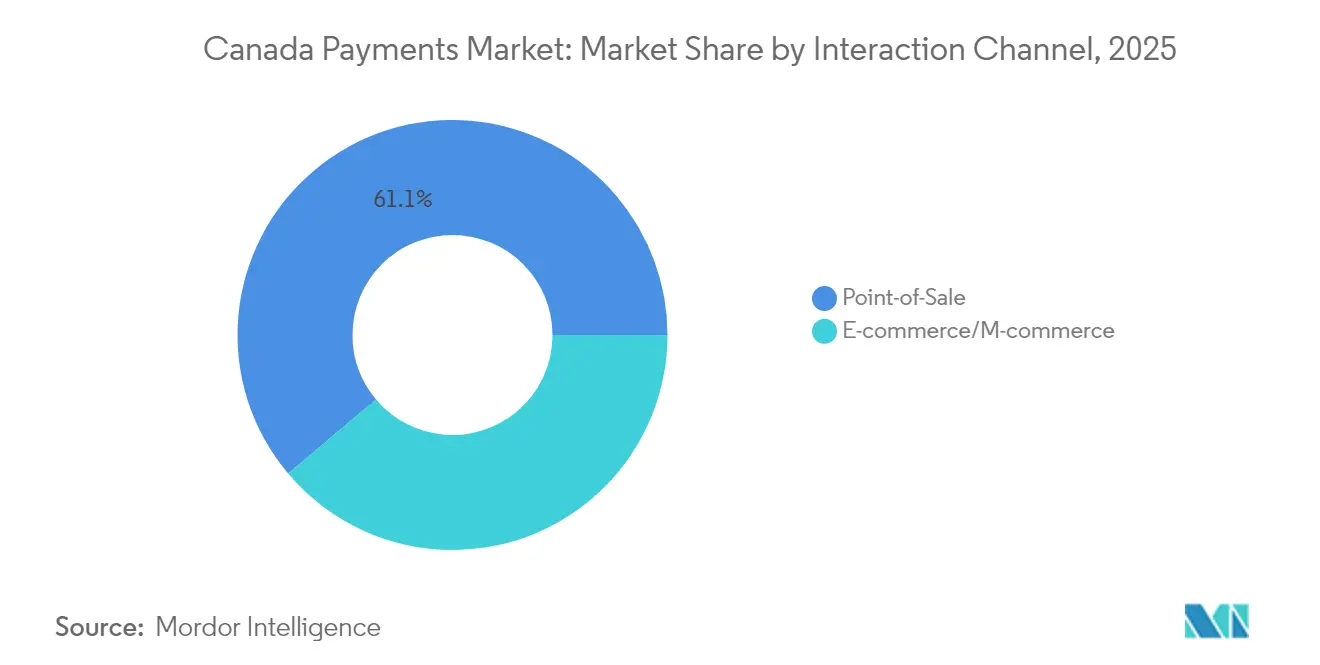
- By interaction channel, point-of-sale captured 61.15% of the Canada payments market share in 2025, whereas e-commerce and mobile channels are set to expand at an 17.84% CAGR through 2031.
- By transaction type, business-to-business flows accounted for 31.65% of the Canada payments market size in 2025; person-to-person transfers will accelerate at a 16.74% CAGR over the same horizon.
- By end-user industry, retail held 54.62% revenue share in 2025, with healthcare anticipated to grow at a 19.36% CAGR to 2031.
Note: Market size and forecast figures in this report are generated using Mordor Intelligence’s proprietary estimation framework, updated with the latest available data and insights as of 2026.
Canada Payments Market Trends and Insights
Drivers Impact Analysis*
| Driver | (~) % Impact on CAGR Forecast | Geographic Relevance | Impact Timeline |
|---|---|---|---|
| Rapid migration from Interac debit to dual-network contactless cards | +3.2% | National, with higher adoption in urban centers | Medium term (2-4 years) |
| BNPL regulation-light regime fuelling non-bank originations | +2.8% | National, excluding Quebec due to consumer protection laws | Short term (≤ 2 years) |
| Merchant surcharging rule-change boosting alternative rails adoption | +2.1% | National excluding Quebec, concentrated in retail sectors | Short term (≤ 2 years) |
| Provincial-level digital-ID roll-outs simplifying KYC | +1.9% | British Columbia, Ontario leading, gradual provincial expansion | Long term (≥ 4 years) |
| Expansion of U.S.–Canada cross-border e-commerce corridors | +1.7% | Border provinces, major urban centers with cross-border trade | Medium term (2-4 years) |
| Source: Mordor Intelligence | |||
Rapid Migration from Interac Debit to Dual-Network Contactless Cards
Canadian issuers are pivoting toward dual-network debit credentials that combine Interac with Visa or Mastercard rails, giving consumers the flexibility to toggle between domestic low-cost clearing and globally accepted networks at checkout.[1] Early adopters such as major banks report noticeable payment-routing savings as software decides the lowest-cost path in real time. Merchant enablement remains the key gating factor; however, the anticipated 2026 Real-Time Rail (RTR) launch should reduce settlement risk and improve liquidity for retailers that accept dual-network tokens. Real-estate services provider FCT already embeds Interac Verified IDs in property closings, underscoring how contactless credentials now extend well beyond general retail.[2]
BNPL Regulation-Light Regime Boosting Non-Bank Originations
Unlike Australia or the European Union, Canada has opted for a principles-based BNPL framework under existing consumer-credit statutes rather than imposing new licensing obligations. Fintechs thus iterate products rapidly, capturing younger cohorts who prefer zero-interest instalments at checkout. Large banks counter by embedding split-payments into existing credit cards, defending cross-sell economics. The segment is forecast to jump from USD 6.69 billion in 2024 to USD 11.32 billion by 2030, equating to a double-digit compound clip that outpaces revolving credit growth. Policymakers signal ongoing monitoring to guard against consumer over-extension, but a heavy compliance overlay remains unlikely in the near term.
Merchant Surcharging Rule Change Accelerating Alternative Rails**
Effective October 2022, retailers may pass up to 2.4% of interchange directly to shoppers, a policy shift already embraced or under active consideration by roughly one-fifth of small businesses. Price-sensitive consumers increasingly sidestep surcharge lines by paying with debit, Interac e-Transfer, or account-to-account wallets, accelerating the 19.3% CAGR logged by alternative rails. Quebec’s legal carve-out complicates national rollout plans, yet anecdotal data show competitive pressure forcing multi-province chains to dual-price across most storefronts. Networks respond by promoting lower-fee small-ticket programs to sustain credit usage.
Provincial Digital-ID Rollouts Simplifying KYC
British Columbia’s Services Card and Ontario’s Verified.Me pilots are paving the way for a federated digital-ID backbone that slashes onboarding times across banking, insurance, and retail platforms.[3] Interac’s credentialing service is now live in pilot real-estate closings, eliminating paper-based identity checks. Once scaled, the framework promises cost reductions for banks that spend millions on manual KYC reviews, while simultaneously elevating fraud-detection effectiveness. Long-term network effects should cascade into faster loan decisioning and real-time account opening, reinforcing digital payments penetration.
Restraints Impact Analysis*
| Restraint | (~) % Impact on CAGR Forecast | Geographic Relevance | Impact Timeline |
|---|---|---|---|
| Interchange caps constraining issuer revenue pools | -2.4% | National, with concentrated impact on small business segments | Medium term (2-4 years) |
| Persistently high cash preference in rural Prairies & Atlantic Canada | -1.8% | Rural Prairies, Atlantic Canada, remote communities | Long term (≥ 4 years) |
| Data-localisation clause in Québec Bill-64 raising compliance costs | -1.3% | Quebec-specific, with spillover effects on national providers | Short term (≤ 2 years) |
| Source: Mordor Intelligence | |||
Interchange Caps Constraining Issuer Revenue Pools
From October 2024, consumer credit interchange on qualifying small-business transactions cannot exceed 0.95%, a 27% drop that removes roughly USD 1 billion of income from issuers over five years. Card programmes recalibrate by trimming rewards accrual rates or charging subscription-like bundle fees. Over time, issuers are expected to channel investment into proprietary BNPL, value-added data APIs, and embedded finance plays to rebuild yield.
Persistently High Cash Preference in Rural Prairies & Atlantic Canada
Bank of Canada’s 2023 merchant survey confirms that 96% of SMEs still accept notes and coins, with 92% not planning to go cash-free. Patchy high-speed internet and an aging demographic underpin slower digital uptake. Ottawa’s Universal Broadband Fund continues to subsidize fiber deployment, yet logistical challenges in sparsely populated areas mean full coverage could be several years away. Providers therefore maintain hybrid acceptance stacks, supporting both cash and QR-based mobile payments.
*Our forecasts treat driver/restraint impacts as directional, not additive. The impact forecasts reflect baseline growth, mix effects, and variable interactions.
Segment Analysis
By Mode of Payment – Point of Sale: Cards Lead Digital Transformation
Cards retained a 44.60% grip on in-store spend in 2025, giving them the single largest slice of the Canada payments market size at the physical checkout. Overall Point-of-Sale led with 55.62% revenue share. Dual-network contactless credentials now push tap-rate penetration above 81%, nudging consumers away from chip insert. Digital wallets, while still niche in bricks-and-mortar, are clocking an 17.82% CAGR, buoyed by Apple’s Tap-to-Pay entry that eliminates countertop hardware for micro-merchants. Cash still appears in 1 of every 5 rural purchases, confirming that omnichannel hardware strategies remain essential until high-speed coverage becomes universal. Forward-looking retailers invest in software defined terminals able to route transactions dynamically, seeking interchange optimization and loyalty integration.
Regulators stress risk controls under RPAA, mandating that every wallet operator document treasury, cyber, and operational safeguards. Fintechs leverage that clarity to court mid-market exporters, rearranging their payout flows into real-time bank pushes that bypass traditional acquirers. Fraud-rate headwinds on card-not-present (CNP) transactions accelerate migration toward tokenized wallet solutions, particularly in high-average-ticket segments like travel and luxury goods. Embedded BNPL inside wallets widens revenue pools without re-directing customers to third-party pages, strengthening platform stickiness.

By Transaction Type – B2B Dominance Meets P2P Innovation
Commercial payments represented 31.65% of aggregate transaction value in 2025, underscoring the primacy of B2B flows in the Canada payments market. Corporates demand richer remittance data and integrated reconciliation; consequently, API-based EFT aggregators and ERP plug-ins gain acceptance. On the consumer side, person-to-person transfers grow at 16.74% CAGR, fueled by the ubiquity of Interac e-Transfer, which settles within minutes and now layers request-to-pay functionality. Real-time disbursement use cases—insurance payouts and gig-wage releases—bridge the gap between B2B functionality and P2P UX expectations.
Risk oversight remains paramount: the Bank of Canada designated Lynx as a systemically important backbone, requiring enhanced contingency procedures. For small corporates, fintech portals that marry invoicing, FX hedging, and payment initiation sharply cut manual processes. Parallel momentum in remittances intensifies as corridors to South Asia and Latin America adopt retail wallets, thereby sidestepping high-fee wire services. Such developments broaden ecosystem stickiness and strengthen data-monetization prospects for networks.
By Interaction Channel – POS Stability Contrasts Online Acceleration
In-person commerce still drives 61.15% of national tender volume, confirming the resilience of traditional checkout experiences even as smartphone penetration exceeds 91%. The Canada payments market share for e-commerce channels is climbing, supported by an 17.84% CAGR through 2031. Holiday 2024 data indicated a 22% year-over-year spike in Black Friday payment counts, validating the need for elastic omnichannel capacity. Tourism spending reached CAD 23.3 billion (USD 17.2 billion) in Q4 2023, with a heavy skew toward mobile wallet usage by foreign visitors.
Mobile QR acceptance grows fastest in food-service and personal-care, where queue-busting and gratuity prompts lift average tickets. For car dealerships and other high-ticket merchants, hybrid checkout flows let customers scan a showroom QR, finance via BNPL, and e-sign on their phones, compressing sales cycles. Payment-facilitator models proliferate, giving micro-sellers sub-24-hour onboarding and consolidated chargeback management. In sum, channel convergence mandates orchestration layers capable of routing across POS, web, and in-app sessions under a single credential.
By End-User Industry – Retail Leadership Meets Healthcare Innovation
Retail dominated with 54.62% of 2025 inflows, reinforcing its role as first mover on contactless and loyalty-linked payments. High-frequency foot traffic and thin margins make cost-to-tender optimization a board-level KPI. Healthcare, projected to surge at 19.36% CAGR, accelerates digital invoice and co-pay adoption as clinics embrace upfront price transparency. Hospital procurement units layer dynamic discounting on EFT rails to capture early-pay rebates, reducing working-capital drag. OECD analyses of medical supply chain disruptions underscore the need for resilient settlement mechanisms that can reroute funds when suppliers shift geography.
Media and entertainment funnel recurring micro-charges through subscription wallets, yielding predictable ARPU. Hospitality operators retrofit PMS interfaces to handle multi-currency tips and instant refunds, essential features now that travel contributes 1.58% of GDP and sustains 682,500 jobs nationwide. Public-sector billers integrate digital ID to let citizens pay taxes or renew licenses without re-entering card data, decreasing friction and administrative overhead.
Geography Analysis
Ontario and British Columbia anchor the Canada payments market due to dense populations, vibrant technology ecosystems, and progressive regulatory pilots. These provinces enjoy near-universal broadband availability, enabling pervasive wallet and BNPL adoption across urban retail and service sectors. Quebec, however, imposes Bill 64 data-localization duties that create dual compliance tracks for national PSPs, raising entry barriers and elevating operating expenses. The legislation is prompting vendors to build province-specific data pods or contract licensed local processors, constraining smaller entrants.
The Prairie provinces combine high B2B agricultural trade flows with lower digital consumer uptake, producing a bifurcated opportunity landscape. Energy and commodities firms push high-value wires through Lynx, whereas rural general stores still favor cash, citing patchy LTE coverage. Atlantic Canada mirrors this profile but skews more toward tourism, amplifying the benefit of interchange relief for merchants posting annual Visa volumes under CAD 300,000 (USD 221,000). Seasonal swings in visitor inflows necessitate flexible acquiring fees and multi-currency settlement to support cruise-port terminals and hospitality operators. Cross-border corridors along Ontario-Michigan and British Columbia-Washington trade lanes exhibit above-average transaction velocity. Exporters exploit payment platforms that bundle logistics tracking and auto-FX, capturing cost saves up to 120 basis points versus legacy bank wires. The upcoming RTR is expected to integrate with U.S. instant rails, streamlining reconciliations and obviating daylight overdrafts. Market players that secure early participation rights are poised to capture disproportionate flows once the rail becomes production-ready in 2026.
Regulatory Landscape
Canada is moving toward a more formal, resilience-led payments regime anchored by the Retail Payment Activities Act (RPAA) and the Retail Payment Activities Regulations (SOR/2023-229), with the Bank of Canada supervising payment service providers (PSPs) for operational risk management and safeguarding of end-user funds. Under the RPAA timeline, PSPs are required to have risk management and safeguarding frameworks in place as of September 8, 2025. The regime also introduces mandatory annual reporting, with the first annual report due by March 31, 2026.
Alongside that, Payments Canada continues to align system rules with legislative modernization, including updates to Automated Clearing Settlement System (ACSS) rules effective February 9, 2026. In December 2025, the Bank of Canada published supervisory policy guidance for online marketplaces, clarifying that platform and marketplace payment models must assess whether their structure brings them into PSP scope. Under the RPAA, the Minister of Finance retains authority to address national security-related risks, including refusal or revocation of registration.
Value Chain Analysis
Canada's payments value chain runs from end users (consumers, merchants, corporates, and governments) through front-end acceptance and orchestration (POS software, e-commerce checkout, payment facilitators, wallets, and gateways), then into processing and settlement across domestic and global rails. Interac supports core domestic debit and account-to-account use cases, while global networks and acquirers provide card authorization, clearing, and value-added layers such as tokenization and fraud tooling. Canadian banks and processors also support merchant acquiring, treasury services, and dispute handling.
Payments Canada operates foundational clearing and settlement systems, and modernization is reshaping participation and where innovation can be commercialized. Amendments to the Canadian Payments Act (June 20, 2024) expanded Payments Canada membership eligibility to include supervised PSPs, credit union locals, and operators of designated clearing and settlement systems, widening access to national rails. The Real-Time Rail (RTR) build was completed in Q3 2025, while the Lynx high-value system has operated with high availability and transitioned to ISO 20022, providing a data-rich interoperability baseline. RPAA supervision adds a compliance layer across PSPs, with documented risk and funds-safeguarding controls positioned as prerequisites to operate at scale.
Competitive Landscape
Market concentration is moderate. Interac, Visa, Mastercard, and Shopify collectively processed just over 70% of 2024 digital transaction volume, yet a long-tail of fintechs injects competitive vigor across niche verticals. The interchange cap compels networks and issuers to pivot toward value-added services—risk scoring, loyalty engines, and small-business analytics—leveraging their data reservoirs to retain relevance. Visa’s 2025 roadmap outlines expansion into account-to-account flows and near-real-time treasury solutions, reflecting a strategic hedge against card cannibalization.
Shopify’s merchant-of-record model blurs the line between e-commerce platform and payment processor, letting it internalize economics that acquirers traditionally captured. Its USD 8.9 billion revenue in 2024 evidences the scale at play and incentivizes peers such as Lightspeed to deepen payment attach rates. Interac focuses on security; its tokenization and verified-ID rails anchor not only peer-to-peer but upcoming request-to-pay and payroll disbursements, positioning the network as indispensable middleware for real-time retail.
Fintech upstarts—Neo Financial, KOHO, and Wealthsimple—target specific pain points: fee-free prepaid cards, high-interest cash accounts, and commission-free brokerage respectively. Their low overhead allows aggressive pricing that appeals to Gen Z and immigrant segments. Meanwhile, global processors like Stripe and Adyen bolster Canadian engineering hubs to connect local merchants to international buyers. The looming RTR will reset competitive boundaries; players fastest to certify and commercialize connections stand to acquire share in time-critical B2B payouts.
Canada Payments Industry Leaders
-
Matercard Inc.
-
Visa Inc.
-
Interac Corp.
-
PayPal Holdings Inc.
-
Apple Inc. (Apple Pay)
- *Disclaimer: Major Players sorted in no particular order
Market Opportunities and Future Outlook
The clearest commercialization whitespace is in real-time, data-rich payments, enabled by the new participation pathways created by Payments Canada modernization. In June 2026, the RTR By-law was published in the Canada Gazette, Part II, establishing the legal framework for a national real-time payment system. The onboarding approach is sequenced, beginning with direct-to-exchange participants before later migration phases. That structure creates room for PSPs and banks to differentiate through overlays such as request-to-pay, automated reconciliation for SMEs, and instant disbursements that combine modern messaging with tighter liquidity management.
Regulatory and data-sharing developments are also broadening the addressable product set for digital commerce providers. As of 2026, the Bank of Canada supervises PSPs under the RPAA, raising baseline requirements for operational resilience and safeguarding. In March 2026, the Consumer-Driven Banking Act received royal assent to establish a framework for secure financial data sharing overseen by the Bank of Canada. With expanded Payments Canada membership eligibility under the amended Canadian Payments Act, these changes support account-to-account and embedded finance propositions that connect onboarding, consented data access, and payment initiation within a clearer federal oversight perimeter.
Recent Industry Developments
- May 2026: Visa Canada and Wealthsimple announced a pilot for stablecoin settlement in Canada using USD Coin (USDC). The initiative tests an alternative settlement workflow for select flows, adding a new option for faster treasury movement and cross-border related use cases within a regulated market context.
- May 2025: Payments Canada opened a consultation on widening system access, targeting a pathway for fintechs registered under the RPAA to settle directly in central-bank funds. The consultation supported competitive entry by non-traditional providers and tightened the link between supervision status and infrastructure participation.
- November 2024: The Financial Consumer Agency of Canada enforced a revised Code of Conduct that expanded disclosure duties across network operators. The update increased transparency requirements within the acceptance chain, influencing how fees, surcharging, and customer communications are managed by issuers, acquirers, and networks.
Research Methodology Framework and Report Scope
Market Definition and Coverage
For this study, the Canada payments market covers the value generated from enabling and processing payments for consumer purchases made at point of sale and through online checkout in Canada, across common payment modes like cards, digital wallets, and cash where applicable.
Scope exclusions: We exclude online purchases of motor vehicles and real estate, recurring bill payments (utilities), mortgage and loan repayments, credit card bill payments, and purchases of shares and bonds.
Segmentation Overview
- By Mode of Payment
- Point-of-Sale
- Card (Debit, Credit, Pre-paid)
- Digital Wallets (Apple Pay, Google Pay, Interac Flash)
- Cash
- Other POS (Gift-cards, QR, Wearables)
- Online
- Card (Card-Not-Present)
- Digital Wallet and Account-to-Account (Interac e-Transfer, PayPal)
- Other Online (COD, BNPL, Bank Transfer)
- Point-of-Sale
- By Interaction Channel
- Point-of-Sale
- E-commerce/M-commerce
- By Transaction Type
- Person-to-Person (P2P)
- Consumer-to-Business (C2B)
- Business-to-Business (B2B)
- Remittances and Cross-border
- By End-user Industry
- Retail
- Entertainment and Digital Content
- Healthcare
- Hospitality and Travel
- Government and Utilities
- Other End-user Industries
Data Sources, Market Sizing, and Validation
Desk Research
Desk research started with public payment system facts so the model is grounded in Canada specific usage patterns rather than generic digital commerce assumptions. We leaned on sources such as Payments Canada research on payment volumes and values, Bank of Canada releases on payment and financial system topics, Statistics Canada series tied to retail trade and e-commerce, and consumer and payment fraud publications from the Government of Canada.
We then used broader validation material, including company filings and investor decks from payment related firms operating in Canada, reputable press coverage on new payment rails and regulation, and association websites that summarize merchant acceptance and checkout behavior. Where needed, we used paid subscriptions to sanity check company financials, track major news events, and review patent activity related to payment authentication and tokenization. The sources listed here are illustrative, and many other public references were used to collect data, validate assumptions, and clarify open questions.
Primary Interviews and Surveys
Primary work was used to pressure test what desk sources cannot fully explain, in particular where payment mix, pricing logic, and merchant adoption differ by channel and industry. We spoke with stakeholders across issuers, acquirers, payment service providers, gateways, merchants, and enabling technology roles, then aligned the findings to Canada wide signals on checkout volumes, online sales intensity, and contactless usage. For a country level market, we prioritized cross industry coverage and used repeated follow ups when early assumptions showed wide variance.
Distribution of primary research fieldwork respondents
| Company type | Respondent position |
|---|---|
| Top tier: 29% | CXOs: 15% |
| Mid tier: 55% | Functional/Unit leaders: 42% |
| Smaller Players: 16% | Managers: 43% |
Market-Sizing & Forecasting
Sizing was built using a top-down approach where retail spending and e-commerce demand signals are reconstructed into an addressable checkout pool, then split by point of sale versus online, followed by payment mode shares that were validated with interviews. To keep the totals realistic, we corroborated the output with selective bottom-up checks, such as sampled pricing ranges for processing and acceptance services, merchant mix checks by end user industry, and supplier revenue roll ups where disclosures were clear. Where gaps remained, we handled them through conservative proxy ranges.
Key inputs that shaped the model included card and contactless usage trends, digital wallet adoption at checkout, online purchase intensity for goods and services (including travel and accommodation bookings), industry level payment behavior across retail and hospitality heavy merchants, and the expected pace of real time rail readiness and merchant enablement. For forecasting, we used scenario analysis supported by a light multivariate view. Variables such as e-commerce growth, terminal and wallet penetration, and average pricing progression were adjusted using what interviewees described as the most likely path, then stress tested through sensitivity cases that were either more aggressive or more conservative.
Data Validation & Update Cycle
Validation was done through multiple checks so one data series does not drive the full result. We compared model totals against independent signals, such as national payment value and volume trends, retail and online sales growth, and observed shifts in payment method mix, then revisited underlying assumptions when we saw large jumps. Before sign off, the work is reviewed in steps, with a second analyst checking formulas, unit consistency, and year to year continuity, and we re contacted experts when a key input moved outside the expected band.
Reports are refreshed annually, and interim updates are made when material events occur, such as major regulatory changes, new payment rail milestones, or step changes in merchant acceptance behavior. Before delivery, a final pass is completed so clients receive the most current view available at that time.
Mordor Intelligence's Canada Payments Market Size Measured Against Other Published Estimates
Published market sizes for Canada payments can look far apart because the word payments is used loosely, and each publisher picks a different meaning for what is being counted and priced. In our work, the number is kept tied to checkout activity by channel, followed by clear payment modes, then matched to realistic pricing and adoption inputs.
Key gap drivers usually come from what is included as a payment, which years are treated as the base case, and how transaction value is converted into market value using take rate or fee assumptions. Online purchases of utility bill payments and credit card bill payments sit outside Mordor Intelligence's scope, which reduces the chance of inflating the market by mixing commerce checkout with financial account servicing flows.
Benchmark comparison
| Source | Market Size | Gaps in Research Methodology |
|---|---|---|
| Mordor Intelligence | USD 1.43 B (2025) | |
| Industry Association A | USD 12.20 T (2024) | Often reported as total payment transaction value across methods, which is not comparable to a market value measure because it does not apply a pricing layer and can include large value transfer rails beyond checkout. |
| Trade Journal B | USD 0.91 T (2024) | Typically limited to card payment transaction value and a single year outlook, which skips non card modes and does not translate processed value into revenue based market size using consistent fee and mix assumptions. |
The table shows that many public numbers are actually transaction value totals, either across all payment methods or within cards only, so they can be many times larger than a fee based market sizing view. By keeping the scope anchored to consumer checkout flows and applying repeatable price and adoption logic, we produce a practical size estimate that can be tracked and updated as underlying usage shifts.
Key Questions Answered in the Report
What is the current value of the Canada payments market?
The market stands at USD 1.66 billion in 2026 and is projected to climb to USD 3.47 billion by 2031.
How fast is digital wallet adoption growing at Canadian checkouts?
Digital wallets at the point of sale are rising at an 17.82% CAGR, the quickest rate among in-store payment methods.
Which transaction type is expanding the most?
Person-to-person transfers are forecast to grow at 16.74% annually as consumers embrace instant, low-fee money movement.
How will the interchange fee cap affect issuers?
Lower interchange trims issuer revenue pools by up to USD 1 billion over five years, pushing banks toward fee-based and data-driven services.
What strategic benefit will the forthcoming Real-Time Rail provide?
RTR will enable near-instant settlement across retail and commercial use cases, enhancing liquidity and cutting counterparty risk, especially for cross-border traders.
Why is healthcare seen as a high-growth vertical?
Hospitals and clinics are digitizing billing and procurement processes, driving a 19.36% CAGR outlook for payment volumes in the healthcare space.