
Market Overview
| Study Period | 2020 - 2031 |
|---|---|
| Forecast Data Period | 2026 - 2031 |
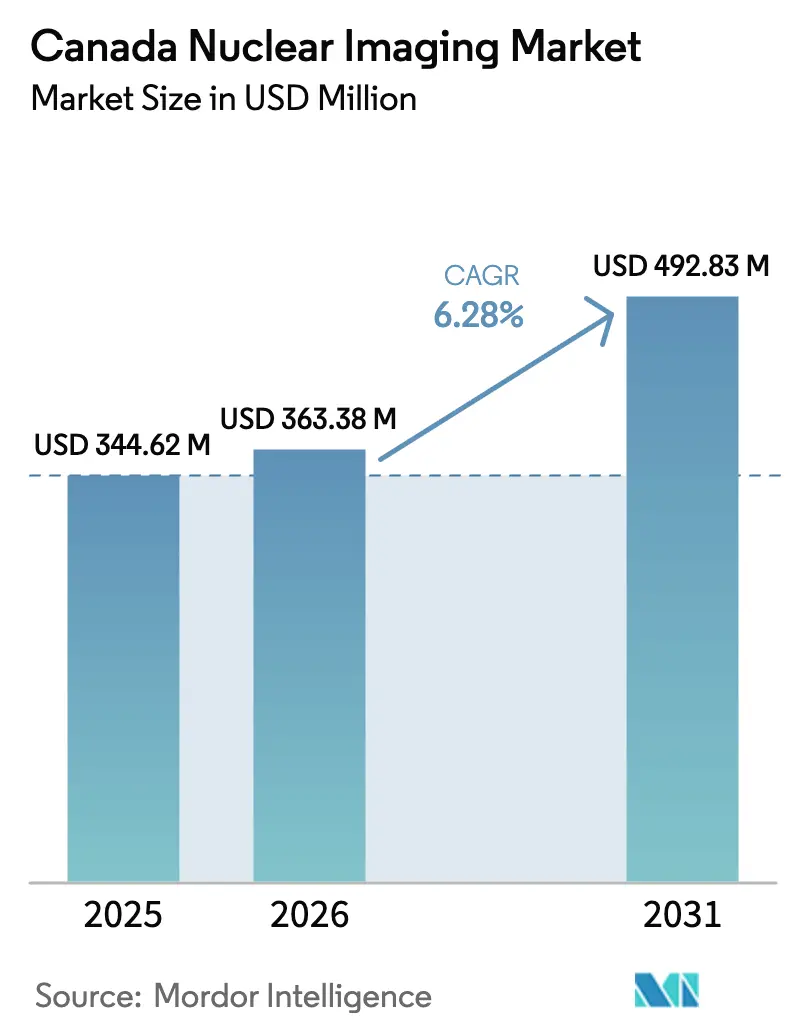
| Base Year Market Size (2025) | USD 344.62 Million |
| Market Size (2026) | USD 363.38 Million |
| Market Size (2031) | USD 492.83 Million |
| Growth Rate (2026 - 2031) | 6.28 % |
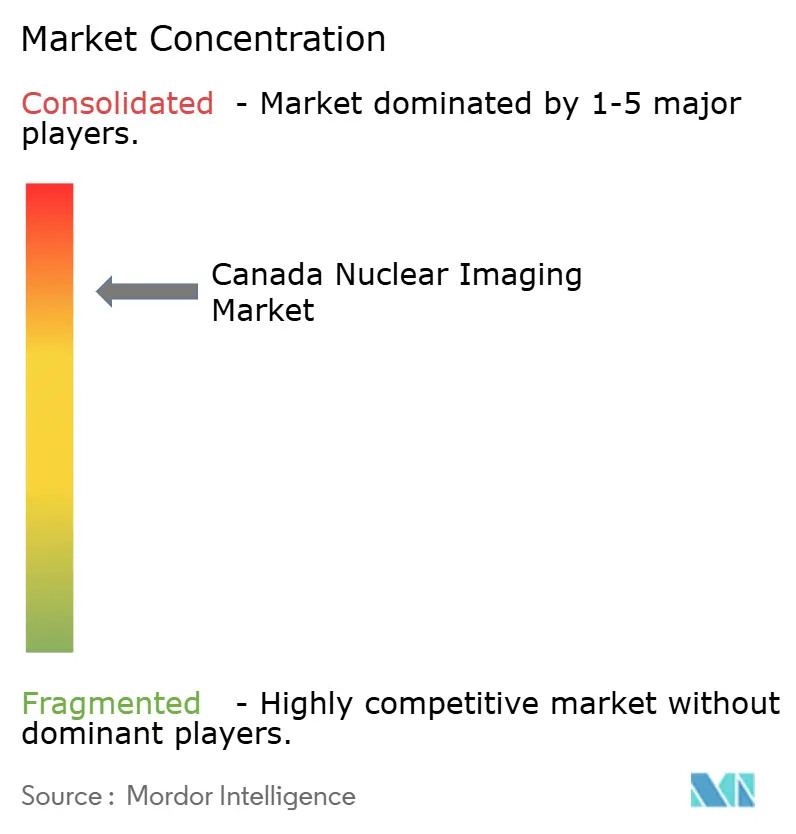
| Market Concentration | High |
Major Players *Disclaimer: Major Players sorted in no particular order Image © Mordor Intelligence. Reuse requires attribution under CC BY 4.0. | |
Canada Nuclear Imaging Market Analysis by Mordor Intelligence
The Canada Nuclear Imaging Market size is projected to expand from USD 344.62 million in 2025 and USD 363.38 million in 2026 to USD 492.83 million by 2031, registering a CAGR of 6.28% between 2026 to 2031.
Escalating cancer and cardiovascular disease prevalence, widening access to hybrid scanners, and sizeable provincial investments in cyclotron capacity continue to lift procedure volumes. Hybrid PET/CT retains the largest revenue share, yet hybrid PET/MR is advancing most rapidly as academic centers pursue simultaneous metabolic, functional, and structural imaging. Software platforms underpinned by artificial-intelligence reconstruction are expanding faster than hardware because hospitals are looking for productivity gains that offset technologist shortages. At the same time, distributed isotope production initiatives in Ontario, British Columbia, and Alberta are tempering the single-point-of-failure risk that followed the 2018 closure of the National Research Universal reactor.
Key Report Takeaways
- By modality, hybrid PET/CT held 39.35% revenue share in 2025, while hybrid PET/MR is projected to record the fastest 10.24% CAGR through 2031.
- By component, equipment captured 63.63% of revenue in 2025, whereas software platforms are forecast to expand at a 9.57% CAGR to 2031.
- By radio-isotope, fluorine-18 commanded 37.94% revenue share in 2025 and gallium-68 is on track for a 10.33% CAGR through 2031.
- By application, oncology led with 52.68% revenue share in 2025, while neurology is set to grow at an 8.29% CAGR through 2031.
- By end user, hospitals generated 61.53% of revenue in 2025 and academic and research institutes are expected to post the highest 8.12% CAGR to 2031.
Note: Market size and forecast figures in this report are generated using Mordor Intelligence’s proprietary estimation framework, updated with the latest available data and insights as of January 2026.
Canada Nuclear Imaging Market Trends and Insights
Drivers Impact Analysis*
| Driver | (~) % Impact on CAGR Forecast | Geographic Relevance | Impact Timeline |
|---|---|---|---|
| Growing prevalence of cancer and CVD | +1.8% | Ontario, Quebec, British Columbia | Long term (≥ 4 years) |
| Rising adoption of hybrid PET/CT & SPECT/CT | +1.5% | Academic hubs in Toronto, Montreal, Vancouver, Calgary | Medium term (2-4 years) |
| Government investments in radiopharma supply | +1.2% | British Columbia, Alberta, Ontario | Medium term (2-4 years) |
| Digital detector innovations lowering dose | +0.9% | Early adopters in Nova Scotia, British Columbia | Short term (≤ 2 years) |
| Expansion of non-F-18 cyclotron isotopes | +0.7% | Vancouver, Toronto, Montreal academic centers | Long term (≥ 4 years) |
| U.S.–Canada border medical-tourism demand | +0.3% | British Columbia, Ontario border regions | Short term (≤ 2 years) |
| Source: Mordor Intelligence | |||
Growing Prevalence of Cancer & CVD
Canada registered 247,100 new cancer cases and 88,100 cancer deaths in 2024, while 2.4 million adults live with cardiovascular disease, a burden that is reshaping diagnostic pathways.[1] FDG PET/CT stays central for non-small-cell lung cancer staging, whereas gallium-68 PSMA PET is now displacing conventional imaging for intermediate- and high-risk prostate cancer after Health Canada cleared Pluvicto in 2022.[2] Rubidium-82 cardiac PET attracts cardiology departments because it delivers 75% less radiation than technetium-99m SPECT. Cancer Care Ontario plans six additional PET scanners by 2028, reinforcing capacity in underserved regions.The Canada nuclear imaging market therefore enjoys a 1.8-percentage-point CAGR lift tied directly to disease-burden growth.
Rising Adoption of Hybrid PET/CT & SPECT/CT
The 2022–2023 Canadian Medical Imaging Inventory listed 60 PET/CT and 331 SPECT/CT units compared with 210 standalone SPECT cameras that now average 13.2 years of service.[3] Integrated scanners shorten time-to-diagnosis and reduce interpretive uncertainty because anatomical and functional data are co-registered in one session. New digital platforms such as GE HealthCare’s Omni Legend and Siemens Healthineers’ Biograph Vision Quadra increase photon sensitivity two- to three-fold, which translates into 50% lower dose or 40% faster acquisitions. Provincial health authorities in Nova Scotia and British Columbia funded digital SPECT/CT installations in 2024, signaling growing willingness to back premium technology. Rising hybrid adoption contributes an additional 1.5-percentage-point lift to the Canada nuclear imaging market CAGR.
Government Investments in Radiopharmaceutical Capacity
After the National Research Universal reactor closed in 2018, Canada pivoted towards cyclotron-based isotope production. TRIUMF obtained CAD 35 million (USD 26 million) in 2023 to develop a national isotope ecosystem that includes gallium-68 and actinium-225. British Columbia’s CAD 32 million cyclotron and Alberta’s Calgary Radiopharmaceutical Centre, under construction through 2027, decentralize supply and shorten delivery times for short-lived tracers. BWXT Medical’s Target Delivery System at Darlington gained a license in 2023 and now produces molybdenum-99, yttrium-90, and indium-111. These projects raise domestic self-sufficiency and add 1.2 percentage points to the market’s forecast CAGR.
Digital Detector Innovations Lowering Dose
Cadmium zinc telluride detectors in SPECT and silicon photomultiplier arrays in PET convert photons to electrical signals with higher efficiency, doubling photon sensitivity and sharpening energy resolution. The Queen Elizabeth II Health Sciences Centre documented a 40% technetium-99m dose reduction for myocardial perfusion studies after installing a GE StarGuide SPECT/CT in 2024. Nanaimo Regional General Hospital achieved similar results, halving bone-scan acquisition time while expanding daily capacity. Dose optimization aligns with Health Canada radiation-safety guidelines and partially offsets workforce shortages, delivering a 0.9-percentage-point CAGR boost.
Restraints Impact Analysis*
| Restraint | (~) % Impact on CAGR Forecast | Geographic Relevance | Impact Timeline |
|---|---|---|---|
| Radio-isotope supply risks post-NRU closure | -1.1% | Remote and northern regions nationwide | Medium term (2-4 years) |
| High capex and opex of hybrid scanners | -0.8% | Smaller hospitals and rural facilities | Long term (≥ 4 years) |
| Health Canada regulatory approval timelines | -0.5% | National | Medium term (2-4 years) |
| Shortage of certified nuclear-medicine staff | -0.9% | Particularly acute in Atlantic provinces and North | Long term (≥ 4 years) |
| Source: Mordor Intelligence | |||
Radio-Isotope Supply Risks Post-NRU Closure
With domestic molybdenum-99 production absent until BWXT Medical’s ramp-up hits full stride, many hospitals still depend on South African and European reactors for technetium-99m generators. Transport disruptions can delay deliveries of isotopes whose half-life is just six hours, forcing postponement of non-urgent scans. TRIUMF’s direct cyclotron production, though approved, satisfies only a fraction of national demand. British Columbia and Alberta projects will narrow the gap by 2027, but Atlantic provinces and northern territories will remain vulnerable to weather-related shipping delays. The result is a -1.1 percentage-point drag on the Canada nuclear imaging market CAGR.
High Capex & Opex of Hybrid Scanners
PET/CT units cost USD 1.8 million–3.5 million, SPECT/CT units require USD 1.5 million–2.5 million, and annual service contracts can top USD 0.5 million. Utilization below about 1,200 scans per year risks negative returns, a barrier for smaller hospitals. Forty-one percent of PET/CT systems already exceed ten years of age, signaling deferred replacement cycles. Leasing mitigates upfront cost yet raises lifetime expense by 20%–30%. Consequently, capital constraints subtract 0.8 percentage points from the Canada nuclear imaging market’s trend growth.
*Our forecasts treat driver/restraint impacts as directional, not additive. The impact forecasts reflect baseline growth, mix effects, and variable interactions.
Segment Analysis
By Modality: Hybrid Platforms Sustain Leadership While PET/MR Accelerates
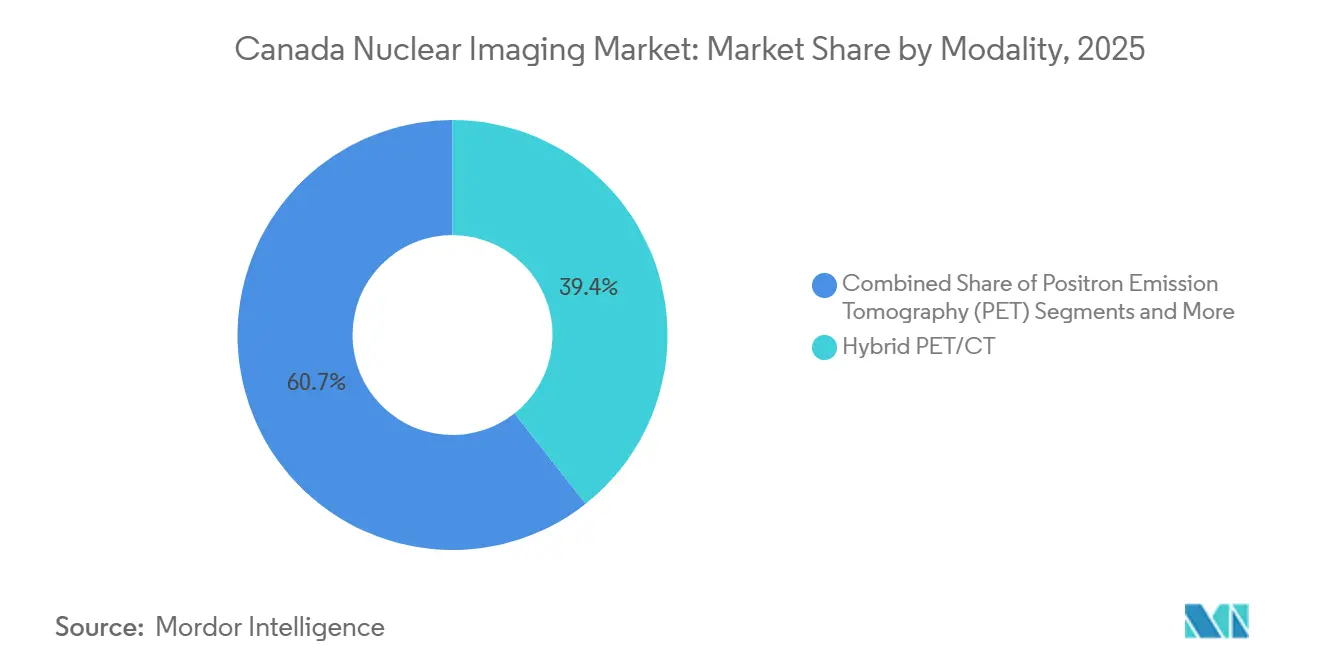
Hybrid PET/CT generated 39.35% of modality revenue in 2025, underlining its entrenched role in oncology staging and therapy response. Stand-alone SPECT cameras are declining as hospitals pivot to hybrid SPECT/CT systems that offer both functional and anatomical data without requiring patient relocation. The Canada nuclear imaging market size for hybrid PET/CT modalities is projected to climb at the overall 6.28% CAGR, whereas hybrid PET/MR leads with a 10.24% CAGR due to superior soft-tissue contrast essential for neuro-oncology and inflammatory bowel disease. Equipment makers have responded: GE HealthCare’s 32 cm-axial Omni Legend shortens total-body scan time to 12 minutes, and Siemens Healthineers’ 106 cm-axial Biograph Vision Quadra enables simultaneous multi-organ pharmacokinetics for theranostic dosimetry. Digital cadmium zinc telluride detectors in next-generation SPECT/CT deliver twice the photon sensitivity of legacy photomultiplier tubes, permitting 50% dose cuts that help labs meet dose-optimization mandates. Hospitals in Halifax and Nanaimo adopted such systems in 2024, evidencing readiness to pay premium prices when dose savings and higher throughput combine. As old SPECT fleets age out—the average system is 13.2 years—the Canada nuclear imaging market share held by hybrid scanners will keep widening.

By Component: Equipment Still Dominates Yet Software Gains Momentum
Equipment captured 63.63% of component revenue in 2025 because several provinces budgeted for hybrid-scanner replacements, but software subscriptions are rising at 9.57% annually as AI-driven image-reconstruction and lesion-quantification tools become standard. The Canada nuclear imaging market size tied to software is therefore growing faster than hardware even though suppliers often bundle first-year licenses with scanner deals. AI-assisted quantification from Siemens’ AI-Rad Companion or GE HealthCare’s Edison platform cuts radiologist reading time 30%–40%, a critical benefit when staffing is tight. Vendors now price upgrades on a per-study or annual-license basis, creating resilient recurring revenue. Consumables such as radiopharmaceutical doses and quality-control phantoms ride on procedure volumes, which expand at the overall 6.28% CAGR. BWXT Medical’s domestic yttrium-90 and indium-111 production will further anchor recurring consumable revenue as isotope self-sufficiency improves.
By Radio-Isotope: Fluorine-18 Retains Primacy, Gallium-68 Surges
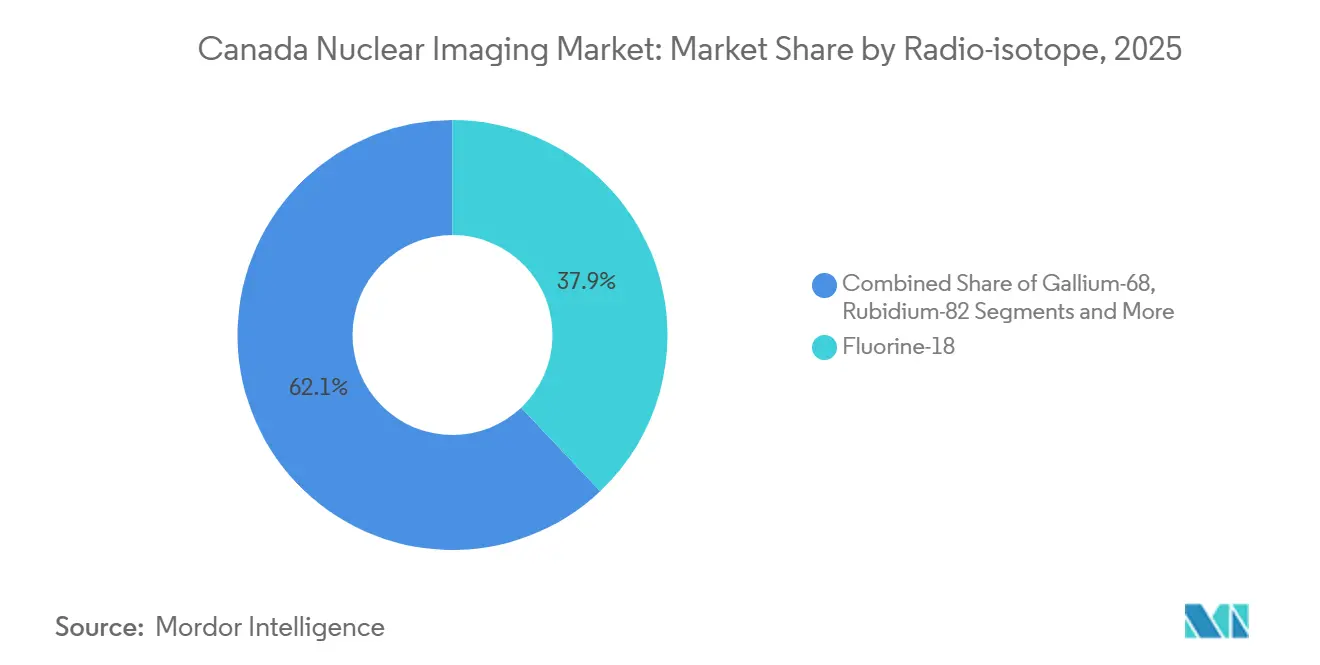
Fluorine-18 contributed 37.94% of isotope revenue in 2025 because FDG PET/CT occupies the oncology mainstream and the 110-minute half-life supports regional distribution. Technetium-99m remains indispensable for bone, cardiac, and renal scanning, yet supply risks continue until domestic molybdenum-99 output stabilizes. Gallium-68 is the fastest-growing isotope at a 10.33% CAGR and underpins PSMA and DOTATATE imaging. Health Canada’s approval of lutetium-177 PSMA-617 in 2022 cemented the theranostic pairing that drives diagnostic gallium-68 use. Provincial cyclotron projects will allow on-site gallium-68 generator production, improving access beyond Ontario. Rubidium-82 cardiac PET gains favor because it delivers 75% lower radiation than technetium-99m SPECT while avoiding cyclotron dependence. Investigational isotopes such as copper-64 and zirconium-89 are now in Phase II academic trials, setting the stage for diversified isotope portfolios after 2030.
By Application: Oncology Commands, Neurology Accelerates
Oncology absorbed 52.68% of application revenue in 2025 thanks to FDG PET/CT and accelerating PSMA PET utilization. Neurology is forecast to grow at 8.29% CAGR as amyloid and tau PET tracers gain reimbursement, enabling earlier Alzheimer’s differentiation. Cardiology sits second in share; the shift from SPECT to PET proceeds as rubidium-82 generators lower dose and improve accuracy. Endocrinology remains a smaller yet steady niche, rooted in iodine-based thyroid imaging and therapy. Infection and inflammation studies continue contracting as CT and MRI alternatives mature. Large provincial cancer-centers in British Columbia and Ontario have already embedded PSMA theranostics into routine pathways, underscoring oncology’s catalytic role for the Canada nuclear imaging market.
By End User: Hospitals Hold Lead, Academic Institutes Outpace Growth
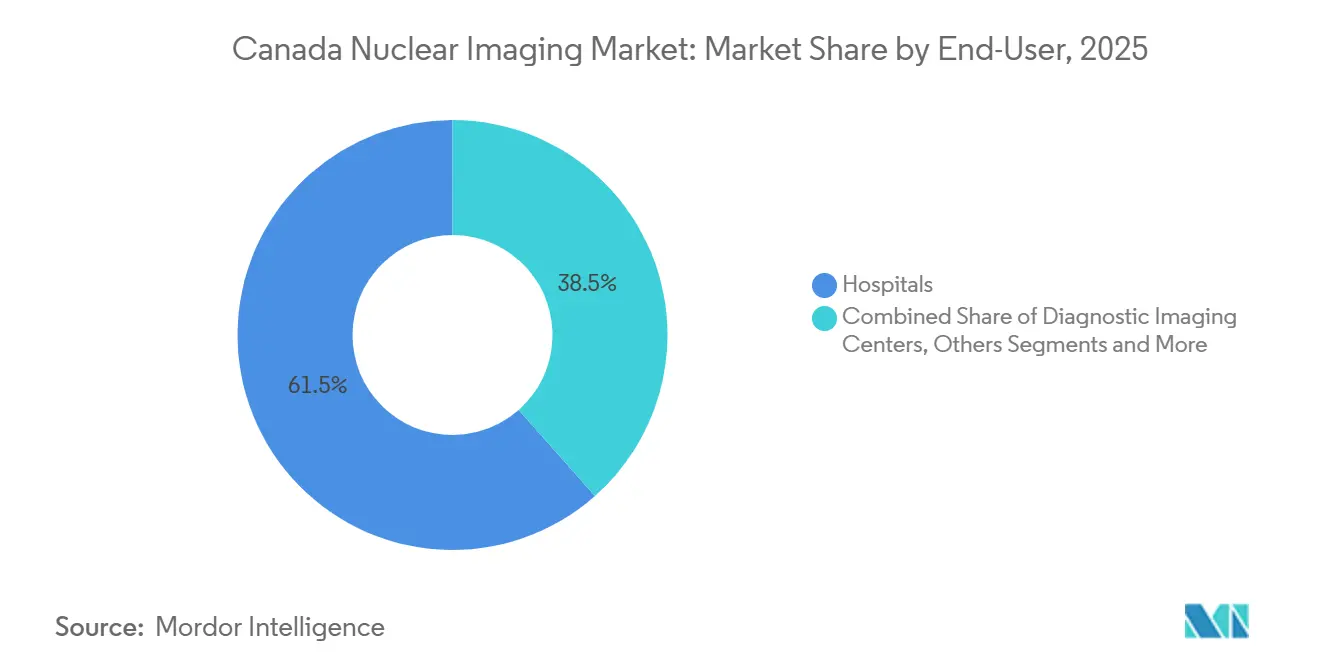
Hospitals generated 61.53% of end-user revenue in 2025, reflecting single-payer referral patterns. Diagnostic imaging centers offer shorter waits but still face volume ceilings under provincial reimbursement caps. Academic and research institutes grow fastest at 8.12% CAGR because they secure federal grants and industry partnerships for total-body PET, theranostics, and novel radiopharmaceutical trials. The Canada nuclear imaging market share tilted toward hospitals will gradually narrow as academic centers commercialize innovations that downstream hospitals later adopt. Academic hubs also house new cyclotron facilities that distribute isotopes to regional hospitals, reinforcing their pivotal supply-chain role.
Geography Analysis
Ontario, Quebec, and British Columbia account for nearly 70% of Canada nuclear imaging market capacity because they host large population centers and academic medical networks. Ontario leads on absolute procedure volume, with Princess Margaret Cancer Centre and the Ottawa Hospital anchoring theranostic adoption. Quebec’s CHUM and McGill University Health Centre leverage in-house cyclotrons to support high tracer diversity. British Columbia’s USD 23.7 million University of British Columbia cyclotron, operational since 2026, positions the province as the western isotope hub, cutting delivery times for isotopes whose half-life is less than two hours. Alberta’s Calgary Radiopharmaceutical Centre, slated for completion in 2027, will serve Prairie provinces and trim dependency on Ontario. Atlantic provinces lean on Halifax’s Queen Elizabeth II Health Sciences Centre, where a 2024 digital SPECT/CT upgrade improved throughput and reduced technetium-99m dose, yet patients in rural communities still drive hundreds of kilometers for scans. Northern territories remain dependent on medical evacuations to southern centers because population density cannot justify on-site facilities.
Reimbursement policies shape regional growth. Ontario’s six-scanner expansion aimed for 2028 prioritizes northern and eastern communities, whereas British Columbia funnels nuclear-medicine funding through BC Cancer’s centralized network. Alberta maintains a mixed public-private model, allowing independent imaging centers to contract services, but logistics complexity increases for isotope supply. Technologist shortages further widen regional disparities: vacancy rates climb above 10% in Atlantic Canada, leading to longer appointment backlogs despite hardware upgrades. Decentralized cyclotron investment will alleviate some supply pressure by 2031, yet Ontario’s mature academic ecosystem retains first-mover advantage, maintaining the province’s status as the innovation hub of the Canada nuclear imaging market.
Regulatory Landscape
Nuclear imaging in Canada operates under dual oversight. Health Canada regulates imaging systems and related software as medical devices under the Food and Drugs Act and Medical Devices Regulations. The Canadian Nuclear Safety Commission (CNSC) regulates nuclear substances and prescribed equipment used in isotope production and imaging under the Nuclear Safety and Control Act. Where technologies intersect both domains, Health Canada medical device licensing and CNSC requirements can apply in parallel, which can affect procurement timelines and the sequencing of new platform rollouts.
Coordination mechanisms are designed to reduce duplication across agencies, including a formal Memorandum of Understanding between Health Canada and the CNSC to align oversight for radioisotope-related technologies. On the supply side, licensed nuclear-substance processing capacity is a compliance anchor for radiopharmaceutical continuity. CNSC licensing of facilities such as BWXT Medical Ltd. (licensed through October 31, 2031) supports domestic production and distribution activities that, in turn, shape hospital scan scheduling and tracer availability.
Value Chain Analysis
The Canada nuclear imaging value chain begins with isotope and radiopharmaceutical inputs (target materials, generator components, cold kits, and QC materials), then moves into isotope production and radiopharmaceutical manufacturing across reactor-linked and cyclotron-linked pathways. Major domestic nodes include BWXT Medical, TRIUMF, Canadian Nuclear Laboratories (CNL), Bruce Power, and McMaster University. Downstream distribution is supported by radiopharmacy networks such as Jubilant Radiopharma. Many tracers have short half-lives, so logistics and last-mile delivery remain binding constraints.
Imaging hardware and software then move through OEM manufacturing and Canadian commercialization channels led by companies such as GE HealthCare and Siemens Healthineers. This is followed by installation, acceptance testing, service contracts, and application training delivered with hospital biomedical teams and vendor field organizations. Clinical delivery takes place primarily in hospitals and academic centers, which also function as translation hubs for new protocols and trials. For example, sites such as Lawson Health Research Institute and the QEII Health Sciences Centre act as early adopters for premium hybrid systems, which helps validate workflows that later diffuse to regional hospitals under provincial purchasing and reimbursement frameworks.
Competitive Landscape
The Canadian nuclear imaging market has a moderate concentration profile. Competition revolves around detector efficiency, axial field of view, and bundled AI analytics. GE’s 32 cm Omni Legend emphasizes shorter scan times, Siemens’ 106 cm-long Vision Quadra targets total-body kinetics, Philips favors low-dose workflow integration, and Canon leverages Aquilion-based CT back-ends for PET/CT. On the isotope side, BWXT Medical, Nordion, Jubilant Radiopharma, Lantheus, and Curium carve overlapping niches. BWXT’s Target Delivery System in Darlington produces molybdenum-99, yttrium-90, and indium-111 for generator assembly. Lantheus recorded USD 136.5 million in PYLARIFY revenue in Q3 2024, a 59% year-over-year spike that confirms commercial appetite for PSMA tracers.
Future white-space centers on theranostics and ultra-short-lived isotopes. Bruce Power’s October 2025 expansion of lutetium-177 production positions Canada as a potential net exporter of therapeutic isotopes. Kinectrics’ September 2025 completion of a ytterbium-176 enrichment line provides domestic supply for lutetium-177 precursors, guarding against foreign-source risk. Smaller challengers like Advanced Cyclotron Systems Inc. target regional isotope production to shrink last-mile delivery delays. Regulatory barriers remain significant: Health Canada’s 12- to 18-month approval pathway favors well-resourced incumbents, yet investigator-initiated academic trials on copper-64 and zirconium-89 could pave the way for new entrants by the end of the decade. With provincial health authorities embracing dose-reducing digital detectors, vendors that bundle AI applications and flexible financing are well placed to defend share.
Canada Nuclear Imaging Industry Leaders
-
GE Healthcare
-
Koninklijke Philips N.V.
-
Siemens Healthineers
-
Jubilant Radiopharma
-
BWXT Medical
- *Disclaimer: Major Players sorted in no particular order
Market Opportunities and Future Outlook
Radiopharmaceutical supply resilience is a defined whitespace, especially outside major metro corridors where short-lived tracers and transport variability can tighten scheduling. Government-backed ecosystem building provides a concrete pathway for additional capacity and commercialization, including the Canadian Medical Isotope Ecosystem consortium launched with CAD 35 million in 2023 to strengthen production and distribution across isotopes and radiopharmaceuticals. Facility-led initiatives spanning TRIUMF, BWXT Medical, Bruce Power, and McMaster University also broaden the domestic base for diagnostic and theranostic isotopes.
On the clinical side, opportunities cluster around hybrid imaging and theranostics enablement, where hospitals and academic institutes are investing in platforms and partnerships to expand protocol breadth and throughput. Examples include the Theranostics Center of Excellence collaboration involving St. Josephs Health Care London and Lawson Health Research Institute with GE HealthCare, and CNL working with Jubilant Radiopharma under the Canadian Nuclear Research Initiative-Health program to develop novel alpha radiopharmaceuticals. Demand-side momentum is visible through provincial adoption of advanced hybrid systems. The QEII Health Sciences Centre deployment of StarGuide SPECT/CT in Nova Scotia supports workflow modernization and creates room for software-led productivity layers (AI reconstruction and quantification) that can integrate into existing scanner fleets while addressing technologist and radiologist capacity constraints.
Recent Industry Developments
- June 2026: Siemens Healthineers reports Lawson Health Research Institute at St. Joseph’s Health Care London installing Canada’s first Biograph One PET/MRI scanner, with a 65.75 million CAD grant from WSIB and the WorkSafe Ontario Fund. The installation represents the first Canada PET/MRI deployment of the Biograph One and signals premium hybrid imaging expansion supported by provincial funding enabling adoption in Canada.
- June 2026: Siemens Healthineers expands the photon counting CT portfolio in Canada with the NAEOTOM Alpha class system. The expansion broadens Canada CT hardware with photon counting capability, improving diagnostic imaging performance and workflow efficiency for nuclear imaging programs.
- June 2026: Siemens Healthineers, Lawson Health Research Institute at St. Joseph’s Health Care London installed Canada’s first Siemens Healthineers Biograph One PET/MRI scanner, supported by a 65.75 million CAD investment from the Workplace Safety and Insurance Board and the WorkSafe Ontario Fund. The deployment reinforces premium hybrid imaging capability and reflects continued provincial support for advanced imaging.
Research Methodology Framework and Report Scope
Market Definition and Coverage
For this study, the Canada nuclear imaging market covers the value generated from nuclear medicine imaging procedures and the enabling products used to deliver them, across Canada. This includes equipment, related software, and routine consumables used in PET and SPECT workflows.
Scope exclusions: We exclude radiation therapy uses, general X-ray/CT/MRI systems when they are not part of hybrid nuclear imaging, and purely research-only imaging activity that is not part of routine clinical care.
Segmentation Overview
- By Modality
- Positron Emission Tomography (PET)
- Single Photon Emission CT (SPECT)
- Hybrid PET/CT
- Hybrid SPECT/CT
- Others (e.g., PET/MR)
- By Component
- Equipment
- Software
- Accessories & Consumables
- By Radio-isotope
- Fluorine-18
- Technetium-99m
- Iodine-123/131
- Gallium-68
- Rubidium-82
- Others
- By Application
- Oncology
- Cardiology
- Neurology
- Endocrinology
- Others
- By End User
- Hospitals
- Diagnostic Imaging Centers
- Academic & Research Institutes
- Others
Data Sources, Market Sizing, and Validation
Desk Research
Desk research began by mapping how imaging activity and healthcare capacity are described in Canada, then it was narrowed down to nuclear medicine spend drivers. We relied on public sources such as Statistics Canada health expenditure and demographic tables, the Canadian Institute for Health Information for utilization and system capacity context, and Health Canada for approvals and safety notices that can affect radiopharmaceutical availability.
To keep the model grounded, we also reviewed Canadian nuclear medicine and radiology society publications for clinical practice direction, peer reviewed journal articles for procedure volumes and modality mix, and provincial health ministry budget documents for capital spending signals. Company filings and investor presentations were reviewed to understand product mix and pricing direction, while a paid subscription for company financials and a patent database were used only to confirm launch timing and pipeline intensity. These are illustrative source types, and many other public documents were also used for data collection, validation, and clarification.
Primary Interviews and Surveys
Primary work focused on cross checking procedure growth, modality mix (PET versus SPECT), and typical pricing behavior across provinces, because these variables shift the value outcome. We spoke with stakeholders across hospitals, imaging centers, radiopharmacy and isotope supply, and equipment service partners. The discussions were balanced to reflect the main Canadian demand clusters, while still capturing smaller provincial markets that can behave differently.
Distribution of primary research fieldwork respondents
| Company type | Respondent position |
|---|---|
| Top tier: 27% | CXOs: 16% |
| Mid tier: 55% | Functional/Unit leaders: 39% |
| Smaller Players: 18% | Managers: 45% |
Market-Sizing & Forecasting
Sizing used a top down build that starts from the addressable diagnostic imaging demand pool in Canada, then reconstructs nuclear imaging value using modality penetration and procedure level economics. In practice, we linked the demand pool to indicators such as the aging population trend, oncology and cardiology diagnostic workups that commonly trigger PET or SPECT, and the installed base direction for PET/CT and SPECT/CT systems in large hospital networks.
Those totals were then corroborated with selective bottom up checks. In these checks, sampled procedure volumes and typical reimbursement or hospital charge levels were multiplied to test whether the implied value range remains realistic, and we adjusted where it did not. Inputs also considered radioisotope availability patterns (for example, technetium-99m dependence for SPECT), observed scheduling backlogs, and replacement cycle behavior for scanners and detector upgrades. Forecasting was done using scenario analysis because supply continuity, provincial funding, and new tracer adoption can change the slope. Expert feedback was used to keep assumptions aligned with how sites expand capacity. When bottom up checks had gaps in smaller provinces, we filled them using per site utilization benchmarks and then re-tested the result against national level signals.
Data Validation & Update Cycle
Validation was done by comparing model output against independent signals, then running variance checks across provinces, modalities, and component splits to catch values that drift too far from real world constraints. If an input moved the market total materially, it triggered a second pass and, when needed, a re-contact with a practitioner or procurement respondent to confirm what changed.
Before sign-off, the work goes through multiple analyst reviews so assumptions, unit logic, and currency treatment stay consistent, and the final numbers can be explained step by step. Reports are refreshed annually, with interim updates when major approvals, funding announcements, or supply disruptions occur. Right before delivery, an analyst completes a fresh scan so clients receive the latest updated view.
Mordor Intelligence's Canada Nuclear Imaging Market Size Compared With Other Published Estimates
Published market sizes for Canada nuclear imaging do not always match, and the gaps usually come from what is counted as nuclear imaging revenue, versus what is kept outside the boundary. Differences in whether the estimate is procedure driven or product shipment driven, plus how radiopharmaceutical value is treated, can move the number up or down.
Procedure volume signals and modality utilization checks from interviews are used to keep Mordor Intelligence's estimate tied to PET and SPECT activity that is delivered in Canadian care settings, and equipment and consumables value are then added using realistic replacement and service patterns. Some external figures appear to fold in adjacent nuclear medicine therapy value, apply aggressive growth from pipeline drugs without validating near term site capacity, and currency timing choices can also distort year to year comparisons.
Benchmark comparison
| Source | Market Size | Gaps in Research Methodology |
|---|---|---|
| Mordor Intelligence | USD 344.62 M (2025) | |
| Regional Consultancy A | USD 482.50 M (2026) | The figure likely includes a wider nuclear medicine spend basket, potentially blending imaging with therapy related radiopharmaceutical use, and it also starts from a later year, which can embed a faster adoption step-up. |
| Trade Journal B | USD 414.31 M (2023) | This number appears closer to a nuclear medicine definition that can include non-imaging products, and it may use reported revenues and high growth assumptions without re-testing capacity constraints like scanner time, staffing, and isotope supply continuity. |
Overall, the spread is explained by scope boundaries, timing, and how demand is anchored. Our approach stays traceable because the value is built from procedure activity and then cross checked with realistic price and capacity signals, which keeps the estimate repeatable when new inputs are updated.
Key Questions Answered in the Report
How large is the Canada nuclear imaging market in 2026 and where is it headed?
The market stood at USD 363.38 million in 2026 and is forecast to reach USD 492.83 million by 2031 at a 6.28% CAGR.
Which modality is growing fastest in Canadian nuclear imaging?
Hybrid PET/MR adds the most momentum, advancing at a 10.24% CAGR thanks to superior neuro-oncology and inflammatory-disease applications.
What is driving the strong uptake of gallium-68 tracers?
Health Canada approvals for PSMA theranostics, provincial cyclotron investments, and reimbursement for DOTATATE imaging are propelling gallium-68 demand.
Why are software platforms outpacing hardware revenue growth?
AI-driven reconstruction and workflow tools sold on subscription cut reading time and boost scanner throughput, creating recurring revenue that grows at 9.57% annually.
How are isotope supply risks being mitigated post-NRU reactor closure?
New cyclotron facilities in British Columbia and Alberta, TRIUMF’s isotope-ecosystem funding, and BWXT’s Darlington molybdenum-99 production collectively reduce reliance on overseas reactors.
Which provinces are investing most heavily in nuclear-medicine capacity?
Ontario, British Columbia, and Alberta lead with scanner additions and cyclotron builds, while Quebec maintains strong in-house cyclotron infrastructure.