
Market Overview
| Study Period | 2020 - 2031 |
|---|---|
| Forecast Data Period | 2026 - 2031 |
| Base Year Market Size (2025) | USD 113.03 Million |
| Market Size (2026) | USD 121.17 Million |
| Market Size (2031) | USD 177.28 Million |
| Growth Rate (2026 - 2031) | 7.91 % |
| Market Concentration | Medium |
Major Players *Disclaimer: Major Players sorted in no particular order Image © Mordor Intelligence. Reuse requires attribution under CC BY 4.0. | |
Canada Mammography Market Analysis by Mordor Intelligence
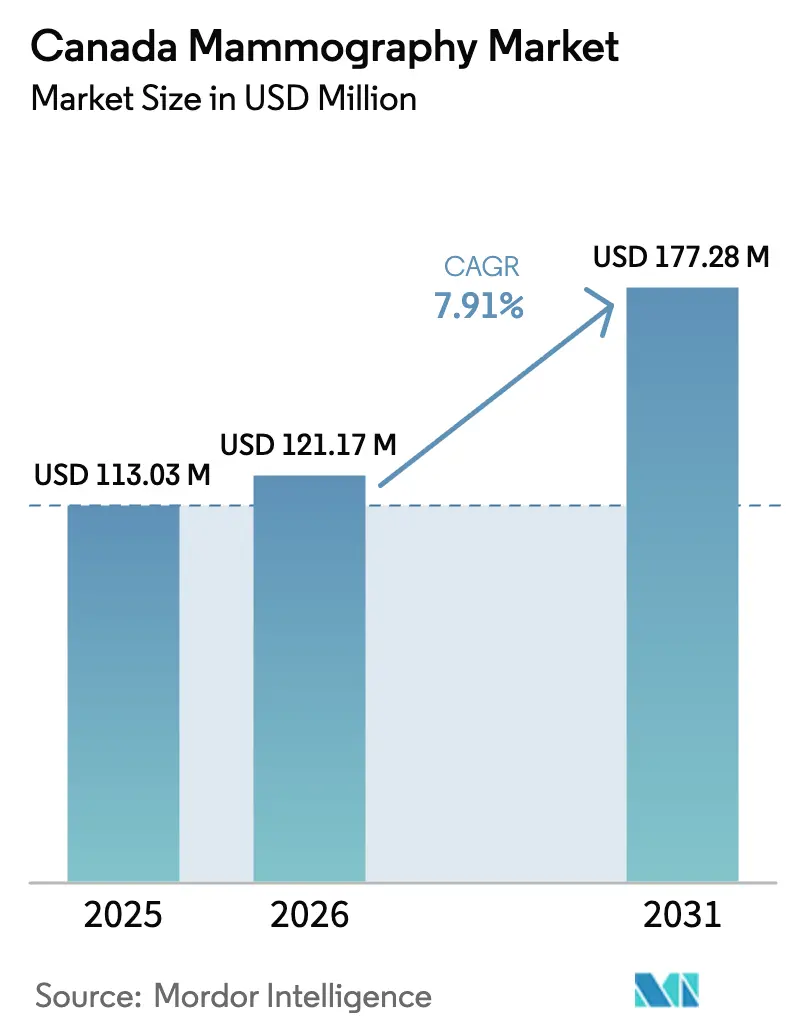
The Canada Mammography Market size was valued at USD 113.03 million in 2025 and is estimated to grow from USD 121.17 million in 2026 to reach USD 177.28 million by 2031, at a CAGR of 7.91% during the forecast period (2026-2031).
Provincial moves to lower the screening start age to 40 years have expanded the eligible population by roughly 1.2 million women and are pushing up procurement cycles for digital and 3D systems. Federal grants that target artificial-intelligence deployments are changing vendor short-lists, favoring platforms with embedded detection algorithms over bolt-on software. Public bulk-purchase frameworks led by Quebec and Alberta are securing 15-20% discounts on equipment and long, standardized service-level agreements. Finally, cloud picture-archiving contracts such as Quebec’s CAD 405.5 million, 12-year Sectra deal are linking rural and urban sites, easing radiologist shortages and supporting mobile-unit workflows.
Key Report Takeaways
- By technology, full-field digital mammography held 61.83% of the Canada mammography market share in 2025, while AI-assisted 3D platforms are forecast to deliver a 9.78% CAGR through 2031.
- By end user, hospitals & surgical centres captured 55.93% of the Canada mammography market size in 2025; diagnostic imaging centres are projected to expand at an 11.97% CAGR between 2026 and 2031.
Note: Market size and forecast figures in this report are generated using Mordor Intelligence’s proprietary estimation framework, updated with the latest available data and insights as of 2026.
Canada Mammography Market Trends and Insights
Drivers Impact Analysis*
| Driver | (~) % Impact on CAGR Forecast | Geographic Relevance | Impact Timeline |
|---|---|---|---|
| Rapid Replacement of Aging Analog Units | +1.8% | National, concentrated in Ontario, Quebec, Alberta | Medium term (2-4 years) |
| Screening Start-Age Lowered to 40 Years | +2.1% | Six provinces, led by Ontario | Short term (≤ 2 years) |
| Federal AI Funding for Diagnostic Imaging | +1.2% | National pilots in British Columbia and Ontario | Medium term (2-4 years) |
| Bulk-Procurement Frameworks | +1.4% | Quebec, Ontario, Alberta | Short term (≤ 2 years) |
| Cloud PACS & Remote Reading Efficiencies | +0.9% | National, early in Quebec and British Columbia | Medium term (2-4 years) |
| Mobile Units for Indigenous & Rural Screens | +0.7% | Saskatchewan, Alberta, Northern Ontario, territories | Long term (≥ 4 years) |
| Source: Mordor Intelligence | |||
Rapid Replacement of Aging Analog Units
Hospitals that delayed digital conversions are now confronting rising service withdrawals from computed radiography hardware, forcing emergency upgrades at premium prices.[1] Quebec eliminated its last CR system in 2023, setting a precedent for other provinces to accelerate retirements. The direct-radiography shift reduces acquisition time to 5–7 minutes per exam, boosting daily throughput by 20–25%. Vendors sweeten trade-in allowances up to 30% of the list price to win multi-unit tenders, thereby reinforcing incumbent market positions. These dynamics keep the Canada mammography market on a steady modernization path.
Provincial Moves to Lower Screening Start-Age to 40 Years
Ontario, Manitoba, Saskatchewan, Newfoundland and Labrador, British Columbia, and Nova Scotia now invite average-risk women from age 40, collectively adding an estimated 1.2 million new participants.[2] Usage at pre-existing centers in Ontario jumped to 92% before the policy shift, so overflow studies are migrating to hospitals and private clinics. Mobile strategies in Manitoba and Saskatchewan favor geographic equity over brick-and-mortar expansions. The resulting capacity squeeze gives AI-triage tools a clear value proposition. Growth pressures, therefore, concentrate demand in the Canada mammography market’s highest-throughput segments.
Federal AI-in-Health-Care Program Funding
More than CAD 50 million in 2024-2025 grants earmark about 18% for diagnostic imaging AI.[3] BC Cancer’s CAD 1.5 million mammography study uses Health Canada–approved Genius AI Detection to cut false negatives in dense-breast populations. Provincial RFPs now stipulate algorithm sensitivity benchmarks, turning embedded AI from an optional add-on into a mandatory spec. Open-source work at the Vector Institute aims to limit bias in Indigenous and immigrant cohorts. While only about 30 radiologists hold formal AI credentials, the funding pipeline signals lasting momentum in the Canada mammography market.
Public Bulk-Procurement Frameworks
Quebec’s CAD 6.8–9.2 million dossier 6768 aggregates 158 installations, yielding double-digit price breaks and uniform 48-hour repair terms. Alberta aligned a CAD 175 million Siemens commitment with its broader oncology build-out, capitalizing on shared maintenance teams to trim lifecycle costs by up to 15%. Grouped contracts increasingly require 3D-readiness, compelling vendors to preload tomosynthesis even where reimbursement remains uncertain. Bulk deals thus accelerate specification creep and reinforce service-centric revenue models across the Canada mammography market.
Restraints Impact Analysis*
| Restraint | (~) % Impact on CAGR Forecast | Geographic Relevance | Impact Timeline |
|---|---|---|---|
| Uneven Reimbursement for DBT and CEM | -1.3% | Ontario, Manitoba, Saskatchewan; partial in BC and Quebec | Medium term (2-4 years) |
| Shortage of CCPM-Certified Physicists | -0.8% | National, acute in Atlantic provinces and territories | Short term (≤ 2 years) |
| Fragmented EMR Integration | -0.6% | Highest in Ontario and British Columbia | Medium term (2-4 years) |
| Rising Cyber-Insurance Premiums | -0.4% | National, worst where breaches rose in 2024 | Short term (≤ 2 years) |
| Source: Mordor Intelligence | |||
Uneven Provincial Reimbursement for DBT and CEM Modalities
Ontario still lacks a dedicated tomosynthesis fee code, burdening hospitals with an incremental CAD 44 per exam and dampening uptake despite 2.2-point recall-rate gains. Quebec reimburses at flat bilateral rates, while BC’s cost study endorsed DBT, but no schedule change followed. Private clinics charge CAD 150–300 for uncovered 3D exams, cementing a two-tier system. Until fee structures align, reimbursement drag will cap premium-platform penetration in the Canada mammography market.
Shortage of CCPM-Certified Mammography Physicists
Roughly 45 physicists are responsible for accreditation nationwide, resulting in 3- to 6-month waitlists for new-unit certification. Quebec recorded seven temporary service suspensions in 2024 due to inspectors being unavailable. Retirement-driven attrition exceeds new graduates, and private-clinic wage premiums worsen public-sector gaps. Accreditation delays, therefore, slow capital deployment and temper growth expectations for the Canadian mammography market.
*Our forecasts treat driver/restraint impacts as directional, not additive. The impact forecasts reflect baseline growth, mix effects, and variable interactions.
Segment Analysis
By Technology: AI Platforms Extend Digital Leadership
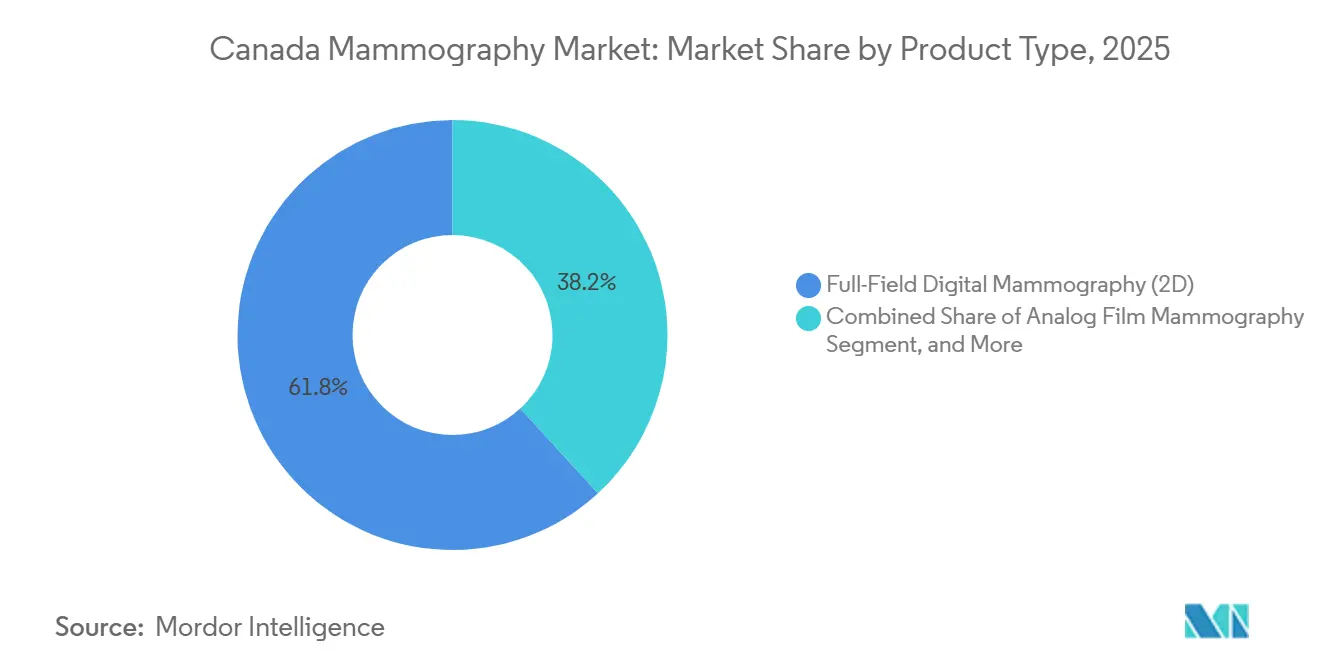
Full-Field Digital Mammography owned 61.83% of the Canada mammography market share in 2025, benefiting from reimbursement certainty and PACS compatibility. AI-assisted 3D systems are projected to log a 9.78% CAGR through 2031, lifted by Health Canada's 2024 clearance of Genius AI Detection and a 15–20% drop in radiologist reading time. Digital Breast Tomosynthesis occupies a clinical sweet-spot but remains fee-code-constrained in several provinces.
Hospital buyers in centralized provinces have begun specifying 3D-readiness as the default, whereas in decentralized jurisdictions, units are still procured as cost-optimized 2D units, with upgrades planned later. Saskatchewan’s mobile units illustrate a throughput-first mindset, prioritizing direct radiography and satellite transfer over complex 3D stacks. As a result, the Canada mammography market size for AI-enabled 3D equipment will accelerate once fee schedules catch up, but near-term volume remains anchored in 2D replacements.

By End User: Private Centers Soak Up Public Backlogs
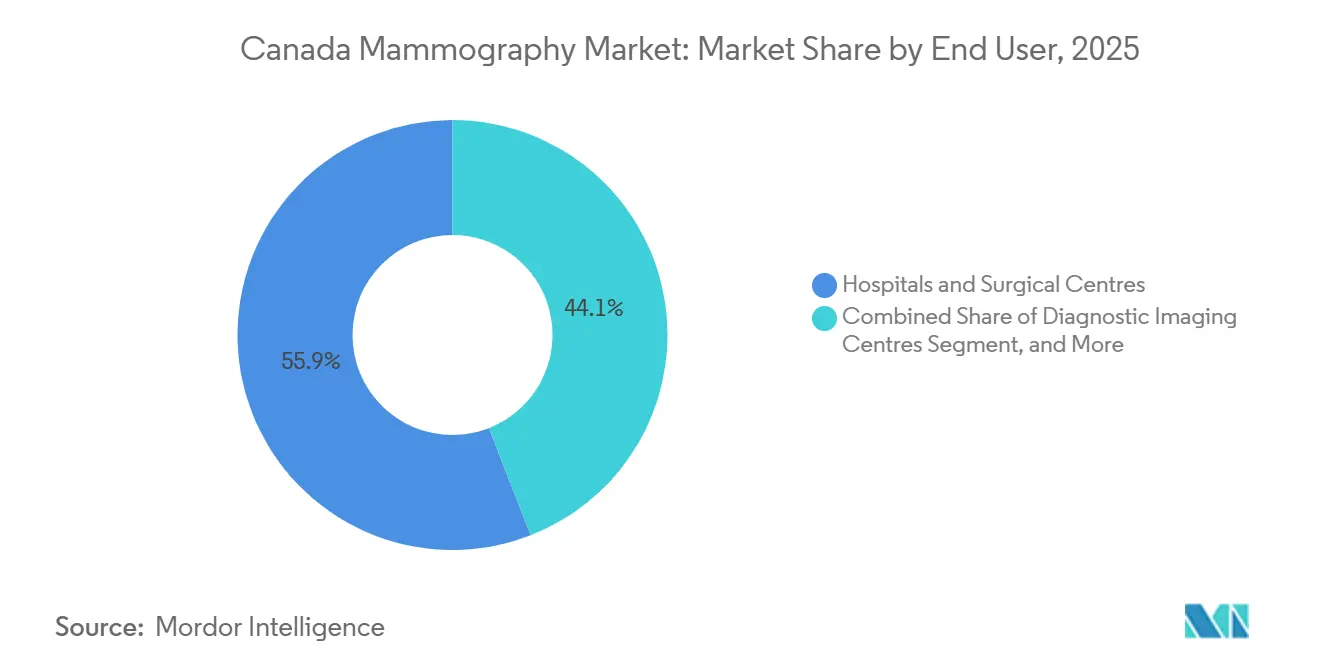
Hospitals & Surgical Centres retained 55.93% of the Canada mammography market size in 2025 because they host most provincial screening programs and provide same-day diagnostic work-ups. Diagnostic Imaging Centres, however, are poised for an 11.97% CAGR as private operators monetize wait-list spillover and bundle tomosynthesis as a self-pay upgrade.
Urban regions see 8 to 10 new private sites each year, while low-density provinces rely on mobile fleets that cut fixed-site costs by roughly 70%. Private-equity-backed Canada Diagnostic Centres accelerated acquisitions across the Prairies in 2024-2025, confirming investor appetite for diversified outpatient imaging. With screening eligibility widened to age 40, diagnostic volumes keep climbing, ensuring that every end-user segment feeds growth in the Canada mammography market.
Geography Analysis
Ontario added 800,000 newly eligible women after its April 2024 age change, yet still lacks a DBT code, forcing hospitals to absorb CAD 44 extra per 3D exam and dampening adoption. Quebec’s centralized tender compressed unit prices by up to 20% and mandates tomosynthesis readiness, illustrating how procurement power shapes capital cycles. British Columbia’s dense-breast program exerts additional load on radiologist capacity, boosting AI triage demand.
Saskatchewan and Manitoba emphasize mobile screening to close rural gaps; Saskatchewan’s first two units exceeded utilization forecasts by 28% in their debut month. Atlantic provinces suffer acute physicist shortages, stretching commissioning delays beyond six months. Northern territories rely almost exclusively on visiting units funded through Indigenous Services Canada programs.
Sectra’s province-wide archive now links more than 60 Quebec sites, while OCINet processes 16 million annual images in Ontario, reducing critical-case time-to-read by more than half. Cross-border interoperability remains limited, obliging patients transferred out of province to undergo repeat scans. These provincial contrasts reinforce a multi-speed landscape within the Canadian mammography market.
Regulatory Landscape
Mammography systems fall under Health Canada’s Medical Devices Regulations (SOR/98-282), requiring manufacturers to obtain device licensing and maintain quality management systems aligned with recognized standards such as ISO 13485:2016. Mammographic X-ray equipment also aligns with federal radiation control expectations, including Health Canada’s Safety Code 36, which sets out requirements for installation, quality assurance testing, and radiation protection practices across clinical use.
Post-market compliance and safety oversight is supported through Health Canada’s Regulatory Operations and Enforcement Branch, with strengthened incident reporting and enforcement authorities linked to Vanessa’s Law. In parallel, provinces add facility-level controls, including acceptance testing and ongoing QA led by medical physicists, which can change commissioning timelines for upgrades such as tomosynthesis or contrast-enhanced workflows, and it shapes how tenders specify documentation, training, and service obligations.
Competitive Landscape
Hologic, GE HealthCare, and Siemens Healthineers together control a majority of installed systems, leveraging nationwide service footprints to win long-term managed-equipment contracts. Hamilton Health Sciences’ 15-year, CAD 270 million deal with Siemens exemplifies a risk-transfer model that smaller hospitals now emulate.
Emerging players target white-space niches. RamSoft’s cloud PACS undercuts legacy on-premise costs by up to 40%, appealing to new private centers. Mobile manufacturers that integrate satellite transfer gain traction as provinces back rural screening vans. Cybersecurity has become a buying criterion after average breach costs reached CAD 6.32 million in 2024, giving vendors with built-in zero-trust frameworks a procurement edge.
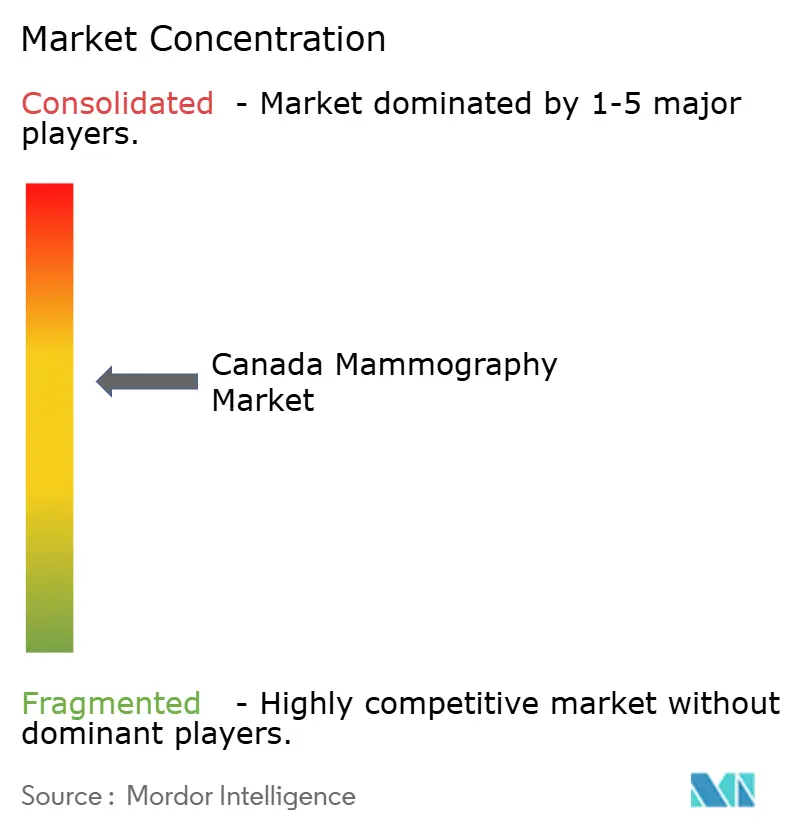
Grouped-purchase tenders tighten entry barriers for small manufacturers lacking pan-Canadian service. As procurement shifts to bundled service economics, incumbents strengthen lock-in, sustaining moderate concentration inside the Canada mammography market.
Canada Mammography Industry Leaders
-
Hologic Inc.
-
Planmed OY
-
GE HealthCare Technologies Inc.
-
Fujifilm Holdings Corporation
-
Siemens Healthineers AG
- *Disclaimer: Major Players sorted in no particular order
Market Opportunities and Future Outlook
A key opportunity sits where provincial capacity expansion meets productivity tooling that reduces radiologist and technologist bottlenecks. Procurement behavior in Canada also creates room for vendors and integrators that can win centralized frameworks and then deliver multi-site rollouts with standardized service levels, cybersecurity controls, and interoperability, supported by long-horizon enterprise imaging contracts such as Quebec’s 12-year, CAD 405.5 million Sectra agreement linking multiple sites and supporting remote reading.
The technology mix opportunity is shifting toward integrated pathways rather than single modalities, particularly combining 3D mammography (tomosynthesis) with contrast-enhanced mammography and breast biopsy workflows to reduce recalls and compress diagnostic work-ups into fewer visits. On the supply side, domestic value-add is increasingly centered on AI image analysis and workflow integration layered onto imported mammography platforms, aligning with federal AI grant activity and Health Canada licensing that enables newer systems (for example, Siemens Healthineers MAMMOMAT B.brilliant) to enter Canadian tenders where 3D readiness and embedded algorithm requirements appear more frequently in RFP specifications.
Recent Industry Developments
- July 2026: Sectra signed a multi-year cloud services agreement to provide the Sectra One Cloud radiology and mammography solution at Hennick Humber Hospital. The deal expands cloud-based imaging for mammography across a major Canadian hospital network. It supports cross-site diagnostic workflows and strengthens enterprise imaging across Hennick Humber Hospital.
- July 2026: Comox Valley Healthcare Foundation, CIBC grant of 15,000 for a new mammography unit at Comox Valley Hospital. Comox Valley Hospital received a CIBC grant of 15,000 to fund a new mammography unit. The funding expands regional screening capacity in British Columbia and improves access for underserved communities.
- June 2026: Collingwood General and Marine Hospital doubled its mammography capacity by adding a second mammography suite. The plan to introduce contrast-enhanced mammography by fall 2026 strengthens provincial capacity and reduces wait times.
Research Methodology Framework and Report Scope
Market Definition and Coverage
This market covers the value of mammography systems and related upgrades sold in Canada for breast screening and diagnostic use across healthcare settings, with sizing expressed in current US dollars. Our view follows purchase and replacement activity tied to imaging capacity and screening demand.
Scope exclusions: The estimate excludes biopsy devices, general ultrasound and MRI systems, contrast agents, and interpretation-only service revenue that is not bundled with equipment purchases.
Segmentation Overview
- By Technology
- Analog Film Mammography
- Full-Field Digital Mammography (2D)
- Digital Breast Tomosynthesis (3D)
- Contrast-Enhanced Spectral Mammography
- AI-Assisted 3D Mammography Platforms
- By End User
- Hospitals & Surgical Centres
- Dedicated Breast Screening Centres
- Diagnostic Imaging Centres
- Mobile Screening Units
- Ambulatory Care & Specialty Clinics
Data Sources, Market Sizing, and Validation
Desk Research
Desk work started with mapping demand for screening and diagnostic throughput, then translating that into how many systems need to be installed and refreshed. Public sources were used to ground the assumptions, such as Statistics Canada population and age distribution tables, Canadian Cancer Society incidence and screening context, and guidance and evidence reviews from bodies such as the Canadian Task Force on Preventive Health Care.
We also reviewed provincial program pages and public hospital reporting where available, since these sources help explain how screening volume shifts by province and over time. Equipment adoption signals were cross-checked using peer-reviewed radiology journals, and government procurement and tender notices, and then supported with company filings and investor presentations for broader product cycle context. For some steps, paid subscriptions were used for company financials and intelligence, patent lookups, and shipment-level import export checks to validate timing and mix changes. The sources listed here are illustrative only, and many other public documents and datasets were also used to collect, verify, and clarify data points.
Primary Interviews and Surveys
Primary work focused on confirming what drives purchasing in Canada and how utilization differs between screening programs and diagnostic referrals, since these details are not fully visible in public datasets. We spoke with a mix of imaging leaders, biomedical procurement roles, radiology operations managers, and channel-side experts across major provinces. The feedback was used to pressure-test pricing, replacement cycles, and the pace of 2D to 3D shifts.
To keep estimates realistic, assumptions were revisited when interview inputs conflicted with desk indicators such as tender activity, installed base discussions, and reported screening participation patterns, and then the model was adjusted before final sign-off.
Distribution of primary research fieldwork respondents
| Company type | Respondent position |
|---|---|
| Top tier: 37% | CXOs: 14% |
| Mid tier: 44% | Functional/Unit leaders: 30% |
| Smaller Players: 19% | Managers: 56% |
Market-Sizing & Forecasting
Sizing was built using a top-down approach where the screening-eligible population, participation patterns, and imaging capacity signals are converted into an equipment demand pool. We then translated that pool into annual purchase value using realistic pricing and upgrade timing. The totals were subsequently checked using selective bottom-up approximations, such as supplier and channel sense checks, sampled average selling price by system type, and tender-based deal spotting, which helped correct gaps where unit visibility is limited.
Key inputs used in the model included the screening-age female population trend, expected exam volume per system per year (utilization), replacement cycle assumptions by installed base age, and the adoption rate of full-field digital and digital breast tomosynthesis versus analog. We also used typical price spreads between 2D and 3D configurations, including service and software that is commonly purchased with equipment. Forecasting was done using scenario analysis supported by simple regression checks, where drivers such as an aging population, a technology mix shift, and public screening program intensity were varied within ranges interviewees considered workable. When a bottom-up check was incomplete for a province or facility type, the missing part was handled using proxy penetration rates tied to population and known program coverage, and then adjusted after validation discussions.
Data Validation & Update Cycle
Outputs were triangulated across multiple views, including demand-side signals such as screening participation and cancer incidence context, and supply-side signals such as procurement activity, product cycle timing, and pricing bands. Outliers were flagged when implied unit demand or spending per system moved too sharply versus known replacement behavior, and then assumptions were reviewed in a second analyst pass before the estimate was finalized.
We also re-contacted sources when the model indicated a step change in pricing, mix, or replacement cadence that could not be explained by public information. Reports are refreshed annually, and interim updates are made when material events occur, such as major policy changes, new technology launches that shift average selling prices, or procurement cycles that meaningfully alter near-term demand. Before delivery, a final check is completed so clients receive the most current view available.
Mordor Intelligence's Canada Mammography Market Size Compared With Other Published Estimates
Published values for Canada mammography can look different across sources because the included revenue streams and the cut of the market are not always aligned, even when the topic label sounds the same. Differences most often come from what is counted as mammography revenue, how the 2D versus 3D mix is priced, and whether the sizing is anchored to installed base replacement or to broader diagnostic imaging spending.
The biggest gap driver is whether screening and diagnostic mammography are limited to equipment and attached upgrades only. In that narrower framing, Mordor Intelligence counts value using system mix and replacement timing rather than folding in imaging services or adjacent breast imaging modalities. Some estimates also assume faster 3D conversion and higher average selling prices without a clear check against tender awards, while others use older currency conversion timing and do not refresh assumptions when provincial program capacity changes.
Benchmark comparison
| Source | Market Size | Gaps in Research Methodology |
|---|---|---|
| Mordor Intelligence | USD 113.03 M (2025) | |
| Industry Association A | USD 98.00 M (2025) | Often reflects a narrower view that emphasizes screening program procurement only, which can undercount diagnostic-center and mobile unit demand and may apply conservative replacement timing for older systems. |
| Trade Journal B | USD 140.00 M (2025) | Tends to blend equipment with service and software revenue, and may assume rapid 3D adoption with higher price points without consistently reconciling against Canada-specific tender pricing and system refresh cycles. |
The spread across the table is mainly explained by what gets included in the spend and how quickly the model moves the market from 2D to 3D. By tying the totals to observable demand signals and repeatable purchase drivers, the approach stays easier to audit, and it reduces swings caused by mixed scopes or aggressive price assumptions.
Key Questions Answered in the Report
How fast is Canada’s mammography segment expected to grow through 2031?
The market is forecast to climb from USD 0.12 billion in 2026 to USD 0.18 billion by 2031, reflecting a 7.91% CAGR over 2026-2031.
Which provinces lowered the routine breast-screening start age to 40?
Ontario, Manitoba, Saskatchewan, Newfoundland and Labrador, British Columbia and Nova Scotia implemented the age-40 threshold during 2024-2025.
What share of systems did 2D digital mammography hold in 2025?
Full-Field Digital Mammography accounted for 61.83% of installed value in 2025.
How are mobile units addressing rural and Indigenous screening gaps?
Provinces such as Saskatchewan fund direct-radiography vans with satellite image transfer; Saskatchewan’s first two units logged 340 exams in four weeks—28% above projection—by rotating through 42 communities.
Why are AI-assisted 3D platforms gaining traction?
Health Canada’s 2024 clearance of Genius AI Detection and provincial RFPs that now demand embedded algorithms are pushing hospitals toward 3D systems that cut reading time by around 15-20%.