
Market Overview
| Study Period | 2020 - 2031 |
|---|---|
| Forecast Data Period | 2026 - 2031 |
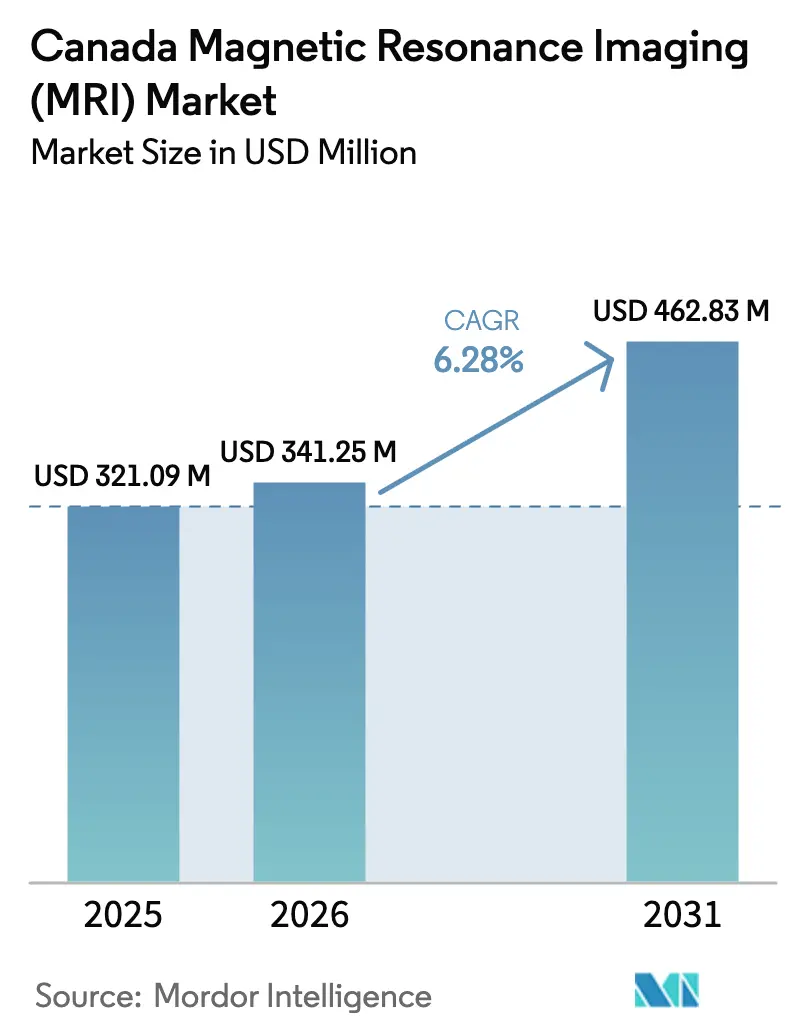
| Base Year Market Size (2025) | USD 321.09 Million |
| Market Size (2026) | USD 341.25 Million |
| Market Size (2031) | USD 462.83 Million |
| Growth Rate (2026 - 2031) | 6.28 % |
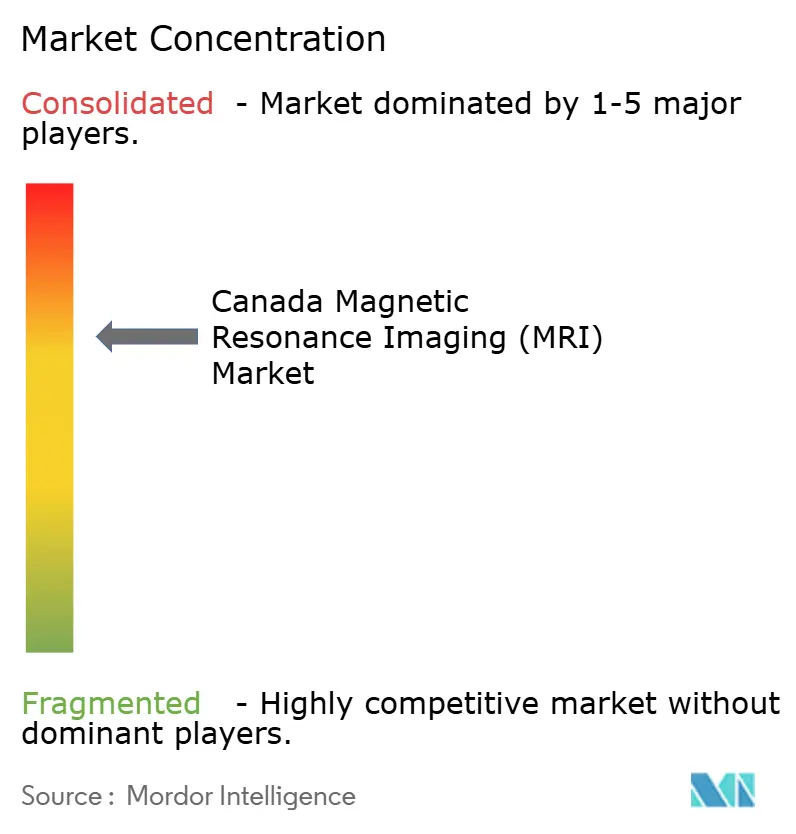
| Market Concentration | Medium |
Major Players *Disclaimer: Major Players sorted in no particular order Image © Mordor Intelligence. Reuse requires attribution under CC BY 4.0. | |
Canada Magnetic Resonance Imaging (MRI) Market Analysis by Mordor Intelligence
The Canada Magnetic Resonance Imaging (MRI) market size in 2026 is estimated at USD 341.25 million, growing from 2025 value of USD 321.09 million with 2031 projections showing USD 462.83 million, growing at 6.28% CAGR over 2026-2031. Consistent demand for high-field scanners, government programs that cut imaging backlogs, and rapid breakthroughs in portable, helium-free platforms are steering growth patterns. Vendors that integrate quantum-enhanced detectors and machine-learning reconstruction now differentiate on diagnostic speed rather than magnet power alone, while outpatient providers use these capabilities to win volumes once locked inside hospitals. Realignment of the supply base toward domestic magnet fabrication and alternative cooling technologies further reduces procurement risk and broadens geographic participation. Overall, investment in bedside imaging, ultra-high-field research scanners, and AI-enabled workflow tools collectively reinforce a healthy five-year expansion trajectory for the MRI systems market.
Key Report Takeaways
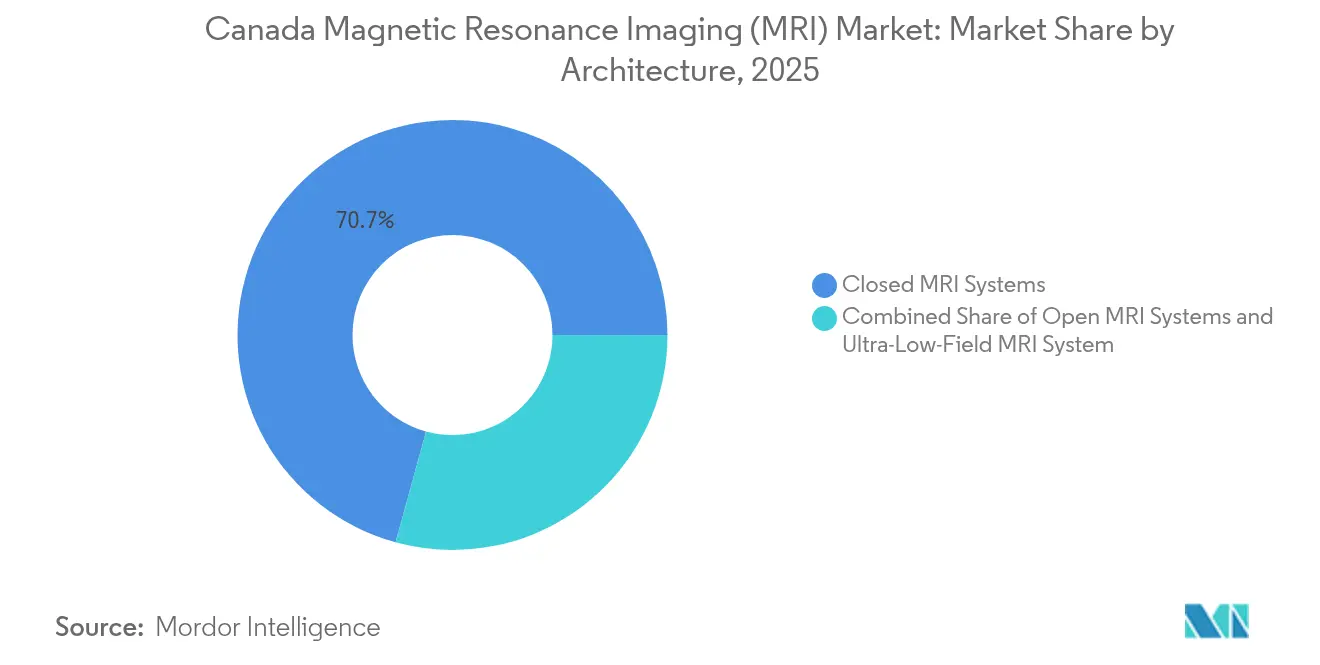
- By architecture, closed scanners held 70.74% of Canada Magnetic Resonance Imaging (MRI) market share in 2025, whereas portable and ultra-low-field devices are forecast to grow at 6.78% CAGR through 2031.
- By field strength, 1.5 T platforms retained 44.76% share of the Canada Magnetic Resonance Imaging (MRI) market size in 2025, while 7 T systems record the fastest 7.12% CAGR to 2031.
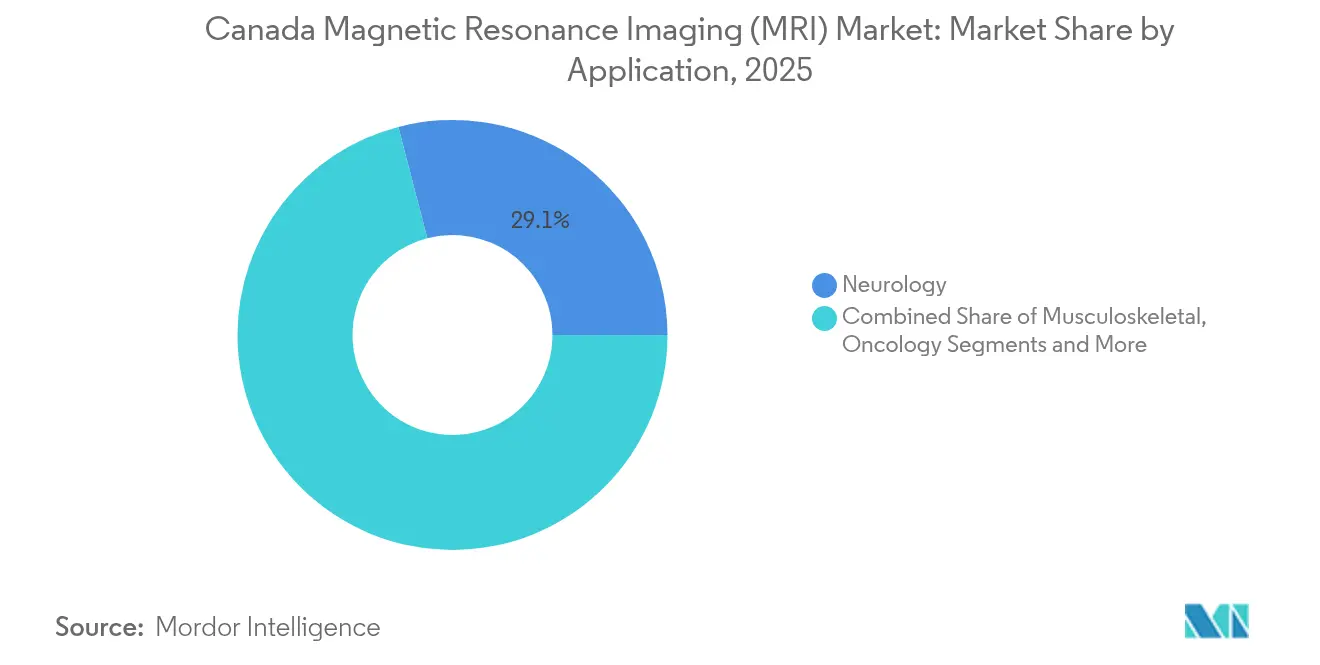
- By application, neurology contributed 29.05% revenue in 2025; oncology is poised for a 7.68% CAGR across the same horizon.
- By end user, hospitals controlled 61.72% share in 2025, yet diagnostic imaging centers expand at 7.02% CAGR through 2031.
Note: Market size and forecast figures in this report are generated using Mordor Intelligence’s proprietary estimation framework, updated with the latest available data and insights as of 2026.
Canada Magnetic Resonance Imaging (MRI) Market Trends and Insights
Drivers Impact Analysis*
| Driver | (~) % Impact on CAGR Forecast | Geographic Relevance | Impact Timeline |
|---|---|---|---|
| Growing burden of chronic diseases | +1.2% | Global; greatest in North America and Europe | Long term (≥ 4 years) |
| Aging population and rising imaging referrals | +0.9% | North America, Europe, Japan | Long term (≥ 4 years) |
| Government funding to cut MRI wait-times | +0.8% | Canada, United Kingdom, Australia, Nordics | Medium term (2–4 years) |
| Technological advancement of MRI systems | +1.1% | Global, led by North America and Europe | Medium term (2–4 years) |
| Adoption of ultra-low-field portable MRI | +0.7% | Global; early uptake in United States and Europe | Short term (≤ 2 years) |
| Expansion of privately funded imaging clinics | +0.6% | North America; emerging across Asia-Pacific | Medium term (2–4 years) |
| Source: Mordor Intelligence | |||
Growing Burden of Chronic Diseases
Quantum-hyperpolarized MRI amplifies metabolic signals by 100,000-fold, enabling clinicians to map tumor metabolism without radioactive tracers and detect malignancies that conventional imaging misses [1]. Uptake is strongest in oncology centers treating pancreatic and brain cancers, where early identification drives survival odds and reimbursement aligns with improved outcomes. Regulatory agencies in the United States and Europe are adapting approval pathways to accommodate these quantum-enhanced sequences. Hospitals that adopt the technology report higher referral capture, reinforcing long-run demand for premium scanners in the MRI systems market.
Aging Population & Rising Imaging Referrals
The median age in advanced economies surpasses 40 years, raising the incidence of stroke, osteoarthritis, and neurodegenerative diseases. Portable systems cleared for bedside neurological use shorten door-to-scan times, particularly for stroke triage in emergency units. Point-of-care imaging also supports geriatric care in long-term facilities that lack room for conventional suites. These access gains translate into higher annual scan volumes, a positive demand loop for the MRI systems market.
Government Funding to Cut MRI Wait-Times
Ontario allocated USD 70 million for helium-free systems, while British Columbia set a 50% wait-time reduction target through fresh installations and service contracts. These programs favor vendors offering low-maintenance magnets and long-term uptime guarantees. Framework tenders covering training and service escalate near-term order pipelines and create predictable revenue across the forecast period for the MRI systems market.
Technological Advancement of MRI Systems
Quantum diamond sensors demonstrated spatial resolution down to ten millionths of a meter, opening cellular-level imaging for pharmaceutical research [2]. At the same time, deep-learning reconstruction slashes scan durations from 45 minutes to five without losing diagnostic value. Vendors package these algorithms inside workflow dashboards that auto-route images to subspecialty radiologists, expanding throughput and boosting the economic case for premium models in the MRI systems market.
Adoption of Ultra-Low-Field Portable MRI
FDA-cleared bedside scanners eliminate magnetic shielding, three-phase power, and helium, lowering installed cost by nearly 70% versus fixed rooms. Clinical studies confirm equivalence for specific neuro exams, strengthening confidence among stroke neurologists and ICU teams. Early adopters cite faster throughput and new revenue streams from rural outreach programs, supporting accelerated penetration of portable devices.
Expansion of Privately Funded Imaging Clinics
Private equity–backed chains keep acquiring community centers and layering AI triage software that maximizes asset utilization. RadNet’s USD 103 million purchase of iCAD aligned mammography AI with its multi-state MRI network, enabling same-day scans and rapid reads for self-pay consumers. Growth of these outpatient networks lifts aggregate system demand and reshapes referral patterns within the MRI systems market.
Restraints Impact Analysis*
| Restraint | (~) % Impact on CAGR Forecast | Geographic Relevance | Impact Timeline |
|---|---|---|---|
| High capital and operating cost of MRI suites | −1.8% | Global; most acute in emerging economies | Long term (≥ 4 years) |
| Helium supply constraints and price volatility | −1.1% | Global; variable regional access | Medium term (2–4 years) |
| Shortage of MRI technologists and radiologists | −0.9% | North America, Europe; spreading to Asia-Pacific | Long term (≥ 4 years) |
| Limited public reimbursement for advanced sequences | −0.7% | North America, selective European markets | Medium term (2–4 years) |
| Source: Mordor Intelligence | |||
High Capital & Operating Cost of MRI Suites
Full-service installations exceed USD 1 million and require specialized shielding, uninterruptible power, and trained staff. Scanner density in low-income nations remained below 2 units per million population in 2024, underscoring affordability gaps. Leasing and shared-service models partially offset barriers, but life-cycle costs still deter small hospitals and dampen adoption within the MRI systems market.
Helium Supply Constraints & Price Volatility
Periodic shortages pushed helium prices up more than 50% between 2017 and 2025, creating unplanned downtime for facilities that lack recapture systems. Vendors now prioritize cryogen-light or helium-free magnets; however, premium list prices can delay procurement in budget-sensitive regions. Until supply stabilizes, uncertainty restrains capital allocation for new scanners and upgrades.
*Our forecasts treat driver/restraint impacts as directional, not additive. The impact forecasts reflect baseline growth, mix effects, and variable interactions.
Segment Analysis
By Architecture: Closed Systems Reign While Portables Surge
Closed platforms delivered 70.74% revenue in 2025 because surgeons and oncologists rely on their high-signal-to-noise images for complex cases. Facilities appreciate the wide coil ecosystem and mature service networks that keep downtime minimal. Yet the portable wave is undeniable: ultra-low-field units post a 6.78% CAGR as emergency departments, trauma centers, and rural hospitals embrace bedside exams that circumvent transport and queuing delays. Vendors consult architects on shielding-lite rooms that streamline upgrades, helping maintain closed-system dominance in the MRI systems market.
The portable niche unlocks entirely new points of care. Hyperfine’s rolling cart design fits into tight spaces, operates on standard power, and never vents helium. Outcome studies document faster stroke decision-making, which feeds into favorable reimbursement and grants. As clinical evidence expands to musculoskeletal and pediatric use, the segment’s contribution to MRI systems market size will accelerate, though it is unlikely to overtake closed installations in the near term.

By Field Strength: Mid-Range Stability Meets Ultra-High Ambition
At 44.76% share, 1.5 T remains the workhorse because protocols, implants, and radiologist training center on this field. Hospital PACS and contrast media are optimized for its signal profile, preserving a stable installed base across regions. Meanwhile, 7 T delivers the highest growth at 7.12% CAGR, as FDA clearance for clinical neuro scans moves the magnet from research labs into tertiary centers. Price tags hover at USD 10 million, but grant funding and philanthropic gifts help absorb the premium.
3 T models address applications where higher resolution materially alters care pathways, notably epilepsy surgery planning and cardiac tissue characterization. Vendors that supply both mid- and ultra-high-field lines can upsell within their service contracts, ensuring annuity streams even as MRI systems market share remains weighted toward 1.5 T.
By Application: Neurology Leads; Oncology Climbs Fast
Neurology’s 29.05% slice stems from MRI’s unmatched ability to visualize gray-matter architecture, white-matter tracts, and perfusion patterns without ionizing radiation. Functional and diffusion sequences aid diagnosis of stroke, multiple sclerosis, and traumatic injury, sustaining routine use. Oncology, however, clocks a 7.68% CAGR as metabolic and quantitative imaging spread from academic trials to mainstream practice. Hyperpolarized agents now monitor tumor response days after therapy begins, allowing faster protocol adjustments.
Musculoskeletal exams gain momentum from sports injury surveillance, whereas cardiology scans benefit from newer compressed-sensing techniques that eliminate breath holds. Each subfield pushes vendors to refine coils, software, and table ergonomics, enlarging the collective MRI systems market size.
By End User: Hospitals Dominate but Outpatient Centers Accelerate
Hospitals still capture 61.72% spending because they manage trauma pathways, intensive care, and surgical staging that require immediate on-site imaging. Their budgets also absorb the capital and facility modifications necessary for high-field magnets. The MRI systems market nevertheless tilts toward outpatient chains, which post 7.02% CAGR by delivering same-day slots and transparent self-pay prices.
Investors consolidate stand-alone sites into regional brands equipped with standardized scanners and AI decision support. Shorter report turnarounds and patient-friendly scheduling draw referring physicians away from congested hospitals. Mobile fleets further extend reach to employer campuses and assisted-living facilities, broadening the end-user base.
Geography Analysis
Provincial health plans are pushing Canada’s MRI market forward by tying new funding to shorter patient queues. Ontario, for instance, set aside USD 70 million to add scanners, while British Columbia is expanding sites and staff in a bid to halve MRI wait-times by 2030. Because helium supplies are unpredictable, many tenders now specify “helium-free” magnets, a requirement that gives Siemens Magnetom Flow and GE Freelium an edge in competitive bids.
Canada’s publicly funded system creates steady replacement cycles, yet tight budgets mean vendors must prove lower lifetime costs, not just a low sticker price. Regional needs also differ: Ontario and Quebec host the highest scanner counts, whereas western provinces often rely on mobile or shared units to serve patients scattered across large rural areas.
Health Canada’s device rules mirror many FDA standards, so companies with U.S. clearances can enter quickly, though post-market reporting requirements remain uniquely Canadian. Hospitals looking to meet strict wait-time targets are choosing high-throughput models with built-in AI that speeds exams without adding staff. British Columbia, for example, is placing scanners where demand is highest and extending operating hours, favoring vendors that bundle strong service contracts and remote monitoring to keep machines running around the clock.
Regulatory Landscape
In Canada, MRI devices and related software are regulated by Health Canada under the Food and Drugs Act and Medical Devices Regulations (SOR/98-282). Licences are required for Class II, III, and IV devices prior to import or sale, and licence applications rely on a quality management system certification to CAN/CSA-ISO 13485 for higher-risk devices.
Regulatory changes that affect safety claims or scan conditions trigger pre-market review. Manufacturers and importers must report medical device shortages and discontinuations within 30 days of becoming aware. Inspections and establishment licensing are handled by the Regulatory Operations and Enforcement Branch of Health Canada.
Value Chain Analysis
The Canada medical device trade is closely linked to the United States. In 2024, the U.S. accounted for 73 percent of exports and 42 percent of imports, underscoring how much the sector depends on cross-border component sourcing.
The supply base draws on global chains for critical sub-components such as microprocessors, while domestic manufacturing supports items like PPE and surgical instruments. Group purchasing organizations (GPOs) are used by health agencies to consolidate bargaining power and negotiate prices for diagnostic equipment and technology, and HS code 90 category imports accounted for about 53.6 percent of sector imports in 2023.
Competitive Landscape
The MRI systems market hosts a solid core of three multinationals—GE Healthcare, Siemens Healthineers, and Philips—who collectively oversee extensive manufacturing, software, and service engines. Their combined R&D spending tops USD 3 billion annually, fueling rapid iteration in coils, gradient amplifiers, and reconstruction AI. Each has introduced helium-light or zero-boil-off platforms to cushion against commodity swings and align with sustainability mandates. Market entrants such as Canon Medical, United Imaging, and Neusoft Medical Systems differentiate through aggressive pricing, local-language interfaces, and flexible financing.
Strategic cooperation now centers on software ecosystems. Siemens paid USD 150 million to extend U.S. magnet coil production and committed GBP 250 million to a U.K. AI hub, ensuring prompt firmware rollouts and regional service backing [3]. GE bundles its Edison AI platform across modalities, facilitating cross-learning between CT and MRI for unified reporting. Portable specialist Hyperfine leverages a cloud-hosted AI suite that automatically centers brain scans and uploads data for neurologist review, positioning it as a disruptor within the MRI systems market.
M&A remains active: RadNet’s acquisition of iCAD folded breast-imaging AI into its national center network, while Function Health absorbed Ezra to marry preventive screening subscriptions with rapid MRI access. Suppliers also pursue joint research agreements; Philips collaborates with the Technical University of Munich on hyperpolarized agents, accelerating translation to clinic. These maneuvers consolidate capability and lock in service revenues, yet room persists for niche innovators in coils, quiet gradient technology, and photon-counting detection to carve profitable segments.
Canada Magnetic Resonance Imaging (MRI) Industry Leaders
-
GE Healthcare
-
FUJIFILM Holdings Corporation
-
Koninklijke Philips N.V.
-
Canon (Canon Medical Systems)
-
Siemens Healthineers
- *Disclaimer: Major Players sorted in no particular order
Market Opportunities and Future Outlook
Clinical integration of machine learning enabled medical devices (MLMD) with predetermined change control plans (PCCP) is emerging as a workable approach to manage model drift risk. In Canada, R&D is also focused on integrating AI, biotechnology, and advanced manufacturing to meet aging population-driven diagnostic needs.
Digital platform implementations can streamline supply chain planning, improve delivery models, and reduce volume requirements for medical devices. In parallel, at-home manufacturing capacity expansion for certain high-demand components complements global sourcing for complex sub-components like microprocessors. Health Canada clearances for ML-enabled features, including the Subtle Medical SubtleHD workflow, provide concrete proof points for regulatory-validated AI adoption.
Recent Industry Developments
- May 2026: Philips announces Titanion MR expands ultra-high-gradient MRI capabilities at ISMRM 2026. The system enables whole-body quantitative biomarkers and broadens measurement capabilities. The launch strengthens Philips positioning in high-end MRI and expands its application reach.
- May 2026: GE HealthCare announces SIGNA Bolt 3T MRI advancements at ISMRM 2026. The platform enhancements target fast, AI assisted imaging workflows and integrated software services. The development reinforces GE HealthCare's leadership in fast, high performance MRI ecosystems.
- March 2026: Siemens Healthineers / SDI Canada announces Saskatchewan’s first modular MRI Cassette installed at St. Joseph’s Hospital, Estevan (MAGNETOM Flow.Elite 1.5T). The modular cassette deployment accelerates deployment, supports remote northern access, and expands modular infrastructure ecosystem.
Research Methodology Framework and Report Scope
Market Definition and Coverage
This market covers revenues generated from MRI systems sold and installed in Canada across care settings, including upgrades and replacements that are directly tied to MRI scanner platforms used for clinical and research imaging.
Scope exclusions: standalone imaging services revenue, contrast agents, and most site-only construction work are excluded unless they are bundled into an MRI system purchase contract.
Segmentation Overview
- By Architecture
- Closed MRI Systems
- Open MRI Systems
- Portable / Ultra-Low-Field MRI Systems
- By Field Strength
- Low-Field (< 0.5 T)
- Mid-Field (0.5–1.4 T)
- High-Field (1.5 T)
- Very-High-Field (3 T)
- Ultra-High-Field (7 T)
- By Application
- Neurology
- Oncology
- Musculoskeletal
- Cardiology
- Gastroenterology & Hepatobiliary
- Other Applications
- By End User
- Hospitals
- Diagnostic Imaging Centres
- Others
Data Sources, Market Sizing, and Validation
Desk Research
Desk work starts by setting a consistent Canada-only revenue boundary and then mapping demand-side signals that explain scanner purchases and replacements. We typically refer to public sources such as Statistics Canada (health spending and workforce context), the Canadian Institute for Health Information (system capacity signals), and Health Canada (device and safety context), which helps keep assumptions grounded.
To size the market more cleanly, secondary inputs are also collected from sources such as provincial health ministry budget documents, hospital and imaging network annual reports, tender notices, and peer reviewed clinical journals that point to utilization pressure and technology shifts. Where needed, paid subscriptions for company financials and intelligence, patent databases, import-export shipment level records, and global contracts and tenders are used to cross-check supplier activity and purchasing cycles. The sources listed here are illustrative only, and many other public and paid references are also used for data collection, clarification, and validation.
Primary Interviews and Surveys
Primary work is used to turn broad signals into usable inputs, mainly by discussing pricing ranges, replacement cadence, procurement lead times, and the mix shift across closed, open, and portable systems. We engage with a balanced set of respondents, including imaging department leaders, procurement teams, independent imaging operators, and service partners across Canada, to confirm what is being bought and why, and then to pressure-test the model outputs.
Distribution of primary research fieldwork respondents
| Company type | Respondent position |
|---|---|
| Top tier: 34% | CXOs: 14% |
| Mid tier: 49% | Functional/Unit leaders: 36% |
| Smaller Players: 17% | Managers: 50% |
Market-Sizing & Forecasting
Sizing is built from a top-down Canada demand pool assessment, where installed base signals and procurement budgets are reconstructed into annual system spending, then filtered through typical replacement and upgrade cycles. Once that total is formed, selective bottom-up checks are applied using sampled ASP ranges by field strength, a few supplier shipment cues, and channel checks with buyers to ensure totals do not drift away from purchasing reality.
Inputs that most often move the model include the active scanner base and retirement timing, waitlist pressure and throughput expectations, the share shift toward high-field systems, funding programs that target diagnostic backlogs, and procurement timing for multi-year hospital projects. Forecasting is handled through scenario analysis supported by expert views on funding continuity and delivery constraints, then adjusted with near-term procurement pipelines where visibility is stronger. Where bottom-up coverage is patchy, gaps are filled using conservative penetration ranges anchored to similar facility types, and then rechecked in follow-up calls.
Data Validation & Update Cycle
Validation is handled by comparing the model against independent market signals, such as public procurement activity, installed base trends, and reported capacity expansion plans. If a variance looks unusual, assumptions are revisited, outliers are challenged, and respondents may be re-contacted to confirm whether the shift is real or timing related.
Before sign-off, the work is reviewed in multiple steps so calculations, currency treatment, and year mapping are consistent across sections. Reports are refreshed annually, and interim updates are made when material events occur, such as policy funding changes or major procurement waves. Right before delivery, an analyst performs a final pass so clients receive the latest updated view.
Mordor Intelligence's Canada Magnetic Resonance Imaging Mri Market Size Compared Against Other Published Estimates
Published market sizes for Canada MRI often differ because each publisher draws the line around what counts as revenue and which year is treated as the current sizing point. Differences also show up when one estimate leans more on shipment assumptions, while another leans more on hospital budget signals, which can move totals in different directions.
Service-only maintenance contracts and imaging procedure revenues sit outside Mordor Intelligence's scope here, which is a common reason other figures look larger when they roll in services, contrast workflow, or broader diagnostic imaging baskets. Gaps also come from how ASP changes are handled (flat pricing versus mix-driven pricing), how replacement cycles are timed across provinces, and how quickly the model is refreshed after procurement announcements and funding updates.
Benchmark comparison
| Source | Market Size | Gaps in Research Methodology |
|---|---|---|
| Mordor Intelligence | USD 341.25 M (2026) | |
| Industry Association A | USD 410.00 M (2026) | Often treated as a broader diagnostic imaging spend bucket, which can pull in service revenue, facility upgrades, and non-MRI modalities, and then apply a blended growth rate. |
| Global Consultancy B | USD 295.00 M (2025) | Usually anchored to a narrower equipment-only shipment view with limited adjustment for multi-year public procurements, and it can lag mix shifts toward higher-field systems and upgrades. |
Taken together, the spread mostly reflects scope and timing, not a single right or wrong number. By keeping the definition tied to MRI system revenues and then cross-checking totals against procurement cadence, installed base signals, and realistic ASP ranges, the estimate stays traceable to practical inputs that can be re-tested year after year.
Key Questions Answered in the Report
What is the current Canada Magnetic Resonance Imaging (MRI) Market size?
The MRI systems market is estimated at USD 341.25 million in 2026 and is forecast to reach USD 462.83 million in 2031.
Who are the key players in Canada Magnetic Resonance Imaging (MRI) Market?
GE Healthcare, FUJIFILM Holdings Corporation, Koninklijke Philips N.V., Canon (Canon Medical Systems) and Siemens Healthineers are the major companies operating in the Canada Magnetic Resonance Imaging (MRI) Market.
Which MRI architecture is growing the fastest?
Portable and ultra-low-field devices are projected to grow at 6.78% CAGR through 2031.
Why are ultra-high-field 7 T scanners gaining attention?
7 T platforms deliver superior neuro-vascular resolution and are expanding from research settings into clinical use, driving a 7.12% CAGR.