
Market Overview
| Study Period | 2020 - 2031 |
|---|---|
| Forecast Data Period | 2026 - 2031 |
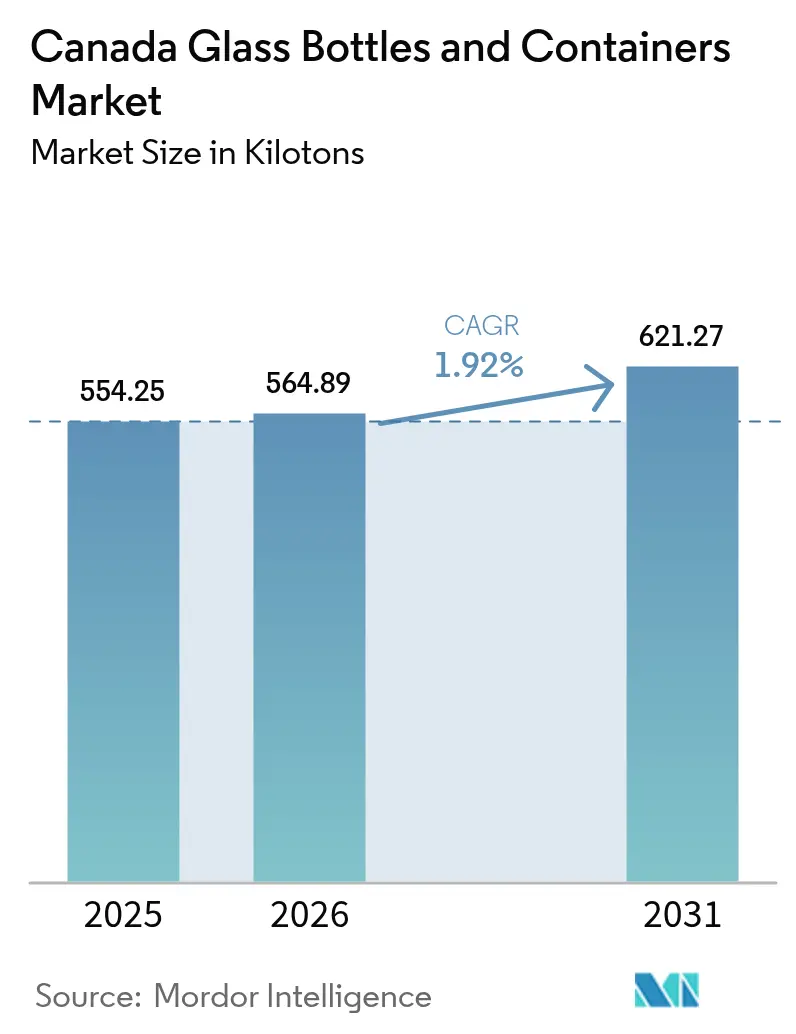
| Base Year Market Size (2025) | 554.25 kilotons |
| Market Volume (2026) | 564.89 kilotons |
| Market Volume (2031) | 621.27 kilotons |
| Growth Rate (2026 - 2031) | 1.92 % |
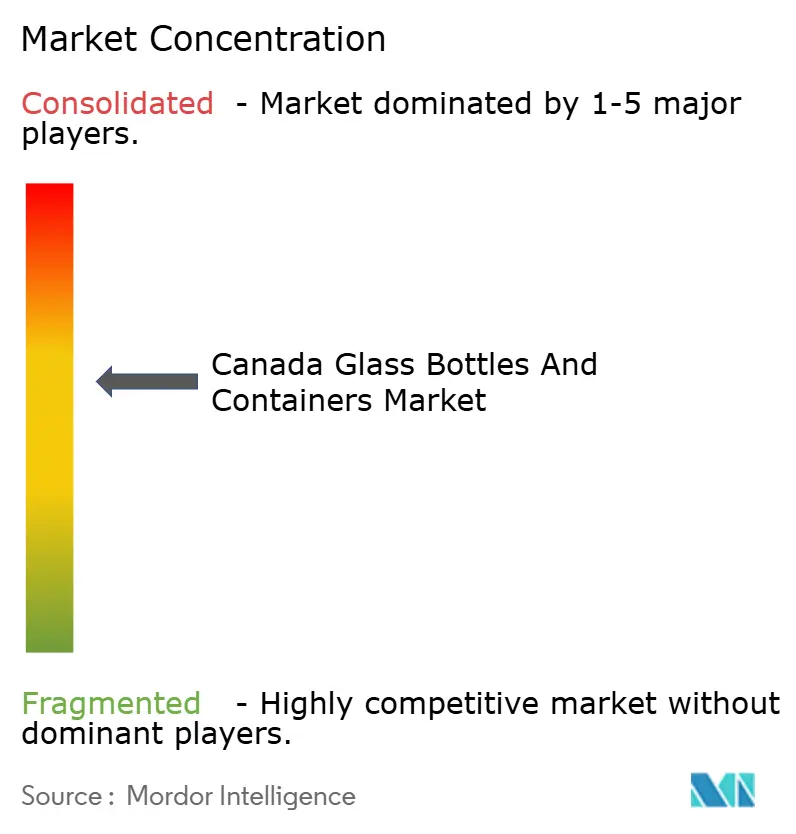
| Market Concentration | Medium |
Major Players *Disclaimer: Major Players sorted in no particular order Image © Mordor Intelligence. Reuse requires attribution under CC BY 4.0. | |
Canada Glass Bottles And Containers Market Analysis by Mordor Intelligence
The Canada glass bottles and containers market size is expected to grow from 554.25 kilotons in 2025 to 564.89 kilotons in 2026 and is forecast to reach 621.27 kilotons by 2031 at 1.92% CAGR over 2026-2031. Demand growth rests on rising provincial recycling mandates, premium-product packaging needs, and incremental furnace-efficiency gains that offset raw-material inflation. Brand owners continue shifting to glass to comply with extended producer responsibility (EPR) rules and to reinforce sustainability narratives that resonate with urban consumers willing to pay a 15–25% packaging premium. Deposit-return expansion in Quebec and British Columbia is tightening closed-loop supply chains, spurring investment in cullet processing even as contamination shortfalls keep roughly 20,000 tonnes of glass out of recycling streams annually. Cost pressures persist: Statistics Canada reported a 4.5% year-to-date hike in producer price indexes for glass manufacturing in 2024, prompting furnace lightweighting and higher cullet ratios to reduce melting energy requirements. Meanwhile, Canada’s Clean Electricity Regulations (CER) compel plants to begin decarbonization planning that favors electric furnaces and renewable-power procurement, reshaping long-term capital-allocation decisions.
Key Report Takeaways
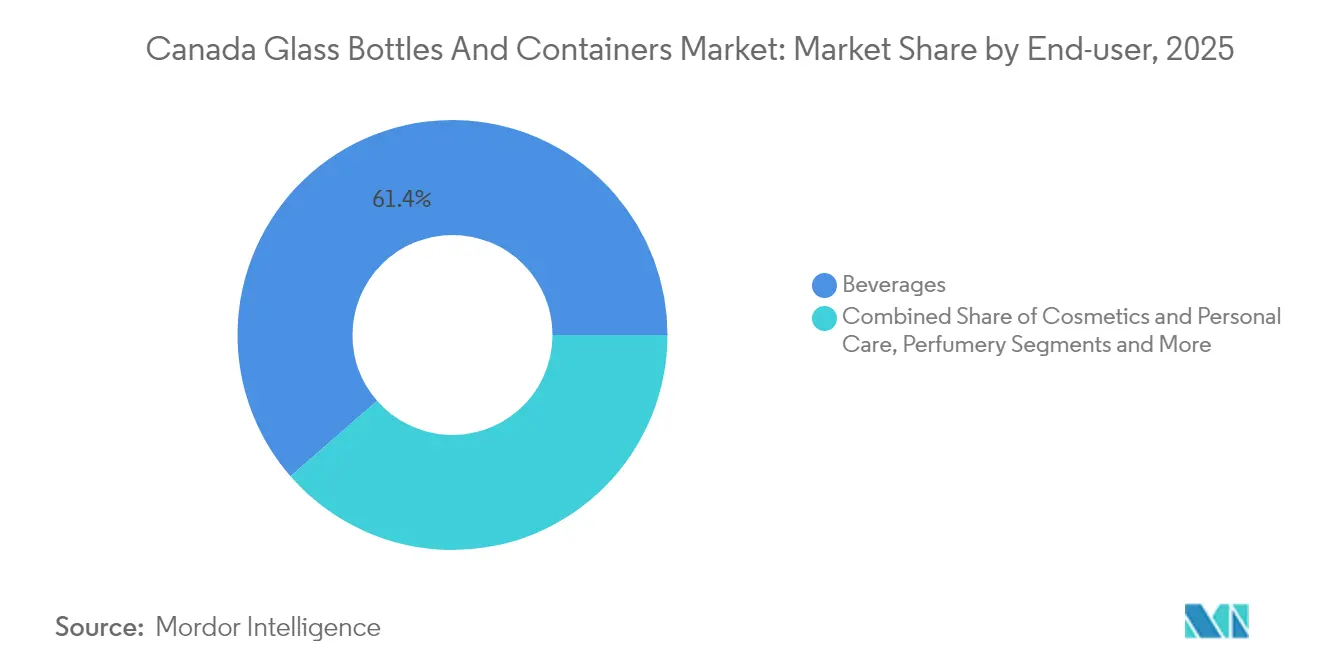
- By end-user, beverages captured 61.42% of the Canada glass bottles and containers market share in 2025.
- By color, the Canada glass bottles and containers market for amber glass is projected to grow at a 2.51% CAGR between 2026-2031.
Note: Market size and forecast figures in this report are generated using Mordor Intelligence’s proprietary estimation framework, updated with the latest available data and insights as of 2026.
Canada Glass Bottles And Containers Market Trends and Insights
Drivers Impact Analysis*
| Driver | (~) % Impact on CAGR Forecast | Geographic Relevance | Impact Timeline |
|---|---|---|---|
| Rising consumer and regulatory pressure for eco-friendly packaging | +0.6% | National, with early gains in Quebec, Ontario, British Columbia | Medium term (2-4 years) |
| Growth in premium beverages and luxury cosmetics | +0.4% | National, concentrated in urban markets | Short term (≤ 2 years) |
| Recyclability and Circular Economy | +0.3% | National, spill-over to export markets | Long term (≥ 4 years) |
| Technological Advancements in Glass Manufacturing | +0.2% | National, focused on major production centers | Medium term (2-4 years) |
| Rise in Craft and Artisanal Product Segments | +0.3% | National, with concentration in Ontario, Quebec, British Columbia | Short term (≤ 2 years) |
| Government Regulations Favoring Glass Packaging | +0.4% | National, with provincial variations | Medium term (2-4 years) |
| Source: Mordor Intelligence | |||
Rising Consumer and Regulatory Pressure for Eco-Friendly Packaging
British Columbia’s 2024 amendment broadening producer liability and the March 2025 Quebec deposit-return expansion have pushed brand owners to accelerate glass adoption across beverages, food, and personal care categories. Surveys show that in major cities, consumers now accept 15–25% price premiums for products in glass rather than plastic without volume declines. The same legislation embeds design-for-recyclability requirements that favor glass, whose infinite recyclability delivers regulatory certainty. Growing EPR targets across Atlantic provinces further ratchet compliance costs for non-recyclable formats, reinforcing glass’s attractiveness. Together these measures underpin steady demand growth for the Canada glass bottles and containers market.
Growth in Premium Beverages and Luxury Cosmetics
Custom mold fees ranging from USD 15,000 to USD 75,000 illustrate how craft distillers and high-end personal-care brands treat glass as a centerpiece of product storytelling. Cosmetics now represent the fastest-growing end-use, expanding at a 2.46% CAGR on the back of Health Canada sealing requirements and consumer perceptions linking glass with formulation purity. Spirits, kombucha, and functional beverages use bespoke bottle geometries and decoration to justify higher shelf prices, shifting competitive focus from volume to design services. This value-added pivot helps buffer producers against commodity price swings while bolstering revenue per ton for the Canada glass bottles and containers market.
Recyclability and Circular Economy Commitments
Large producers have pledged cullet utilization rates far above the North American average. O-I Glass’s 2024 partnerships allow 80–90% recycled content in new containers, versus a regional mean nearer to 35%. Enhanced optical-sorting and AI-vision systems improve color purity and contamination control, lowering furnace energy use by roughly 2-3% for every 10% cullet increment. Government procurement frameworks outlined in PRIMA Québec’s 2035 Roadmap incentivize circular-design specifications, reinforcing end-market demand for high-recycled-content bottles. The outcome is a structural pull on post-consumer glass streams that supports long-run expansion of the Canada glass bottles and containers market.
Technological Advancements in Glass Manufacturing
Early pilots of electric furnaces cut direct CO₂ by about 0.7 t per ton of cullet melted and extend furnace life, positioning adopters for forthcoming CER compliance. Lightweighting initiatives have trimmed bottle mass by 10-15% since 2024, reducing logistics costs while retaining tactile quality. Digital twins and fast-cycle prototyping shorten design timelines for premium segments, letting manufacturers capture higher-margin custom work. These improvements underpin productivity gains and margin resilience for the Canada glass bottles and containers market.
Restraints Impact Analysis*
| Restraint | (~) % Impact on CAGR Forecast | Geographic Relevance | Impact Timeline |
|---|---|---|---|
| Limited Domestic Production Capacity | -0.4% | National, concentrated in Ontario manufacturing centers | Short term (≤ 2 years) |
| High Raw Material and Energy Costs | -0.5% | National, with regional energy cost variations | Medium term (2-4 years) |
| Competition from Alternative Packaging | -0.3% | National, varying by application segment | Long term (≥ 4 years) |
| Fragility and Transportation Risks | -0.2% | National, amplified by geographic distances | Medium term (2-4 years) |
| Source: Mordor Intelligence | |||
Limited Domestic Production Capacity
Only a handful of plants, including O-I Glass in Brampton, Stanpac in Smithville, and Richards Packaging in Maple, cover most national demand, pushing utilization close to nameplate limits during peak seasons. Import dependence for specialty colors and custom runs exposes buyers to U.S. dollar swings and logistics bottlenecks. New furnaces entail USD 180 million–USD 220 million outlays with decade-plus payback horizons, delaying expansion even as premium-segment demand rises. Until new investments materialize, capacity tightness will temper growth for the Canada glass bottles and containers market.
High Raw-Material and Energy Costs
Energy accounts for roughly 17% of finished-glass costs, and 2024 saw a 4.5% spike in producer-price indexes for the sector. Soda ash, silica sand, and limestone price inflation compressed margins because producers could not fully pass through surcharges instantly. As CER drives utilities toward costlier renewable mixes, electricity rates are expected to remain above historical averages, challenging profitability. These dynamics curb near-term momentum in the Canada glass bottles and containers market.
*Our forecasts treat driver/restraint impacts as directional, not additive. The impact forecasts reflect baseline growth, mix effects, and variable interactions.
Segment Analysis
By End-User: Beverages Anchor Volume While Cosmetics Drive Margins
Beverages retained 61.42% of Canada glass bottles and containers market share in 2025, buoyed by entrenched wine and spirits usage and burgeoning craft categories. Cosmetics and personal care, while smaller in tonnage, achieved the fastest 2.33% CAGR and now command premium unit revenues, reflecting stricter hermetic-seal rules under Health Canada and consumer affinity for prestige packaging.
Growth in the beverage segment remains linked to deposit-return expansion and craft innovation, but margin uplift is increasingly tied to high-design cosmetics jars and droppers that leverage decoration and embossing services. Premium juice, kombucha, and functional drinks also shift toward glass to spotlight freshness, reinforcing downstream demand stability for the Canada glass bottles and containers market.


By Color: Flint Dominance Meets Rapid Amber Uptake
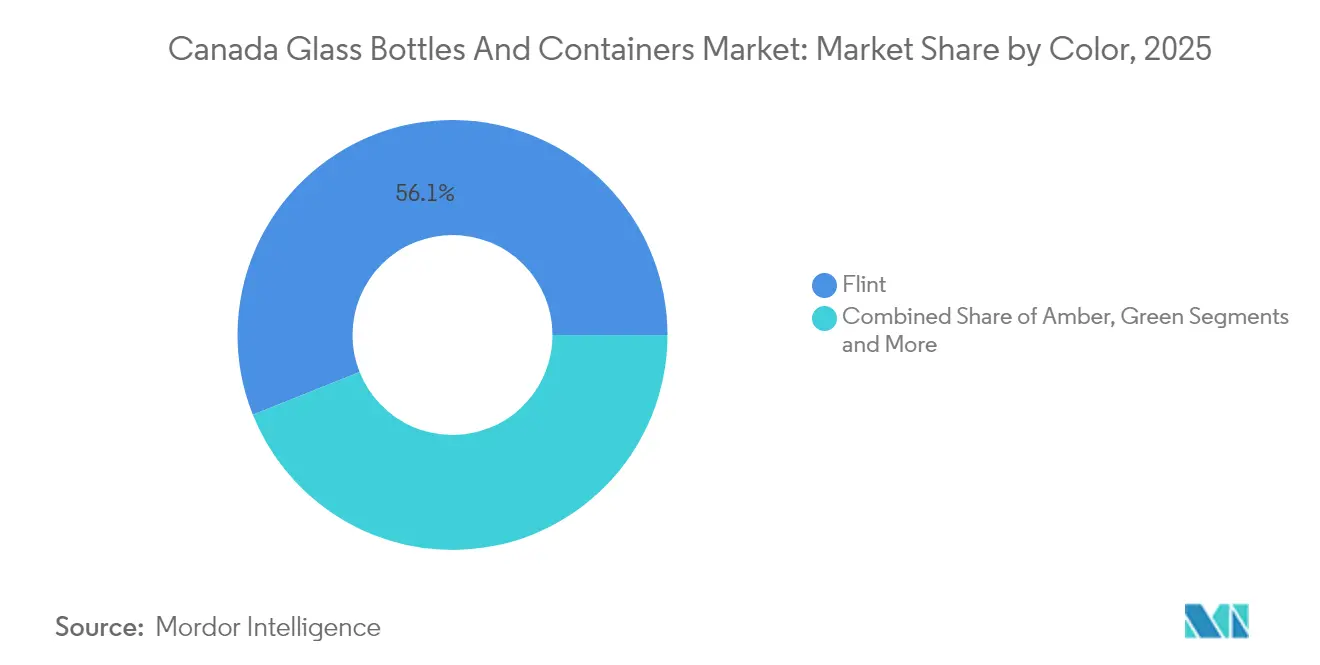
Flint bottles accounted for 56.05% of 2025 volume thanks to universal applicability and easier cullet sorting. Amber containers, favored by craft beer and premium spirits for UV protection, are set to outpace overall demand at a 2.51% CAGR through 2031, signaling design differentiation as a lasting competitive lever.
Investments in small-batch color runs and hybrid coating technologies allow producers to serve niche green, cobalt, and graduated-tint demands without sacrificing recyclability. These advancements widen the addressable opportunity set for the Canada glass bottles and containers market while supporting higher average-selling prices.
Geography Analysis
Ontario and Quebec comprise the manufacturing nucleus and the bulk of demand, underpinned by population density and provincial EPR leadership. O-I’s Brampton hub supplies national beverage fillers clustered in the Greater Toronto Area, lowering freight-to-value ratios.
Quebec’s March 2025 deposit-system overhaul effectively monetizes cullet retrieval, spurring innovation in automated sort lines and pilot traceability apps that may become national blueprints. Western provinces, though smaller, show outsized growth tied to thriving craft beverage ecosystems in Vancouver, Victoria, and Edmonton; lacking local furnaces, these markets depend on inbound rail shipments or U.S. imports.
Atlantic Canada leverages unified EPR frameworks to pool collection volumes, creating scale for cullet processing while port proximity eases export logistics for specialty containers.Collectively, these regional variations keep the Canada glass bottles and containers market firmly oriented around policy shifts and freight economics.
Regulatory Landscape
Canada's regulatory framework for glass bottles and containers combines federal packaging safety and labeling rules with province-led recycling and EPR requirements that influence material choices and end-of-life management. Health Canada oversees the chemical safety of food packaging materials under the Food and Drugs Act and Food and Drug Regulations, including Division 23 provisions intended to prevent harmful substance transfer to food, while the Canadian Food Inspection Agency (CFIA) supports enforcement for food-related compliance.
Product integrity and labeling requirements add further compliance anchors for glass packagers and importers. The Carbonated Beverage Glass Containers Regulations (SOR/2016-166) apply to non-alcoholic carbonated beverage glass containers of 1.5 L or more, requiring shatter-resistance testing plus a documented control and inspection system with test records retained for two years. Labeling oversight is tied to the Consumer Packaging and Labelling Regulations (C.R.C., c. 417), enforced through federal authorities including the Competition Bureau for consumer-facing claims, shaping how sustainability and product information are presented on-pack.
Competitive Landscape
The market exhibits moderate concentration. O-I Glass leads with large-scale furnace capacity and vertically integrated cullet networks, while Verallia North America supplies niche wine bottles through cross-border flows. Mid-tier contenders Richards Packaging, Stanpac, and TricorBraun focus on premium and custom niches, often augmenting design services via acquisitions such as TricorBraun’s 2024 purchase of Veritiv Containers.
Technology adoption is rising: Richards Packaging is piloting AI-enabled sorters that boost cullet purity for flint flasks sold to artisanal gin producers. Stanpac, aided by provincial funding, doubled milk-bottle output on a new low-carbon annealing line in 2024.[3]Stanpac Inc., “Corporate Information and Government Partnerships,” stanpac.com These moves reflect a shift from tonnage-driven competition to differentiated service models supporting the Canada glass bottles and containers market.
Importantly, decarbonization spend is emerging as a moat. Early electric-furnace adopters lock in CER compliance cost advantages, whereas laggards face potential carbon surcharges post-2030. Access to recycled feedstock and lightweighting IP will therefore help define leadership over the forecast horizon.
Canada Glass Bottles And Containers Industry Leaders
O-I Glass, Inc.
Vitro, S.A.B de C.V
Verallia North America
Roy + LeClair Inc.
Richards Packaging Inc.
- *Disclaimer: Major Players sorted in no particular order

Market Opportunities and Future Outlook
Provincial EPR and recovery targets create opportunities for higher-cullet, closed-loop supply arrangements, as well as investments in cullet processing and sorting that can improve feedstock quality for flint and amber production. Ontario's Blue Box Regulation (O. Reg. 391/21) under the Resource Recovery and Circular Economy Act sets mandatory recovery percentages for glass beverage containers, including 75% for 2026-2029 and 80% from 2030 onward, which increases the value of reliable post-consumer glass streams and drives compliance-ready reporting across the packaging value chain.
Bottling expansions in beverages and non-alcoholic categories also support container demand, favoring suppliers that can deliver flexible formats, decoration options, and short-run capability. In February 2026, Coca-Cola Canada Bottling announced a CAD 141 million expansion of its Brampton, Ontario manufacturing facility, adding a new production line and 62,000 square feet of new production space, strengthening local packaging supply chains around the Greater Toronto Area. Formosa Springs also relaunched a Canadian mineral water brand with production at its facility in Formosa, Ontario, highlighting glass bottling capacity exceeding 100 million units annually and a planned direct-to-consumer rollout in 2026, reinforcing opportunities in premium water and functional beverage packaging where glass supports product storytelling.
Recent Industry Developments
- April 2026: Finacity announced an upsized IFRS off-balance sheet trade receivables securitization program for Vitro to USD 275 million, including receivables originated by Vitro subsidiaries in Canada. The move supports liquidity and working-capital resilience for container glass supply into Canada, helping stabilize procurement and production cycles during periods of cost and demand volatility.
- May 2025: O-I Canada Corp. confirmed it operates two glass manufacturing plants in Canada, located in Brampton, Ontario, and Montreal, Quebec. The disclosure highlights how domestic container glass capacity is centered in these hubs for serving beverage and food fillers across major Canadian demand corridors.
- December 2024: O-I Glass launched regional collection partnerships aimed at raising recycled content in new containers, with a stated target trajectory toward 90% recycled-content bottles by 2027. The initiative strengthens cullet access and quality improvements, supporting higher recycled-content production runs and helping brand owners align packaging choices with provincial EPR compliance needs.


Research Methodology Framework and Report Scope
Market Definition and Coverage
We define this market as the total volume of glass bottles and rigid glass containers supplied for packaging use in Canada, across major end uses like beverages, food, cosmetics and personal care, and select pharmaceutical packaging.
Scope exclusions: The scope excludes pharmaceutical vials and ampoules and it does not count non-glass packaging formats.
Segmentation Overview
- By End-user
- Beverages
- Alcoholic
- Beer
- Wine
- Spirits
- Other Alcoholic Beverages (Cider and Other Fermented Drinks)
- Non-Alcoholic
- Juices
- Carbonated Drinks (CSDs)
- Dairy Product Based Drinks
- Other Non-Alcoholic Beverages
- Alcoholic
- Food (Jam, Jelly, Marmalades, Honey, Sausages and Condiments, Oil, Pickles)
- Cosmetics and Personal Care
- Pharmaceuticals (excluding Vials and Ampoules)
- Perfumery
- Beverages
- By Color
- Green
- Amber
- Flint
- Other Colors
Data Sources, Market Sizing, and Validation
Desk Research
Desk research was used to set the market boundaries and build the first demand and supply picture for glass containers in Canada. We primarily reviewed public statistics and industry releases to understand container glass output, recycling flows, and the end markets that pull glass packaging.
For grounding, we referred to sources such as Statistics Canada for manufacturing and trade series, the Canada Border Services Agency for customs and tariff codes, and Environment and Climate Change Canada for policy signals that influence recycled content and collection. We also reviewed illustrative industry sources such as the Glass Packaging Institute, provincial extended producer responsibility guidance, peer reviewed packaging and materials journals, plus company annual reports and investor presentations to align capacity, product mix, and demand direction. We also used a paid subscription covering company financials and intelligence to fill gaps where public disclosures were limited. These sources are examples only, and many other public documents and datasets were checked to clarify, validate, and complete the analysis.
Primary Interviews and Surveys
Primary work focused on confirming what the model could not safely infer from public data, especially end use mix, import substitution, and the pace of lightweighting in common bottle and jar formats. We spoke with stakeholders across the value chain, including container manufacturers, large packaging buyers, distributors, and recycling related experts, and then used follow ups to pressure test assumptions across Canada's major consuming provinces and cross border trade links.
Distribution of primary research fieldwork respondents
| Company type | Respondent position |
|---|---|
| Top tier: 31% | CXOs: 15% |
| Mid tier: 50% | Functional/Unit leaders: 33% |
| Smaller Players: 19% | Managers: 52% |
Market-Sizing & Forecasting
Sizing starts with a top down build that reconstructs Canada's glass container demand pool from end use indicators, and then translates it into container glass volumes using typical grams per unit and observed lightweighting patterns. Where public series were available, production and trade flows were used to cross check the demand build so the totals stayed consistent with supply reality.
Key inputs used in the model include beverage and food packaging demand direction, container glass import and export trends, recycling and cullet availability signals, furnace and plant capacity utilization clues, and mix shifts by color that can change manufacturing yield and product allocation. These variables matter because the market is measured in kilotons, so small changes in average bottle weight or the share of refillable formats can move the total volume even when consumer demand is stable.
For forecasting, scenario analysis was applied around a base case that reflects expert views on beverage volumes, premiumization in food and personal care, and the practical pace of lightweighting under Canadian supply constraints. Bottom up checks were then done selectively using sampled supplier throughput, typical product weights, and channel feedback on order patterns, and where a data gap persisted, conservative ranges were used and narrowed only after interview validation.
Data Validation & Update Cycle
Results were validated through triangulation across three angles: end use demand indicators, trade and production consistency checks, and reasonableness against known capacity and recycling constraints. When a variance looked too large, the driver was isolated (for example, a sudden import swing or an unrealistic weight assumption) and the input was revisited before totals were finalized.
A second analyst review was completed to confirm that calculations are repeatable and that assumptions are clearly linked to observable signals. The report is refreshed annually, and interim checks are triggered when material events occur, such as major furnace rebuild announcements, regulatory changes tied to producer responsibility, or sharp trade disruptions. Before delivery, we run a fresh pass on key inputs so clients receive the latest updated view.
Mordor Intelligence's Canada Glass Bottles and Containers Market Sizing Compared With Other Published Estimates
Published market numbers for Canada glass bottles and containers can vary because studies do not always count the same container set, and they also mix value and volume reporting in different ways. Differences in what is treated as a packaging container versus a wider glass packaging pool also create gaps, especially when adjacent items are added without a clear weight and conversion logic.
In practice, the largest gaps usually come from whether pharmaceutical vials and ampoules are included, how imports are converted into domestic consumption, and what assumptions are made for average container weight as lightweighting progresses. Currency timing can also affect value based totals, and stale base year inputs can keep older estimates from reflecting recent trade and recycling shifts.
Benchmark comparison
| Source | Market Size | Gaps in Research Methodology |
|---|---|---|
| Mordor Intelligence | USD 0.55 M (2025) | |
| Trade Journal A | USD 2.68 B (2024) | Uses a retail glass packaging revenue view, which likely includes wider packaging categories and price effects, so it is not directly comparable to a container glass volume model. |
| Regional Consultancy B | USD 2.42 B (2026) | Extends scope into broader specialty containers and applies value based growth assumptions, which can overstate totals when average selling prices and product weights are not separately reconciled. |
The spread in the table is mainly explained by value versus volume treatment and how far the packaging definition is extended beyond bottles and common containers. By keeping the sizing anchored to kiloton demand signals, trade adjusted consumption, and a clear exclusion of vials and ampoules, the estimate stays traceable to repeatable steps, a modeling choice applied by Mordor Intelligence.


Key Questions Answered in the Report
How large is the Canada glass bottles and containers market in 2026?
The market reached 564.89 kilotons in 2026 and is forecast to rise to 621.27 kilotons by 2031.
Which end-use segment grows fastest through 2031?
Cosmetics and personal care lead with a 2.33% CAGR, outpacing beverages and food.
Why is amber glass demand accelerating?
Craft breweries and premium spirits prioritize amber for UV protection and brand differentiation, driving a 2.51% CAGR for amber containers.
What regulations most influence future glass demand?
Quebec’s expanded deposit-return system and Canada’s Clean Electricity Regulations shape recovery incentives and manufacturing costs.
How concentrated is domestic production capacity?
A handful of plants chiefly O-I Glass in Brampton and regional players like Richards Packaging supply most national demand, yielding a concentration score of 6.
What role does cullet play in cost control?
Each 10% rise in cullet reduces furnace energy needs by 2-3%, helping plants offset energy-price volatility while meeting sustainability targets.
Page last updated on:


 Your data is secure and never sold or shared.


