
Canada Fruits And Vegetables Market Analysis by Mordor Intelligence
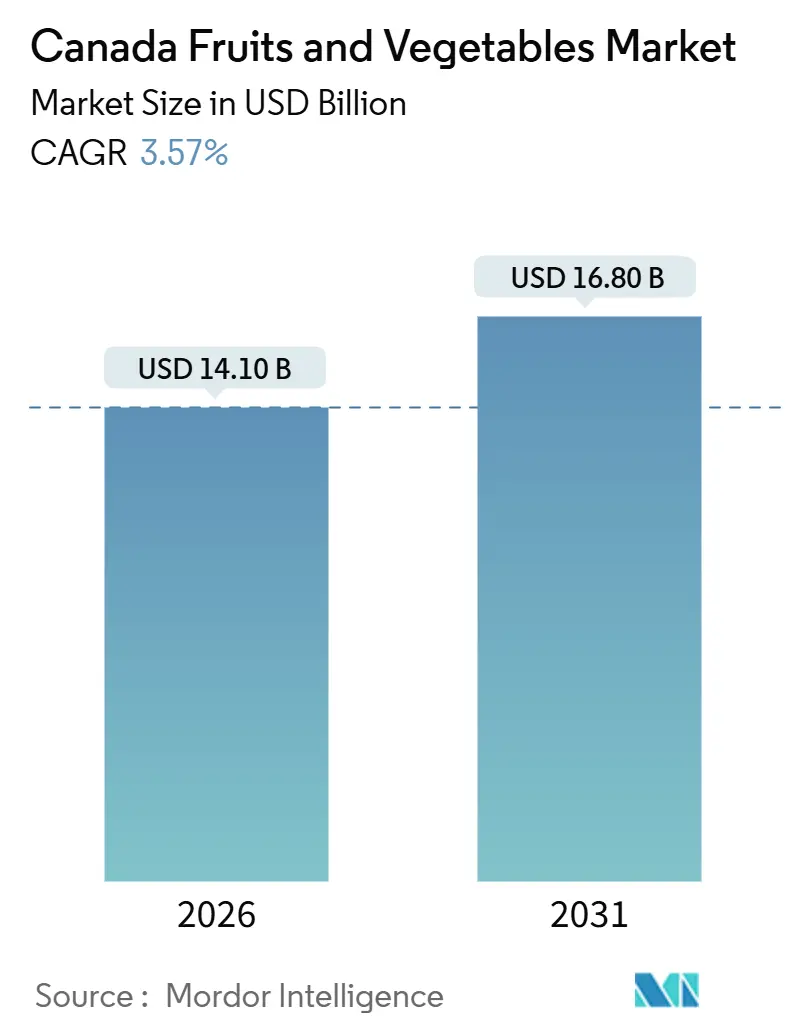
The Canada fruits and vegetables market size reached USD 14.10 billion in 2026 and is projected to climb to USD 16.80 billion by 2031, advancing at a 3.57% CAGR during the forecast period. Yield intensification, rather than acreage gains, is the primary growth lever, as greenhouse area has been increasing in recent years, underscoring the productivity dividend of controlled-environment agriculture (CEA). Federal subsidy programs, including AgriStability and AgriInvest, delivered more than CAD 2.0 billion (USD 1.5 billion) of support in 2024, helping to cushion growers against climatic shocks and price fluctuations. Locally grown produce with provenance resonates strongly with consumers, with 88% of shoppers in Quebec and 84% in British Columbia seeking domestic produce, although price sensitivity persists, prompting retailers to balance premium in-season supply with lower-cost imports during the shoulder months[1]Source: Agriculture and Agri-Food Canada, “Consumer Trends in Fresh Fruits and Vegetables in Canada, 2024,” agriculture.canada.ca. Structural headwinds remain, including labor vacancies, tariff-rate quotas under the Canada-United States-Mexico Agreement (CUSMA), and weather volatility, all of which temper the pace of expansion. However, rising off-take from plant-based food processors and indigenous greenhouse initiatives open up fresh demand channels that reinforce the positive baseline outlook.
Key Report Takeaways
- By consumption, vegetables accounted for 54.8% of Canada fruits and vegetables market size in 2025, while fruits are forecast to post a 3.8% CAGR through 2031.
Note: Market size and forecast figures in this report are generated using Mordor Intelligence’s proprietary estimation framework, updated with the latest available data and insights as of January 2026.
Canada Fruits And Vegetables Market Trends and Insights
Drivers Impact Analysis*
| Driver | (~) % Impact on CAGR Forecast | Geographic Relevance | Impact Timeline |
|---|---|---|---|
| Rising consumer preference for locally grown produce | +0.7% | National, strongest in Quebec, British Columbia, and Ontario | Medium term (2-4 years) |
| Federal and provincial subsidy programs | +0.6% | National, jointly funded | Long term (≥ 4 years) |
| Expansion of controlled-environment agriculture | +0.9% | Ontario, British Columbia, and Quebec greenhouse clusters | Medium term (2-4 years) |
| Climate resilience and crop diversification strategies | +0.4% | British Columbia and Ontario | Long term (≥ 4 years) |
| Indigenous community-led horticulture projects | +0.2% | Northern Ontario, Nunavut, and remote First Nations territories | Long term (≥ 4 years) |
| Off-take demand from plant-based food processors | +0.5% | Prairie provinces and Ontario | Medium term (2-4 years) |
| Source: Mordor Intelligence | |||
Rising Consumer Preference for Locally Grown Produce
Surveys conducted in 2024 revealed that 88% of Quebec consumers and 84% in British Columbia prioritize domestic produce, with three-quarters willing to pay premiums averaging 12% above those for imported items. Higher-income households drive most of the uplift, widening the market for premium berries and organic apples while price-sensitive shoppers switch to imports when budgets tighten. Retailers respond with province-specific branding and “grown close to home” shelf tags that lift in-season velocity. Despite the enthusiasm, 62% of Canadians admit they will revert to cheaper imports during economic slowdowns, signaling that loyalty is conditional on price parity. Growers, therefore, rely on traceability technologies and direct-to-consumer channels to protect their margins without losing volume when exchange-rate shifts or logistics bottlenecks favor offshore supply.
Federal and Provincial Subsidy Programs
AgriStability and AgriInvest together transferred more than CAD 2.0 billion (USD 1.5 billion) to producers in 2024, yet only a minority of horticulture operators fully utilized the benefits, as reference-margin formulas and paperwork hurdles deterred enrollment. Tailored interventions at the provincial level help bridge some gaps, as British Columbia offered CAD 70 million (USD 51 million) for tree-fruit replanting after the 2024 freeze[2]Source: Government of British Columbia, “Province Supports Tree Fruit Growers with 70 Million CAD Replanting Program,” gov.bc.ca. Audits show 38% of eligible farms in Quebec and Atlantic Canada left funds on the table, highlighting an administrative barrier rather than a funding shortfall. Streamlined digital sign-ups and crop-specific indexing would unlock additional coverage, stabilizing income when pest outbreaks or tariff swings compress margins.
Expansion of Controlled-Environment Agriculture
Canada's greenhouse vegetable area reached 33.3 million square meters in 2024. Ontario’s Leamington-Kingsville corridor controls 56% of the national area, leveraging low-cost natural gas and proximity to Detroit distribution hubs. Yield consistency is key, with greenhouse tomatoes capable of delivering 60-80 kg/m² annually, compared to 8-12 kg for field crops, enabling dependable winter volumes that crowd out Mexican imports. Capital intensity remains high, as building a 10-hectare glasshouse costs CAD 30-40 million (USD 22-30 million). Yet, payback is compressed to roughly eight years as energy prices normalize post-2023 and retailers widen pesticide-free premiums.
Indigenous Community-Led Horticulture Projects
Federal programs supporting food sovereignty have financed dozens of 500 to 2,000-square-meter hydroponic greenhouses in northern Ontario and Nunavut, thereby reducing reliance on air-freighted imports that historically carried spoilage rates above 15%[3]Source: Indigenous Services Canada, “Community-Based Climate Monitoring Program,” sac-isc.gc.ca. A 2024 Kuujjuaq pilot produced 3.2 metric tons of lettuce in eight months and cut household produce spending by an estimated 18%. High diesel energy costs and seasonal supply lags for substrates complicate operations; however, projects foster local employment and a nascent Arctic horticulture skill base. Long-term continuity hinges on multi-cycle funding, as most grants expire within five years.
Restraints Impact Analysis*
| Restraint | (~) % Impact on CAGR Forecast | Geographic Relevance | Impact Timeline |
|---|---|---|---|
| Climatic volatility and extreme weather | -0.8% | National, acute in British Columbia, Prairies, and Atlantic Canada | Short term (≤ 2 years) |
| Farm-labor shortages and rising wages | -0.6% | National, most severe in Ontario and British Columbia greenhouses | Medium term (2-4 years) |
| Seasonal tariff gaps under the Canada-United States-Mexico Agreement | -0.4% | National, concentrated in Ontario and Quebec | Short term (≤ 2 years) |
| Refrigerated logistics bottlenecks in remote areas | -0.3% | Northern Ontario, Atlantic provinces, and Prairie rural zones | Medium term (2-4 years) |
| Source: Mordor Intelligence | |||
Climatic Volatility and Extreme Weather
British Columbia’s January 2024 freeze destroyed entire stone-fruit crops and 85% of sweet cherries, inflicting more than CAD 700 million (USD 500 million) in losses. Drought stress affected 70% of the country's farmland in 2024, resulting in a 12% reduction in Atlantic berry yields. Prairie potato growers faced water allocation cuts of 20-30%, forcing acreage abandonment. Frost fans, hail netting, and drip systems are shifting from optional to mandatory, yet, at CAD 10,000-30,000 (USD 7,500-22,500) per hectare, few smallholders can afford the upgrades. Crop insurance uptake remains patchy, with only 54% of British Columbia's horticulture acreage carried coverage in 2024, prompting the exploration of parametric weather policies that pay out automatically when key thresholds are breached.
Farm-Labor Shortages and Rising Wages
More than 28,000 agricultural vacancies persisted in 2022, and the gap could reach 15% of required workers by 2030 despite the Temporary Foreign Worker (TFW) Program comprising 29% of crop-production labor in 2019[4]Source: Employment and Social Development Canada, “Temporary Foreign Worker Program 2019 Statistics,” canada.ca. Farm wages rose 9% in 2024 as horticulture competed with construction and hospitality. Large greenhouse operators are piloting robotic harvesters, which offer five-to-six-year payback horizons, but capital constraints leave smallholders reliant on family labor or informal networks. The average operator age now stands at 56, raising succession concerns that exacerbate consolidation as farms with less than 10 hectares exit the sector.
*Our forecasts treat driver/restraint impacts as directional, not additive. The impact forecasts reflect baseline growth, mix effects, and variable interactions.
Segment Analysis
By Consumption: Vegetables Dominate Value, Fruits Capture Growth Momentum
In 2025, vegetables accounted for 54.8% of the Canada fruits and vegetables market share, reflecting the overall Canada fruits and vegetables market size and supported by greenhouse-grown tomatoes, peppers, and cucumbers, as well as field-grown potatoes and onions. Fruits are projected to grow at a faster CAGR of 3.8% through 2031, driven by export-oriented blueberries and high-margin apple varieties. Fruit demand is typically higher among higher-income households and health-conscious consumers, while vegetables remain more sensitive to price changes.
Berry production in Canada is driven by export competitiveness and varietal specialization, with blueberries leading the way due to their scalability, storage durability, and high international demand. Strawberries and cranberries support regional production and value-added processing. Apple growers are shifting to premium cultivars, focusing on texture, sweetness, and brand recognition to optimize margins. Leafy greens, such as lettuce, face climate and seasonal challenges, making Canada reliant on cross-border sourcing and vulnerable to fluctuations in trade costs. Potatoes balance fresh consumption with processing demand, with contracts, storage, and proximity to processors shaping planting decisions.


Geography Analysis
Ontario and British Columbia generated approximately 62% of the national horticulture production in 2025. Ontario’s leverage derives from its Leamington-Kingsville greenhouse hub, which reported CAD 1.5 billion (USD 1.1 billion) in sales, most of which flows to Michigan and Ohio retail chains. British Columbia’s Fraser Valley and Okanagan regions contributed CAD 1.0 billion (USD 750 million) from a mix of berries, apples, and greenhouse peppers, branding produce under low-carbon certifications that resonate with West Coast consumers.
Quebec accelerates the fastest, as greenhouse acreage climbed significantly from 2022 to 2024. Growers channel 34% of their produce through farmers’ markets or community-supported agriculture programs, which is double the national average. This direct route allows for the retention of up to 70% of the retail price, versus 30-40% via wholesale. Prairie provinces specialize in storage crops, as Manitoba planted 27,000 hectares of potatoes in 2024, while Alberta harvested 85,000 metric tons of onions. Yet a multi-year drought forced southern Alberta irrigation districts to cut allocations by up to 30%, nudging some growers toward pulses.
The Atlantic provinces rely heavily on potatoes and blueberries for export, but their narrow growing season makes them net importers of most fresh produce. Prince Edward Island shipped 540,000 metric tons of processing potatoes to the United States in 2024, although labor constraints and volatile pricing triggered accelerated consolidation among farms with less than 20 hectares of land. Northern territories host emerging indigenous greenhouse ventures, but are hampered by energy and logistics overheads. Regulatory compliance under the Safe Food for Canadians Regulations imposes traceability obligations that weigh proportionally heavier on micro-scale operators, adding indirect pressure toward regional concentration.
Regulatory Landscape
Canada's fruits and vegetables supply chain is governed primarily by the Canadian Food Inspection Agency (CFIA) through the Safe Food for Canadians Regulations (SFCR), which set licensing, preventive control, traceability, and labeling obligations for parties that import, prepare, or trade fresh produce across provincial and international borders. For imports, CFIA publishes commodity-specific requirements and uses the Automated Import Reference System (AIRS) as the official reference point, alongside plant health directives (including D-95-08 for temperate fresh fruit) to manage quarantine pest risks via phytosanitary measures.
Trade and quality rules add additional compliance layers. Imported staples such as apples, onions, and potatoes can require inspection certificates demonstrating conformity with Canadian grade requirements (recognized issuers include the USDA, New Zealand Ministry for Primary Industries, or CFIA). In processed vegetables, 2026 introduced a more defensive posture: in March 2026, the Department of Finance requested a Canadian International Trade Tribunal safeguard inquiry into imports of frozen and canned vegetables, and on July 1, 2026, a 10% surtax on certain imported canned vegetables took effect for a 200-day period for non-free trade partners, raising landed-cost volatility for some buyers and distributors.
Value Chain Analysis
Canada's fruit and vegetable value chain starts with upstream inputs (seed and plant genetics, fertilizers and crop protection regulated in-market, substrates and energy for controlled-environment agriculture, and seasonal labor via domestic hiring and the Temporary Foreign Worker pathway). Production is split between open-field crops (potatoes, onions, berries, orchard fruit) and greenhouse/CEA output concentrated in major clusters such as Ontario's Leamington-Kingsville corridor. Government support programs, including AgriStability and AgriInvest (more than CAD 2.0 billion delivered in 2024), shape growers' risk management and investment capacity for replanting, protected cultivation, and on-farm storage.
Midstream activity covers packing, grading, and cold storage, followed by movement through wholesalers/distributors, retailer direct-sourcing programs, foodservice, and processors (notably for potatoes). Downstream performance is conditioned by perishability and cross-border integration, where bottlenecks such as border inspection delays, port dwell times, cold-chain gaps in remote regions, and labor shortages in warehousing can drive shrink and service-level risk, particularly during shoulder seasons when import dependence rises. Statistics Canada also reported the farm-gate value of Canadian fruits and vegetables at CAD 3.4 billion in 2025 (record level), with vegetable production rising to 2.6 billion kilograms.
Competitive Landscape
Canada’s fresh-produce sector remains fragmented, yet consolidation is accelerating as capital-intensive greenhouse operations expand. Ten Ontario greenhouses, including Mastronardi Produce Ltd and Red Sun Farms, account for roughly 40% of the province's tomato output and have invested more than CAD 200 million (USD 150 million) in robotics and cogeneration since 2022. Field potatoes and onions operate under regional oligopolies, with Cavendish Farms and McCain Foods Limited anchoring supply contracts that lock in pricing below spot during surplus years.
Large food retailers, including Loblaw Companies, Sobeys Inc., and Metro Inc., exert significant buyer power by forming direct-sourcing agreements and private-label programs that absorb 15-20% of the margins once held by wholesalers. Compliance with Good Agricultural Practices certifications costs CAD 10,000-20,000 (USD 7,500-15,000) per year, erecting barriers for farms below 20 hectares. Technology penetration remains uneven, with fewer than 5% of sites utilizing AI-enabled platforms, presenting an opportunity for providers to bundle financing with yield guarantees.
Disruptors include vertical-farming specialist GoodLeaf Farms, which operates energy-intensive indoor modules that claim 95% water savings but still struggle with electricity costs. Government research institutes file patents, such as Agriculture and Agri-Food Canada’s 2024 machine-learning harvest predictor, yet commercialization pathways often favor larger private firms that can license and deploy technologies at scale. Overall, the industry is shifting toward a hub-and-spoke structure, where well-capitalized producers secure long-term contracts with retailers, while smallholders either niche into organic and farm-gate channels or exit the market.
Market Opportunities and Future Outlook
Policy-led capital deployment is creating measurable scope for year-round domestic supply and related infrastructure build-out. In June 2026, the Government of Canada launched the National Food Security Strategy, including a CAD 750 million Controlled Environment Agriculture (CEA) Growth Pathway for greenhouse and vertical farm expansion, alongside calls aimed at resilience in food processing. With Canada's import reliance at 88% for fresh fruit and 72% for vegetables, CEA, regional packing, and cold storage stand out as priority areas for projects that can meet eligibility and compliance requirements.
Operational constraints also define near-term opportunity sets. Ongoing labor shortages and higher wages are pushing larger growers toward automation and digital tools, while the adoption gap between large and small farms creates space for bundled solutions that combine equipment with financing and service to reduce deployment friction. In parallel, SFCR traceability and CFIA import rules increase the value of compliant, auditable domestic supply and stronger post-harvest handling for retailers running direct-sourcing and private-label programs. At the trade-policy edge, 2026 safeguard actions in processed vegetables (frozen/canned) and periodic tariff or inspection shocks strengthen the case for flexible domestic production and distribution networks that can rebalance between local output and imports without service disruption.
Recent Industry Developments
- July 2026: Courchesne Larose Group completed its acquisition of Star Group to broaden its national fresh produce distribution footprint. The deal strengthens warehousing and transportation scale across Canada, supporting tighter service levels for retailers and foodservice buyers managing volatile import lead times.
- June 2026: Chenail Import-Export acquired Les Entrepots Fruigor, expanding storage, ripening, and distribution capabilities for fresh fruits and vegetables. The acquisition deepens Quebec-centered cold-chain capacity and supports faster throughput for perishable categories where shrink and dwell time are major cost drivers.
- December 2025: The governments of Canada and Alberta launched the three-year CAD 10 million Growing Greenhouses program under the Sustainable Canadian Agricultural Partnership. The program targets construction and expansion of commercial greenhouses and vertical farms, supporting year-round supply and reducing seasonal exposure to imported produce.


Research Methodology Framework and Report Scope
Market Definition and Coverage
This market is defined as the total value of fruits and vegetables consumed in Canada, with demand supported by domestic supply and net trade. The sizing tracks market movement by reconciling production, consumption, imports, exports, and wholesale price signals for fruits and vegetables.
Scope exclusions: This sizing does not treat packaged food products where fruits or vegetables are only minor ingredients, and it does not count non-edible horticulture.
Segmentation Overview
- Fruits
- Apple
- Production Analysis
- Production Volume
- Area Harvested and Yield
- Consumption Analysis (Value and Volume)
- Trade Analysis (Value and Volume)
- Import Market Analysis
- Import Value and Volume
- Key Supplying Markets
- Export Market Analysis
- Export Value and Volume
- Key Destination Markets
- Import Market Analysis
- Wholesale Price Trend Analysis and Forecast
- Seasonality Analysis
- Production Analysis
- Berries
- Production Analysis
- Production Volume
- Area Harvested and Yield
- Consumption Analysis (Value and Volume)
- Trade Analysis (Value and Volume)
- Import Market Analysis
- Import Value and Volume
- Key Supplying Markets
- Export Market Analysis
- Export Value and Volume
- Key Destination Markets
- Import Market Analysis
- Wholesale Price Trend Analysis and Forecast
- Seasonality Analysis
- Production Analysis
- Grapes
- Production Analysis
- Production Volume
- Area Harvested and Yield
- Consumption Analysis (Value and Volume)
- Trade Analysis (Value and Volume)
- Import Market Analysis
- Import Value and Volume
- Key Supplying Markets
- Export Market Analysis
- Export Value and Volume
- Key Destination Markets
- Import Market Analysis
- Wholesale Price Trend Analysis and Forecast
- Seasonality Analysis
- Production Analysis
- Citrus
- Production Analysis
- Production Volume
- Area Harvested and Yield
- Consumption Analysis (Value and Volume)
- Trade Analysis (Value and Volume)
- Import Market Analysis
- Import Value and Volume
- Key Supplying Markets
- Export Market Analysis
- Export Value and Volume
- Key Destination Markets
- Import Market Analysis
- Wholesale Price Trend Analysis and Forecast
- Seasonality Analysis
- Production Analysis
- Bananas
- Production Analysis
- Production Volume
- Area Harvested and Yield
- Consumption Analysis (Value and Volume)
- Trade Analysis (Value and Volume)
- Import Market Analysis
- Import Value and Volume
- Key Supplying Markets
- Export Market Analysis
- Export Value and Volume
- Key Destination Markets
- Import Market Analysis
- Wholesale Price Trend Analysis and Forecast
- Seasonality Analysis
- Production Analysis
- Apple
- Vegetables
- Potato
- Production Analysis
- Production Volume
- Area Harvested and Yield
- Consumption Analysis (Value and Volume)
- Trade Analysis (Value and Volume)
- Import Market Analysis
- Import Value and Volume
- Key Supplying Markets
- Export Market Analysis
- Export Value and Volume
- Key Destination Markets
- Import Market Analysis
- Wholesale Price Trend Analysis and Forecast
- Seasonality Analysis
- Production Analysis
- Tomato
- Production Analysis
- Production Volume
- Area Harvested and Yield
- Consumption Analysis (Value and Volume)
- Trade Analysis (Value and Volume)
- Import Market Analysis
- Import Value and Volume
- Key Supplying Markets
- Export Market Analysis
- Export Value and Volume
- Key Destination Markets
- Import Market Analysis
- Wholesale Price Trend Analysis and Forecast
- Seasonality Analysis
- Production Analysis
- Lettuce
- Production Analysis
- Production Volume
- Area Harvested and Yield
- Consumption Analysis (Value and Volume)
- Trade Analysis (Value and Volume)
- Import Market Analysis
- Import Value and Volume
- Key Supplying Markets
- Export Market Analysis
- Export Value and Volume
- Key Destination Markets
- Import Market Analysis
- Wholesale Price Trend Analysis and Forecast
- Seasonality Analysis
- Production Analysis
- Chillies and Peppers
- Production Analysis
- Production Volume
- Area Harvested and Yield
- Consumption Analysis (Value and Volume)
- Trade Analysis (Value and Volume)
- Import Market Analysis
- Import Value and Volume
- Key Supplying Markets
- Export Market Analysis
- Export Value and Volume
- Key Destination Markets
- Import Market Analysis
- Wholesale Price Trend Analysis and Forecast
- Seasonality Analysis
- Production Analysis
- Onions
- Production Analysis
- Production Volume
- Area Harvested and Yield
- Consumption Analysis (Value and Volume)
- Trade Analysis (Value and Volume)
- Import Market Analysis
- Import Value and Volume
- Key Supplying Markets
- Export Market Analysis
- Export Value and Volume
- Key Destination Markets
- Import Market Analysis
- Wholesale Price Trend Analysis and Forecast
- Seasonality Analysis
- Production Analysis
- Potato
Data Sources, Market Sizing, and Validation
Desk Research
Desk research was used to set the factual base for Canada supply, demand, and trade dynamics before assumptions were finalized. We relied on public statistics and policy references, such as Statistics Canada releases, Agriculture and Agri-Food Canada horticulture overviews, Canadian Food Inspection Agency guidance, and official customs trade series, which helped confirm units, seasonality, and commodity group boundaries.
To translate these signals into a consistent market view, secondary reading also included annual reports and investor presentations of large value chain participants, reputable agriculture press coverage, and association websites that discuss crop conditions and pricing. In addition, we selectively used paid subscriptions for company financials and news screening, shipment-level views for imports and exports, and patent databases to sanity check activity around controlled-environment production and handling. The desk sources named above are illustrative only, and many other public documents were reviewed for data collection, validation, and clarification.
Primary Interviews and Surveys
Primary work focused on checking how volumes, prices, and trade flows translate into realized market value at the Canada level. We spoke with growers, importers, wholesalers, large buyers, and industry experts across major producing and consuming provinces, which helped close gaps around seasonal price swings, greenhouse share, and substitution across fruit and vegetable categories.
Distribution of primary research fieldwork respondents
| Company type | Respondent position |
|---|---|
| Top tier: 33% | CXOs: 14% |
| Mid tier: 53% | Functional/Unit leaders: 37% |
| Smaller Players: 14% | Managers: 49% |
Market-Sizing & Forecasting
Sizing starts with a top-down build where production and trade data are reconstructed into an implied availability pool, which is then reconciled with consumption signals and wholesale pricing to land at a Canada market value. Because fruits and vegetables move through domestic harvest, greenhouse output, and imports, the model is anchored on indicators such as production volumes by major crop groups, import and export values, wholesale price movements, and yield and weather-driven supply variability.
Results are then corroborated with selective bottom-up approximations, such as sampled price per kilogram by category multiplied by apparent consumption volumes. We also used channel checks with wholesalers and large buyers to validate price realization and loss assumptions. Where direct data is thin (for example, for fast-shifting greenhouse output or short-season items), gaps are handled by using proxy crops with similar seasonality and then adjusting through primary feedback.
For forecasting, scenario analysis is used and then tightened using a simple multivariate regression on drivers that practitioners consistently referenced, including planted area and yield expectations, import dependence by category, greenhouse capacity ramp trends, and inflation-linked wholesale price progression. The final forecast remains traceable so a junior analyst can re-run the same steps when new production, trade, or price releases come out.
Data Validation & Update Cycle
Validation is done through cross-checks across independent signals, followed by a step-by-step review before the estimate is finalized. We compare the modeled totals against directionally expected movements in production, trade balance, and wholesale pricing, and unusual jumps are investigated before sign-off.
When variances remain large for a specific commodity group, re-contacts are triggered with market participants to confirm whether the change came from weather, policy, logistics, or a real price reset. Reports are refreshed annually, with interim updates when a material event shifts trade flows or pricing, and a fresh pre-delivery check is completed so clients receive the latest updated view.
Mordor Intelligence's Canada Fruits and Vegetables Market Size Measured Against Other Published Estimates
Published market sizes can look far apart even when the topic name is the same, since the counted price point and the activity level in the chain can differ. Differences usually come from whether the estimate is closer to farm-gate value, wholesale movement, or retail selling price, and whether trade and price seasonality are treated consistently.
By tracking consumption alignment, net trade movement, and wholesale price progression, Mordor Intelligence keeps the estimate tied to edible fruit and vegetable market value in Canada, instead of mixing in retail markups or unrelated processed-food revenue. In practice, the biggest gap drivers are scope boundaries (fresh versus processed inclusion), the year used for currency timing, and how greenhouse-driven supply changes are carried into the forecast.
Benchmark comparison
| Source | Market Size | Gaps in Research Methodology |
|---|---|---|
| Mordor Intelligence | USD 14.10 B (2026) | |
| Trade Journal A | USD 15.32 B (2024) | Uses retail selling prices for vegetables and typically includes retail markup and a different time point, which makes it structurally higher than a wholesale and trade reconciled view. |
| Industry Database B | USD 12.20 B (2024) | Represents wholesaling industry revenue, which can understate total category value because it reflects intermediary turnover and can exclude portions of direct sales and some cross-channel movements. |
The table shows that the spread is mainly explained by where value is measured in the chain and whether the estimate is commodity-market value or an industry-revenue proxy. Using clear demand and supply signals, plus primary checks on price realization and seasonality, the final number stays easy to audit and repeat when new Canada data releases arrive.


Key Questions Answered in the Report
How large is the Canada fruits and vegetables market in 2026?
The Canada fruits and vegetables market size is valued at USD 14.10 billion in 2026.
What is the projected growth rate for Canada fruits and vegetables market through 2031?
The market is projected to expand at a 3.57% CAGR, reaching USD 16.80 billion by 2031.
Which segment is growing fastest?
Fruits are forecast to post the higher 3.8% CAGR due to rising berry exports and premium apple varieties.
Why are Ontario and British Columbia so dominant in Canadian horticulture?
Ontario benefits from a large greenhouse corridor near United States markets, while British Columbia leverages hydroelectric power and sustainability branding to capture high-value output.
How are growers addressing labor shortages?
Large operators invest in robotic harvesters and AI-enabled systems, while smaller farms rely on the Temporary Foreign Worker Program and selective mechanization grants.
Page last updated on:


 Your data is secure and never sold or shared.


