
| Study Period | 2017 - 2030 |
| Base Year For Estimation | 2024 |
| Forecast Data Period | 2025 - 2030 |
| Market Size (2025) | USD 111.7 Billion |
| Market Size (2030) | USD 139.2 Billion |
| CAGR (2025 - 2030) | 4.50 % |
| Market Concentration | Low |
Major Players*Disclaimer: Major Players sorted in no particular order |


Canada Freight and Logistics Market Analysis
The Canada Freight and Logistics Market size is estimated at 111.7 billion USD in 2025, and is expected to reach 139.2 billion USD by 2030, growing at a CAGR of 4.50% during the forecast period (2025-2030).
Canada's logistics industry demonstrates robust international connectivity, with 15 authorized free trade agreements spanning 49 countries and providing access to over 1.5 billion global consumers. The nation's extensive transportation infrastructure includes a comprehensive pipeline network stretching 760,000 kilometers, facilitating efficient movement of resources across the vast territory. In October 2023, Canada further strengthened its international logistics capabilities through an expanded air transport agreement with Panama, enabling airlines to operate unlimited cargo flights between the two nations. This strategic expansion of air transport agreements reflects Canada's commitment to enhancing its global trade partnerships and diversifying its freight logistics networks.
The rail transport industry maintains a dominant position in Canada's freight infrastructure, with an extensive track length exceeding 48,309 kilometers. Rail freight operations generate 95% of the industry's revenue, highlighting its crucial role in the nation's cargo movement capabilities. In March 2024, Transport Canada demonstrated its commitment to rail infrastructure development by announcing an investment exceeding CAD 13.5 million (USD 9.96 million) to support 112 projects in Ontario's Greater Toronto and Hamilton Areas through the Rail Safety Improvement Program. This investment underscores the government's focus on maintaining and enhancing the safety and efficiency of rail freight operations within the Canadian transportation industry.
The warehousing sector continues to expand significantly, particularly in major metropolitan areas. By Q4 2023, the Greater Toronto Area had approximately 16.77 million square feet of warehousing space under construction, pushing the total warehousing inventory to 819.94 million square feet. The sector has experienced substantial growth in rental rates, with the average net asking rate reaching USD 17.08 per square foot in Q3 2023. This trend reflects the increasing demand for storage and distribution facilities in strategic locations across Canada's major urban centers, driven by the growth of the logistics industry.
Major infrastructure developments are reshaping Canada's logistics landscape, particularly in maritime transportation. The Port of Montreal, which handled 1.72 million TEUs in 2022, is set for significant expansion with a new container terminal project. Additionally, the Ridley Island Export Logistics Project, announced with a budget of CAD 750 million (USD 540 million), aims to enhance rail-to-container transloading capabilities with a capacity of 400,000 TEUs for agricultural goods, forestry products, and plastic resin. In June 2023, the cold storage sector saw notable growth with Conestoga Cold Storage Limited breaking ground on a new state-of-the-art facility in Halton Hills, Ontario, designed to be one of the world's largest with over 96 million cubic feet of capacity, marking a significant milestone in the logistics sector.
Canada Freight and Logistics Market Trends
Canada's transportation sector soars, boosted by infrastructure projects, eased travel policies and urban transit growth
- An efficient and reliable transportation system is crucial for the economy. Through the National Trade Corridors Fund, the Government of Canada invests in improving supply chains, reducing trade barriers, and fostering business growth for future economic opportunities. In May 2024, the Minister of Transport announced up to USD 51.2 million for 19 digital infrastructure projects under this fund. By promoting innovative technologies for stronger supply chains, the government aims to move goods faster and cheaper, making life more affordable for Canadians. This initiative will foster strong collaboration with stakeholders nationwide on key digital projects to better address transportation bottlenecks, vulnerabilities, and congestion at Canada's ports.
- In November 2024, the government announced progress in various projects. They had completed highway infrastructure improvements, enhancing road connections for First Nations communities to the province’s highway network. This included the successful removal and replacement of seven culverts on Highway 584 in 2024 and the completion of work planned on three culverts along Highway 11 in 2025. Looking ahead, an additional 26 culverts were set to be replaced along Highway 584 during the 2025-2026 construction seasons, with pavement rehabilitation of Highway 584 planned for 2027.
,-Share---Of-GDP,-Canada,-2017---2023.svg)
Understand The Key Trends Shaping This Market
Download PDF
Rising tensions in the Middle East are expected to affect crude oil supplies and lead to sudden price hikes
- Gasoline prices rose 0.8% YoY in February 2024. Additionally, gasoline prices rose by 5.6% YoY in May 2024, compared to 6.1% in April, 4.5% in March, and 0.8% in February. North America, strong crude oil production is expected to continue in the coming years. Also, as more Canadian crude oil is expected to reach global markets with the Trans Mountain Pipeline expansion coming online, there will be amply supplied crude oil markets. However, increased risks due to rising tensions in the Middle East are expected to affect crude oil supplies and lead to sudden price hikes.
- Annual maintenance on Canada's oil sands plants in 2024 is expected to cause no more disruption than usual. However, trade union officials warn of a labor shortage during Alberta's 2025 turnaround season due to the start of two new industrial projects. Each year, Alberta producers hire thousands of skilled workers for essential maintenance on oil sands upgraders, thermal projects, and refineries. Canada, the world's fourth-largest oil producer, gets about two-thirds of its 4.9 million barrels per day of crude from the oil sands in northern Alberta. This might raise fuel prices in 2025.

OTHER KEY INDUSTRY TRENDS COVERED IN THE REPORT
- Canada's population growth surged in Q1 2024, fueled by immigration and growing metropolitan areas
- Employment in retail-wholesale trade sector is expected to grow, supported by increased e-commerce activities and digital sales
- The online food market is exploding in Canada and about 10% of food sales are expected to occur online by 2025
- Canada strives towards its ambitious goal of 50% export growth by the year 2026
- Rising tensions in the Middle East are expected to affect crude oil supplies and lead to sudden price hikes
- Walmart Canada introduced a new hydrogen fuel cell-powered electric semi-truck in June 2024
- The federal government decided to invest USD 547.5 million in the purchase incentive program of Transport Canada for medium and heavy-duty ZEVs
- Construction projects, digitization and fluctuating trade are significantly impacting overall vessel movements
- The Canadian government is increasing investments to modernize and improve port performance
- Rising initiatives witnessed by Government and private players to increase cargo tonnage in the country
- The government introduced Green Manufacturing Initiative worth USD 4 million to boost the economy of Canada
- Energy and petroleum costs rise on the US East Coast due to the Russia-Ukraine War impacted Canadian pricing
- Small- and medium-sized enterprises (SMEs) in Canada account for 93% of the manufacturing industry
- Canada is considering imposing import tariffs on Chinese-made electric vehicles (EVs)
- Growing operational costs owing to rising fuel costs and driver shortages in the country
- Canada ranked 7th in the Logistics Performance Index due to a rise in investment and infrastructure development
- Growing demand for all modes of transport in Canada owing to rising Government initiatives
- Canada ranks as the 33rd best-connected country in the world as of 2024
- Freight rates increased in 2022 majorly due to high fuel costs, surge in trucking prices, and shortage of drivers
- Canada expands road network with USD 250 million investment and strengthens port efficiency with an investment of USD 75 million
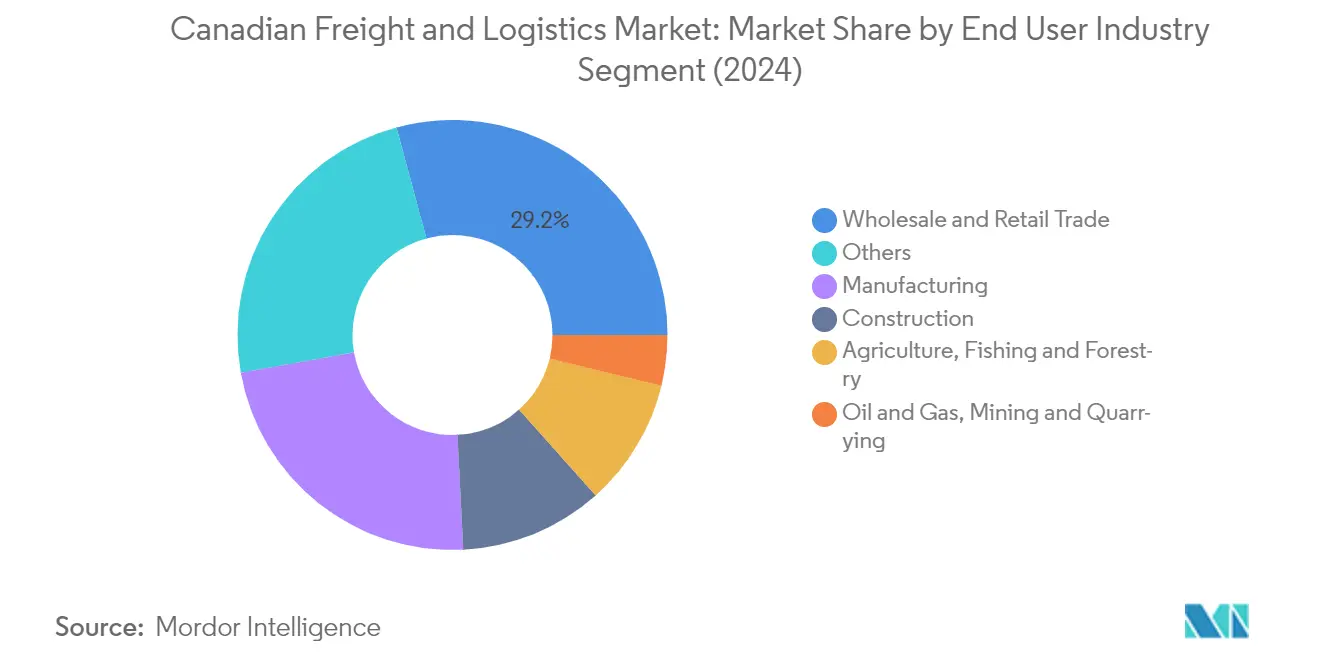
Segment Analysis: End User Industry
Wholesale and Retail Trade Segment in Canadian Freight and Logistics Market
The wholesale and retail trade segment dominates the Canadian freight and logistics market, commanding approximately 29% market share in 2024. This segment's prominence is largely driven by the robust growth in e-commerce sales, which surged by nearly 11% year-over-year in 2023. The segment's strength is further reinforced by the presence of over 1.5 million consumers engaging in online shopping activities. Major retailers across Canada have been actively expanding their digital presence, with companies like Ralph Lauren launching dedicated digital businesses and Aisle 24 expanding its automated grocery chain concept across various locations. The segment's growth is also supported by the increasing adoption of advanced Canadian retail logistics solutions, with retailers investing in automated warehousing systems and last-mile delivery optimization to meet growing consumer demands.
Agriculture, Fishing and Forestry Segment in Canadian Freight and Logistics Market
The agriculture, fishing, and forestry segment is emerging as the fastest-growing segment in the Canadian freight and logistics market for the forecast period 2024-2029. This growth is primarily driven by Canada's strengthening position in the Indo-Pacific region, where fish and seafood exports alone reached a value of USD 2 billion in 2023. The segment's expansion is supported by robust infrastructure developments and strategic trade agreements. Agriculture and Agri-Food Canada's field crop estimates for 2024-2025 project grain exports to reach 49.3 million metric tons, indicating strong growth potential. The segment is also benefiting from increased investment in cold chain logistics for cargo and specialized transportation solutions to maintain product quality during transit.
Remaining Segments in End User Industry
The manufacturing segment maintains a significant presence in the market, driven by the automotive sector and the government's Green Manufacturing Initiative. The construction segment continues to grow through infrastructure development projects and residential construction activities. The oil and gas, mining, and quarrying segment, while smaller, remains crucial for Canada's economy, particularly with ongoing pipeline projects and energy infrastructure developments. The 'Others' segment encompasses various industries including healthcare, technology, and consumer goods, contributing to the market's diversity. Each of these segments benefits from Canada's extensive transportation network and ongoing investments in Canadian freight logistics infrastructure.
Segment Analysis: Logistics Function
Freight Transport Segment in Canada Freight and Logistics Market
The freight transport segment continues to dominate the Canadian freight and logistics market, accounting for approximately 45% of the total market value in 2024. This segment's strong performance is primarily driven by robust road freight operations, which handle about 47% of the total freight tonnage in Canada. The segment's prominence is further reinforced by Canada's extensive transportation infrastructure, including over 1,090,000 kilometers of roads and a well-developed railway network spanning 48,000 kilometers. In 2024, the freight transport segment is witnessing significant developments in sustainable transportation, with the government's initiative to ensure that 35% of medium and heavy-duty vehicle sales are zero-emission by 2030. Additionally, major investments in infrastructure development, including the USD 4.6 billion National Trade Corridors Fund spanning from 2017 to 2028, are strengthening the segment's position in the Canadian logistics market.
Pipeline Transport Segment in Canada Freight and Logistics Market
The pipeline transport segment is emerging as the fastest-growing segment within the freight transport category, projected to grow at approximately 6% annually from 2024 to 2029. This remarkable growth is supported by significant infrastructure developments, including the completion of major pipeline projects like the Trans Mountain Pipeline expansion, which is set to increase capacity by 600,000 barrels per day. The segment is benefiting from substantial investments in new pipeline infrastructure and modernization projects across Canada. The growth is further driven by increasing demand for efficient and safe transportation of oil, natural gas, and other commodities. Recent developments include the implementation of advanced monitoring systems and safety protocols, enhancing the reliability and efficiency of pipeline operations. The segment's expansion is also supported by growing export demands and the government's commitment to strengthening energy infrastructure while maintaining environmental standards.
Remaining Segments in Logistics Function
The Canadian freight and logistics market's remaining segments, including warehousing and storage, freight forwarding, CEP (Courier, Express & Parcel), and other services, each play vital roles in the overall logistics ecosystem. The warehousing and storage segment is experiencing significant transformation with the rise of automated facilities and cold storage solutions, particularly in major urban centers. The freight forwarding segment continues to evolve with digital transformation initiatives and enhanced cross-border services. The CEP segment is witnessing rapid growth due to e-commerce expansion, with companies implementing innovative last-mile delivery solutions and sustainable practices. Other services, including value-added logistics services and supply chain consulting, are becoming increasingly important as businesses seek comprehensive logistics solutions in Canada to meet their complex supply chain needs.
Canada Freight and Logistics Industry Overview
Top Companies in Canada Freight and Logistics Market
The market's leading players are demonstrating a strong commitment to innovation and operational excellence through various strategic initiatives. Leading logistics companies in Canada are heavily investing in digital transformation, with many implementing advanced tracking systems, automated warehousing solutions, and AI-powered logistics platforms to enhance operational efficiency. There's a notable trend toward sustainability, with major players expanding their electric vehicle fleets and developing green logistics solutions. Warehouse automation and cold chain infrastructure development have become key focus areas, particularly in response to growing e-commerce demands. Canadian freight companies are also strengthening their cross-border capabilities through strategic partnerships and infrastructure investments, especially along the US-Canada corridor. The integration of drone delivery systems and autonomous vehicles for last-mile delivery represents another significant innovation trend, while several players are expanding their temperature-controlled logistics capabilities to serve the pharmaceutical and food sectors.
Fragmented Market with Strong Local Presence
The Canadian freight and logistics market exhibits a fragmented structure with a mix of global logistics giants and well-established local players. The market is characterized by the strong presence of government-owned enterprises operating alongside private multinational corporations, creating a diverse competitive landscape. Global players leverage their international networks and technological capabilities, while local operators capitalize on their deep understanding of regional markets and established customer relationships. The market has witnessed significant consolidation activity, particularly in specialized segments like cold chain logistics and e-commerce fulfillment, as companies seek to expand their service portfolios and geographical coverage. Major players are actively pursuing vertical integration strategies, acquiring smaller specialized operators to strengthen their end-to-end logistics capabilities.
The competitive dynamics are further shaped by the presence of asset-light logistics providers competing alongside traditional asset-heavy operators. Companies with strong last-mile delivery capabilities and extensive warehouse networks hold competitive advantages in the rapidly growing e-commerce segment. The market has seen increased participation from technology-focused logistics startups, particularly in urban logistics and specialized delivery services. Cross-border logistics capabilities have become a crucial differentiator, with companies investing in border infrastructure and customs expertise to facilitate US-Canada trade flows. The industry is witnessing growing collaboration between traditional logistics providers and technology companies to enhance digital capabilities and service offerings. Canadian logistics companies with strong last-mile delivery capabilities are particularly well-positioned in this competitive landscape.
Innovation and Sustainability Drive Future Success
Success in the Canadian freight and logistics market increasingly depends on companies' ability to adapt to evolving customer demands and technological advancements. Market leaders are focusing on developing integrated logistics solutions that combine traditional services with digital capabilities. Investment in sustainable practices, including electric vehicle fleets and green warehousing, has become crucial for maintaining a competitive advantage. Companies are also emphasizing the development of specialized capabilities in high-growth segments like healthcare logistics and temperature-controlled transportation. Building strong partnerships with e-commerce platforms and retailers has emerged as a key strategy for capturing market share in the rapidly growing online retail segment. The ability to offer flexible, scalable solutions while maintaining cost efficiency will be crucial for future success.
Regulatory compliance and sustainability requirements are becoming increasingly important factors in shaping competitive strategies. Companies must navigate complex environmental regulations while maintaining operational efficiency. The development of robust risk management capabilities, particularly in cross-border operations, will be crucial for long-term success. Market players are increasingly focusing on building resilient supply chain networks to address potential disruptions. Investment in employee training and development has become essential as the industry becomes more technology-driven. Companies that can effectively combine technological innovation with sustainable practices while maintaining strong customer relationships will be best positioned for future growth in the market. The largest logistics companies in Canada are setting benchmarks in this regard, leading the way with innovative practices.
Canada Freight and Logistics Market Leaders
-
Canada Post Corporation (including Purolator)
-
DHL Group
-
FedEx
-
TFI International Inc.
-
United Parcel Service of America, Inc. (UPS)
- *Disclaimer: Major Players sorted in no particular order

Need More Details on Market Players and Competiters?
Download PDF
Canada Freight and Logistics Market News
- September 2024: DSV completed the acquisition of Schenker from Deutsche Bahn for EUR 14.3 billion (around USD 15.78 billion). Following the acquisition, DSV and Schenker was expected to achieve a combined revenue of about EUR 39.3 billion (USD 43.73 billion) (based on 2023 estimates) and employ roughly 147,000 individuals across over 90 nations. Beyond expanding its global footprint, the Schenker acquisition was expected to enhance DSV's growth trajectory and its commitment to a more sustainable, digital future in transport and logistics.
- September 2024: FedEx partnered with and invested in Nimble, an AI robotics and autonomous e-commerce fulfillment technology company, to scale FedEx Fulfillment with their fully autonomous 3PL model. FedEx offered a comprehensive approach to help e-commerce and omnichannel brands make faster, smarter supply chain decisions. With more than 130 warehouse and fulfillment operations in North America and 475 million returns processed annually, FedEx Supply Chain helped brands consolidate functions, increase agility, and accelerate click-to-door speed to maximize supply chain value. To support this alliance, FedEx invested in Nimble.
- August 2024: FedEx introduced new digital visibility products to enhance the experience for shippers and recipients by merging digital solutions with essential data. These paid solutions catered to the rising market demand for advanced data analytics. These products were crafted to deliver real-time insights and predictive analytics, enhancing the post-purchase journey for customers. Furthermore, FedEx's paid data integration solutions provided access to third-party providers for shipment tracking information, including the Track API, Track EDI, and newly introduced webhook subscriptions, all designed to enhance premium post-purchase tracking and supply chain visibility.
Free With This Report
We provide a complimentary and exhaustive set of data points on global and regional metrics that present the fundamental structure of the industry. Presented in the form of 60+ free charts, the section covers difficult to find data on various regions pertaining to e-commerce industry trends, economic contribution of the transportation & storage sector, export and import trends, maritime connectivity Indices, port calls and performance among other key indicators.


Canada Freight and Logistics Market Report - Table of Contents
1. EXECUTIVE SUMMARY & KEY FINDINGS
2. REPORT OFFERS
3. INTRODUCTION
- 3.1 Study Assumptions & Market Definition
- 3.2 Scope of the Study
- 3.3 Research Methodology
4. KEY INDUSTRY TRENDS
- 4.1 Demographics
- 4.2 GDP Distribution By Economic Activity
- 4.3 GDP Growth By Economic Activity
- 4.4 Inflation
-
4.5 Economic Performance And Profile
- 4.5.1 Trends in E-Commerce Industry
- 4.5.2 Trends in Manufacturing Industry
- 4.6 Transport And Storage Sector GDP
- 4.7 Export Trends
- 4.8 Import Trends
- 4.9 Fuel Price
- 4.10 Trucking Operational Costs
- 4.11 Trucking Fleet Size By Type
- 4.12 Logistics Performance
- 4.13 Major Truck Suppliers
- 4.14 Modal Share
- 4.15 Maritime Fleet Load Carrying Capacity
- 4.16 Liner Shipping Connectivity
- 4.17 Port Calls And Performance
- 4.18 Freight Pricing Trends
- 4.19 Freight Tonnage Trends
- 4.20 Infrastructure
-
4.21 Regulatory Framework (Road and Rail)
- 4.21.1 Canada
-
4.22 Regulatory Framework (Sea and Air)
- 4.22.1 Canada
- 4.23 Value Chain & Distribution Channel Analysis
5. MARKET SEGMENTATION (includes 1. Market value in USD for all segments 2. Market volume for select segments viz. freight transport, CEP (courier, express, and parcel) and warehousing & storage 3. Forecasts up to 2030 and analysis of growth prospects)
-
5.1 End User Industry
- 5.1.1 Agriculture, Fishing, and Forestry
- 5.1.2 Construction
- 5.1.3 Manufacturing
- 5.1.4 Oil and Gas, Mining and Quarrying
- 5.1.5 Wholesale and Retail Trade
- 5.1.6 Others
-
5.2 Logistics Function
- 5.2.1 Courier, Express, and Parcel (CEP)
- 5.2.1.1 By Destination Type
- 5.2.1.1.1 Domestic
- 5.2.1.1.2 International
- 5.2.2 Freight Forwarding
- 5.2.2.1 By Mode Of Transport
- 5.2.2.1.1 Air
- 5.2.2.1.2 Sea and Inland Waterways
- 5.2.2.1.3 Others
- 5.2.3 Freight Transport
- 5.2.3.1 By Mode Of Transport
- 5.2.3.1.1 Air
- 5.2.3.1.2 Pipelines
- 5.2.3.1.3 Rail
- 5.2.3.1.4 Road
- 5.2.3.1.5 Sea and Inland Waterways
- 5.2.4 Warehousing and Storage
- 5.2.4.1 By Temperature Control
- 5.2.4.1.1 Non-Temperature Controlled
- 5.2.4.1.2 Temperature Controlled
- 5.2.5 Other Services
6. COMPETITIVE LANDSCAPE
- 6.1 Key Strategic Moves
- 6.2 Market Share Analysis
- 6.3 Company Landscape
-
6.4 Company Profiles (includes Global Level Overview, Market Level Overview, Core Business Segments, Financials, Headcount, Key Information, Market Rank, Market Share, Products and Services, and Analysis of Recent Developments).
- 6.4.1 Air Tindi Ltd.
- 6.4.2 Algoma Central Corporation
- 6.4.3 C.H. Robinson
- 6.4.4 Canada Post Corporation (including Purolator)
- 6.4.5 Cargojet Inc.
- 6.4.6 Delmar International Inc.
- 6.4.7 Deutsche Bahn AG (including DB Schenker)
- 6.4.8 DHL Group
- 6.4.9 DSV A/S (De Sammensluttede Vognmænd af Air and Sea)
- 6.4.10 Expeditors International of Washington, Inc.
- 6.4.11 FedEx
- 6.4.12 Kuehne+Nagel
- 6.4.13 Lineage Logistics LLC
- 6.4.14 Logistec Corp.
- 6.4.15 TFI International Inc.
- 6.4.16 United Parcel Service of America, Inc. (UPS)
7. KEY STRATEGIC QUESTIONS FOR FREIGHT AND LOGISTICS CEOS
8. APPENDIX
-
8.1 Global Overview
- 8.1.1 Overview
- 8.1.2 Porter’s Five Forces Framework
- 8.1.3 Global Value Chain Analysis
- 8.1.4 Market Dynamics (Market Drivers, Restraints & Opportunities)
- 8.1.5 Technological Advancements
- 8.2 Sources & References
- 8.3 List of Tables & Figures
- 8.4 Primary Insights
- 8.5 Data Pack
- 8.6 Glossary of Terms
- 8.7 Currency Exchange Rate
You Can Purchase Parts Of This Report. Check Out Prices For Specific Sections
Get Price Break-up Now
List of Tables & Figures
- Figure 1:
- POPULATION DISTRIBUTION BY GENDER, COUNT, CANADA, 2017 - 2030
- Figure 2:
- POPULATION DISTRIBUTION BY DEVELOPMENT AREA, COUNT, CANADA, 2017 - 2030
- Figure 3:
- POPULATION DENSITY, POPULATION/SQ. KM, CANADA, 2017 - 2030
- Figure 4:
- GROSS DOMESTIC PRODUCT (GDP) SHARE OF FINAL CONSUMPTION EXPENDITURE (IN CURRENT PRICES), SHARE % OF GDP, CANADA, 2017 - 2023
- Figure 5:
- FINAL CONSUMPTION EXPENDITURE, ANNUAL GROWTH (%), CANADA, 2017 - 2023
- Figure 6:
- POPULATION DISTRIBUTION BY MAJOR CITY, COUNT, CANADA, 2023
- Figure 7:
- DISTRIBUTION OF GROSS DOMESTIC PRODUCT (GDP) BY ECONOMIC ACTIVITY, SHARE %, CANADA, 2023
- Figure 8:
- GROWTH OF GROSS DOMESTIC PRODUCT (GDP) BY ECONOMIC ACTIVITY, CAGR %, CANADA, 2017-2023
- Figure 9:
- WHOLESALE PRICE INFLATION RATE, %, CANADA, 2017 - 2023
- Figure 10:
- CONSUMER PRICE INFLATION RATE, %, CANADA, 2017 - 2023
- Figure 11:
- GROSS MERCHANDISE VALUE (GMV) OF E-COMMERCE INDUSTRY, USD, CANADA, 2017 - 2030
- Figure 12:
- SECTORAL SHARE IN E-COMMERCE INDUSTRY GROSS MERCHANDISE VALUE (GMV), SHARE %, CANADA, 2023
- Figure 13:
- GROSS VALUE ADDED (GVA) OF MANUFACTURING INDUSTRY (IN CURRENT PRICES), USD, CANADA, 2017 - 2023
- Figure 14:
- SECTORAL SHARE IN GROSS VALUE ADDED (GVA) OF MANUFACTURING INDUSTRY, SHARE %, CANADA, 2023
- Figure 15:
- VALUE OF TRANSPORT AND STORAGE SECTOR GROSS DOMESTIC PRODUCT (GDP), USD, CANADA, 2017 - 2023
- Figure 16:
- TRANSPORT AND STORAGE SECTOR GROSS DOMESTIC PRODUCT (GDP), SHARE % OF GDP, CANADA, 2017 - 2023
- Figure 17:
- VALUE OF EXPORTS, USD, CANADA, 2017 - 2023
- Figure 18:
- VALUE OF IMPORTS, USD, CANADA, 2017 - 2023
- Figure 19:
- FUEL PRICE BY TYPE OF FUEL, USD/LITER, CANADA, 2017 - 2023
- Figure 20:
- OPERATIONAL COSTS OF TRUCKING - BREAKDOWN BY OPERATING COST ELEMENT, %, CANADA, 2023
- Figure 21:
- TRUCKING FLEET SIZE BY TYPE, SHARE %, CANADA, 2023
- Figure 22:
- RANK OF LOGISTICS PERFORMANCE, RANK, CANADA, 2010 - 2023
- Figure 23:
- MARKET SHARE OF MAJOR TRUCK SUPPLIER BRANDS, SHARE %, CANADA, 2023
- Figure 24:
- MODAL SHARE OF FREIGHT TRANSPORTATION SECTOR, SHARE % BY TON-KM, CANADA, 2023
- Figure 25:
- MODAL SHARE OF FREIGHT TRANSPORT SECTOR, SHARE % BY TONS, CANADA, 2023
- Figure 26:
- MARITIME FLEET LOAD CARRYING CAPACITY OF COUNTRY FLAGGED VESSELS, DEAD WEIGHT TONNAGE (DWT) BY SHIP TYPE, CANADA, 2017 - 2024
- Figure 27:
- LINER SHIPPING CONNECTIVITY INDEX, BASE=100 FOR Q1 2006, 2016 - 2024
- Figure 28:
- LINER SHIPPING BILATERAL CONNECTIVITY INDEX, CANADA, 2021
- Figure 29:
- PORT LINER SHIP CONNECTIVITY INDEX, BASE=100 FOR Q1 2006, CANADA, 2024
- Figure 30:
- MEDIAN TIME SPENT BY VESSELS WITHIN PORT LIMITS OF THE COUNTRY, DAYS, CANADA, 2018 - 2023
- Figure 31:
- AVERAGE AGE OF VESSELS THAT HAVE CALLED IN THE COUNTRY'S PORTS, YEARS, CANADA, 2018 - 2023
- Figure 32:
- AVERAGE GROSS TONNAGE OF VESSELS ENTERING THE COUNTRY'S PORTS, GROSS TONNAGE (GT), CANADA, 2018 - 2023
- Figure 33:
- AVERAGE CARGO CARRYING CAPACITY OF VESSELS THAT HAVE CALLED IN THE COUNTRY'S PORTS, DEAD WEIGHT TONNAGE (DWT) PER VESSEL, CANADA, 2018 - 2023
- Figure 34:
- AVERAGE CONTAINER CARRYING CAPACITY PER CONTAINER SHIP FOR VESSELS ENTERING THE PORTS, TWENTY-FOOT EQUIVALENT UNITS (TEUS), CANADA, 2018 - 2023
- Figure 35:
- CONTAINER PORT THROUGHPUT, TWENTY-FOOT EQUIVALENT UNITS (TEUS), CANADA, 2016 - 2021
- Figure 36:
- TOTAL NUMBER OF SHIP ARRIVALS IN THE COUNTRY'S PORTS, NUMBER OF PORT CALLS, CANADA, 2018 - 2023
- Figure 37:
- PRICING TREND OF ROAD FREIGHT TRANSPORT SERVICE, USD/TON-KM, CANADA, 2017 - 2023
- Figure 38:
- PRICING TREND OF RAIL FREIGHT TRANSPORT SERVICE, USD/TON-KM, CANADA, 2017 - 2023
- Figure 39:
- PRICING TREND OF AIR FREIGHT TRANSPORT SERVICE, USD/TON-KM, CANADA, 2017 - 2023
- Figure 40:
- PRICING TREND OF SEA AND INLAND WATERWAYS FREIGHT TRANSPORT SERVICE, USD/TON-KM, CANADA, 2017 - 2023
- Figure 41:
- PRICING TREND OF PIPELINES FREIGHT TRANSPORT SERVICE, USD/TON-KM, CANADA, 2017 - 2023
- Figure 42:
- FREIGHT HANDLED BY ROAD TRANSPORT, TONS, CANADA, 2017 - 2030
- Figure 43:
- FREIGHT HANDLED BY RAIL TRANSPORT, TONS, CANADA, 2017 - 2030
- Figure 44:
- FREIGHT HANDLED BY AIR TRANSPORT, TONS, CANADA, 2017 - 2030
- Figure 45:
- FREIGHT HANDLED BY SEA AND INLAND WATERWAYS TRANSPORT, TONS, CANADA, 2017 - 2030
- Figure 46:
- FREIGHT HANDLED BY PIPELINES TRANSPORT, TONS, CANADA, 2017 - 2030
- Figure 47:
- LENGTH OF ROADS, KM, CANADA, 2017 - 2022
- Figure 48:
- SHARE OF ROAD LENGTH BY SURFACE CATEGORY, %, CANADA, 2022
- Figure 49:
- SHARE OF ROAD LENGTH BY ROAD CLASSIFICATION, %, CANADA, 2022
- Figure 50:
- RAIL LENGTH, KM, CANADA, 2017 - 2022
- Figure 51:
- CONTAINERS HANDLED AT MAJOR PORTS, TWENTY-FOOT EQUIVALENT UNITS (TEUS), CANADA, 2022
- Figure 52:
- CARGO WEIGHT HANDLED AT MAJOR AIRPORTS, TONS, CANADA, 2022
- Figure 53:
- VALUE OF FREIGHT AND LOGISTICS MARKET, USD, CANADA, 2017 - 2030
- Figure 54:
- VALUE OF FREIGHT AND LOGISTICS MARKET BY END USER INDUSTRY, USD, CANADA, 2017 - 2030
- Figure 55:
- VALUE SHARE OF FREIGHT AND LOGISTICS MARKET BY END USER INDUSTRY, %, CANADA, 2017 - 2030
- Figure 56:
- VALUE OF AFF INDUSTRY (AGRICULTURE, FISHING AND FORESTRY) LOGISTICS MARKET, USD, CANADA, 2017 - 2030
- Figure 57:
- CAGR OF AFF INDUSTRY (AGRICULTURE, FISHING AND FORESTRY) LOGISTICS MARKET, %, CANADA, 2017 - 2030
- Figure 58:
- VALUE OF CONSTRUCTION LOGISTICS MARKET, USD, CANADA, 2017 - 2030
- Figure 59:
- CAGR OF CONSTRUCTION LOGISTICS MARKET, %, CANADA, 2017 - 2030
- Figure 60:
- VALUE OF MANUFACTURING LOGISTICS MARKET, USD, CANADA, 2017 - 2030
- Figure 61:
- CAGR OF MANUFACTURING LOGISTICS MARKET, %, CANADA, 2017 - 2030
- Figure 62:
- VALUE OF EXTRACTIVE INDUSTRY (OIL AND GAS, MINING AND QUARRYING) LOGISTICS MARKET, USD, CANADA, 2017 - 2030
- Figure 63:
- CAGR OF EXTRACTIVE INDUSTRY (OIL AND GAS, MINING AND QUARRYING) LOGISTICS MARKET, %, CANADA, 2017 - 2030
- Figure 64:
- VALUE OF DISTRIBUTIVE TRADE (WHOLESALE AND RETAIL TRADE) LOGISTICS MARKET, USD, CANADA, 2017 - 2030
- Figure 65:
- CAGR OF DISTRIBUTIVE TRADE (WHOLESALE AND RETAIL TRADE) LOGISTICS MARKET, %, CANADA, 2017 - 2030
- Figure 66:
- VALUE OF OTHER END USERS LOGISTICS MARKET, USD, CANADA, 2017 - 2030
- Figure 67:
- CAGR OF OTHER END USER LOGISTICS MARKET, %, CANADA, 2017 - 2030
- Figure 68:
- VALUE OF FREIGHT AND LOGISTICS MARKET BY LOGISTICS FUNCTION, USD, CANADA, 2017 - 2030
- Figure 69:
- VALUE SHARE OF FREIGHT AND LOGISTICS MARKET BY LOGISTICS FUNCTION, %, CANADA, 2017 - 2030
- Figure 70:
- VALUE OF COURIER, EXPRESS, AND PARCEL (CEP) MARKET BY DESTINATION TYPE, USD, CANADA, 2017 - 2030
- Figure 71:
- VALUE SHARE OF COURIER, EXPRESS, AND PARCEL (CEP) MARKET BY DESTINATION TYPE, %, CANADA, 2017 - 2030
- Figure 72:
- VALUE OF DOMESTIC COURIER, EXPRESS, AND PARCEL (CEP) MARKET, USD, CANADA, 2017 - 2030
- Figure 73:
- VOLUME OF DOMESTIC COURIER, EXPRESS, AND PARCEL (CEP) MARKET, NUMBER OF PARCELS, CANADA, 2017 - 2030
- Figure 74:
- VALUE SHARE OF DOMESTIC COURIER, EXPRESS, AND PARCEL (CEP) MARKET BY END USER INDUSTRY, %, CANADA, 2024 VS 2030
- Figure 75:
- VALUE OF INTERNATIONAL COURIER, EXPRESS, AND PARCEL (CEP) MARKET, USD, CANADA, 2017 - 2030
- Figure 76:
- VOLUME OF INTERNATIONAL COURIER, EXPRESS, AND PARCEL (CEP) MARKET, NUMBER OF PARCELS, CANADA, 2017 - 2030
- Figure 77:
- VALUE SHARE OF INTERNATIONAL COURIER, EXPRESS, AND PARCEL (CEP) MARKET BY END USER INDUSTRY, %, CANADA, 2024 VS 2030
- Figure 78:
- VALUE OF FREIGHT FORWARDING MARKET BY MODE OF TRANSPORT, USD, CANADA, 2017 - 2030
- Figure 79:
- VALUE SHARE OF FREIGHT FORWARDING MARKET BY MODE OF TRANSPORT, %, CANADA, 2017 - 2030
- Figure 80:
- VALUE OF AIR FREIGHT FORWARDING MARKET, USD, CANADA, 2017 - 2030
- Figure 81:
- VALUE SHARE OF AIR FREIGHT FORWARDING MARKET BY END USER INDUSTRY, %, CANADA, 2024 VS 2030
- Figure 82:
- VALUE OF SEA AND INLAND WATERWAYS FREIGHT FORWARDING MARKET, USD, CANADA, 2017 - 2030
- Figure 83:
- VALUE SHARE OF SEA AND INLAND WATERWAYS FREIGHT FORWARDING MARKET BY END USER INDUSTRY, %, CANADA, 2024 VS 2030
- Figure 84:
- VALUE OF OTHERS FREIGHT FORWARDING MARKET, USD, CANADA, 2017 - 2030
- Figure 85:
- VALUE SHARE OF FREIGHT FORWARDING MARKET'S OTHERS SEGMENT BY END USER INDUSTRY, %, CANADA, 2024 VS 2030
- Figure 86:
- VOLUME OF FREIGHT TRANSPORT MARKET BY MODE OF TRANSPORT, TON-KM, CANADA, 2017 - 2030
- Figure 87:
- VALUE OF FREIGHT TRANSPORT MARKET BY MODE OF TRANSPORT, USD, CANADA, 2017 - 2030
- Figure 88:
- VALUE SHARE OF FREIGHT TRANSPORT MARKET BY MODE OF TRANSPORT, %, CANADA, 2017 - 2030
- Figure 89:
- VALUE OF AIR FREIGHT TRANSPORT MARKET, USD, CANADA, 2017 - 2030
- Figure 90:
- VOLUME OF AIR FREIGHT TRANSPORT MARKET, TON-KM, CANADA, 2017 - 2030
- Figure 91:
- VALUE SHARE OF AIR FREIGHT TRANSPORT MARKET BY END USER INDUSTRY, %, CANADA, 2024 VS 2030
- Figure 92:
- VALUE OF PIPELINES FREIGHT TRANSPORT MARKET, USD, CANADA, 2017 - 2030
- Figure 93:
- VOLUME OF PIPELINES FREIGHT TRANSPORT MARKET, TON-KM, CANADA, 2017 - 2030
- Figure 94:
- VALUE SHARE OF PIPELINES FREIGHT TRANSPORT MARKET BY END USER INDUSTRY, %, CANADA, 2024 VS 2030
- Figure 95:
- VALUE OF RAIL FREIGHT TRANSPORT MARKET, USD, CANADA, 2017 - 2030
- Figure 96:
- VOLUME OF RAIL FREIGHT TRANSPORT MARKET, TON-KM, CANADA, 2017 - 2030
- Figure 97:
- VALUE SHARE OF RAIL FREIGHT TRANSPORT MARKET BY END USER INDUSTRY, %, CANADA, 2024 VS 2030
- Figure 98:
- VALUE OF ROAD FREIGHT TRANSPORT MARKET, USD, CANADA, 2017 - 2030
- Figure 99:
- VOLUME OF ROAD FREIGHT TRANSPORT MARKET, TON-KM, CANADA, 2017 - 2030
- Figure 100:
- VALUE SHARE OF ROAD FREIGHT TRANSPORT MARKET BY END USER INDUSTRY, %, CANADA, 2024 VS 2030
- Figure 101:
- VALUE OF SEA AND INLAND WATERWAYS FREIGHT TRANSPORT MARKET, USD, CANADA, 2017 - 2030
- Figure 102:
- VOLUME OF SEA AND INLAND WATERWAYS FREIGHT TRANSPORT MARKET, TON-KM, CANADA, 2017 - 2030
- Figure 103:
- VALUE SHARE OF SEA AND INLAND WATERWAYS FREIGHT TRANSPORT MARKET BY END USER INDUSTRY, %, CANADA, 2024 VS 2030
- Figure 104:
- VALUE OF WAREHOUSING AND STORAGE MARKET BY TEMPERATURE CONTROL, USD, CANADA, 2017 - 2030
- Figure 105:
- VALUE SHARE OF WAREHOUSING AND STORAGE MARKET BY TEMPERATURE CONTROL, %, CANADA, 2017 - 2030
- Figure 106:
- VALUE OF NON-TEMPERATURE CONTROLLED WAREHOUSING AND STORAGE MARKET, USD, CANADA, 2017 - 2030
- Figure 107:
- VOLUME OF NON-TEMPERATURE CONTROLLED WAREHOUSING AND STORAGE MARKET, SQUARE FEET, CANADA, 2017 - 2030
- Figure 108:
- VALUE SHARE OF NON-TEMPERATURE CONTROLLED WAREHOUSING AND STORAGE MARKET BY END USER INDUSTRY, %, CANADA, 2024 VS 2030
- Figure 109:
- VALUE OF TEMPERATURE CONTROLLED WAREHOUSING AND STORAGE MARKET, USD, CANADA, 2017 - 2030
- Figure 110:
- VOLUME OF TEMPERATURE CONTROLLED WAREHOUSING AND STORAGE MARKET, SQUARE FEET, CANADA, 2017 - 2030
- Figure 111:
- VALUE SHARE OF TEMPERATURE CONTROLLED WAREHOUSING AND STORAGE MARKET BY END USER INDUSTRY, %, CANADA, 2024 VS 2030
- Figure 112:
- VALUE OF OTHER SERVICES SEGMENT OF FREIGHT AND LOGISTICS MARKET, USD, CANADA, 2017 - 2030
- Figure 113:
- CAGR OF OTHER SERVICES (VALUE ADDED SERVICES) LOGISTICS MARKET, %, CANADA, 2017 - 2030
- Figure 114:
- MOST ACTIVE COMPANIES BY NUMBER OF STRATEGIC MOVES, COUNT, CANADA, 2017 - 2023
- Figure 115:
- MOST ADOPTED STRATEGIES, COUNT, CANADA, 2017 - 2023
- Figure 116:
- VALUE SHARE OF MAJOR PLAYERS, %, CANADA
Canada Freight and Logistics Industry Segmentation
Agriculture, Fishing, and Forestry, Construction, Manufacturing, Oil and Gas, Mining and Quarrying, Wholesale and Retail Trade, Others are covered as segments by End User Industry. Courier, Express, and Parcel (CEP), Freight Forwarding, Freight Transport, Warehousing and Storage are covered as segments by Logistics Function.| End User Industry | Agriculture, Fishing, and Forestry | |||
| Construction | ||||
| Manufacturing | ||||
| Oil and Gas, Mining and Quarrying | ||||
| Wholesale and Retail Trade | ||||
| Others | ||||
| Logistics Function | Courier, Express, and Parcel (CEP) | By Destination Type | Domestic | |
| International | ||||
| Freight Forwarding | By Mode Of Transport | Air | ||
| Sea and Inland Waterways | ||||
| Others | ||||
| Freight Transport | By Mode Of Transport | Air | ||
| Pipelines | ||||
| Rail | ||||
| Road | ||||
| Sea and Inland Waterways | ||||
| Warehousing and Storage | By Temperature Control | Non-Temperature Controlled | ||
| Temperature Controlled | ||||
| Other Services | ||||
Need A Different Region or Segment?
Customize Now
Market Definition
- Agriculture, Fishing, and Forestry (AFF) - This end user industry segment captures the external (outsourced) logistics expenditure incurred by the AFF industry players. The end user players considered are the establishments primarily engaged in growing crops, raising animals, harvesting timber, harvesting fish & other animals from their natural habitats and providing related support activities. Herein, Logistics Service Providers (LSPs) play a crucial role in acquisition, storage, handling, transportation, and distribution activities for the optimal & continuous flow of inputs (seeds, pesticides, fertilizers, equipment, and water) from manufacturers or suppliers to the producers and smooth flow of output (produce, agro-goods) to distributors/ consumers. This includes both termperature controlled and non-temperature controlled logistics, as and when required according to the shelf life of goods being transported or stored.
- Construction - This end user industry segment captures the external (outsourced) logistics expenditure incurred by the construction industry players. The end user players considered are the establishments primarily engaged in constructing, repairing and renovating residential & commercial buildings, infrastructure, engineering works, subdividing and developing land. Logistics Service Providers (LSPs) play a crucial role in increasing profitability of construction projects by maintaing the inventory of raw materials & equipment, time-critical supplies and by providing other value added services for effective project management.
- Courier, Express, and Parcel - The Courier, Express, and Parcel services, often called as CEP Market, refers to the logistics and postal service providers which specialize in moving small goods (parcels/packages). It captures the overall market size (USD) and market volume (number of parcels) of (1) the shipments/parcels/packages which are under 70kgs/ 154lbs weight, (2) Business Customer packages viz. Business-to-Business (B2B) & Business-to-Consumer (B2C) as well as private customer packages (C2C), (3) non-express parcel delivery services (Standard and Deferred) as well as express parcel delivery services (Day-Definite-Express and Time-Definite-Express), (4) domestic as well as international parcels.
- Demographics - To analyse total addressable market demand, population growth & forecasts have been studied and presented in this industry trend. It represents population distribution across categories like gender (male/female), development area (urban/rural), major cities among other key parameters like population density and final consumption expenditure (growth and share % of GDP). This data has been used for assessing the fluctations in demand & consumption expenditure, and the major hotspots (cities) of potential demand.
- Export Trends and Import Trends - Overall logistics performance of an economy is positively and significantly (statistically) correlated to its trade performance (exports and imports). Hence, in this industry trend, total value of trade, major commodities/ commodity groups and the major trade partners, for the studied geography (country or region as per the scope of report) have been analysed alongside the impact of major trade/logistics infrastructure investments & regulatory environment.
- Freight Forwarding - Freight forwarding which herein refers to the freight transportation arrangement (FTA) industry includes establishments primarily engaged in arranging & tracking transportation of freight between shippers and carriers. Logistics Service Providers (LSPs) considered are freight forwarders, NVOCCs, custom brokers and marine shipping agents. Others segment under Freight Forwarding captures the revenue earned through value added services of FTA like custom brokerage/clearance activities, preparation of freight related documentation, consolidation-deconsolidation of goods, cargo insurance & compliance, arrangement of warehousing & storage, liasing with shippers, and freight forwarding through other modes of transport viz. road and rail.
- Freight Pricing Trends - Freight pricing by mode of transport (USD/tonkm), over the review period, has been presented in this industry trend. The data has been used in assessing the inflationary environment, impact on trade, freight turnover (tonkm), freight and logistics market demand by mode of transport segments and hence the overall freight and logistics market size.
- Freight Tonnage Trends - Freight tonnage (weight of goods in tons) handled by mode of transport, over the review period, has been presented in this industry trend. The data has been used as one of the parameters apart from average distance per shipment (km), freight volume (tonkm), and freight pricing (USD/tonkm) to assess the freight transport market size.
- Freight Transport - Freight Transport refers to the hiring of a logistics service provider (outsourced logistics) for the transport of commodities (raw materials/final/intermediate/finished goods including both solids and fluids) from the origin to a destination within the country (domestic) or cross-border (international).
- Freight and Logistics - External expenditure on (or outsourced) facilitation of freight transport (freight transportation), arrangement of freight transport through an agent (freight forwarding), warehousing and storage (temperature controlled or non-temperature controlled), CEP (domestic or international courier, express and parcel) and other value-added logistics services involved in the transportation of commodities (raw materials or finished goods including both solids and fluids) from the origin to a destination within the country (domestic) or cross-border (international), through one or more modes of transportation viz. road, rail, sea, air and pipelines constitute freight and logistics market.
- Fuel Price - Fuel price spikes can cause delays and diruption for logistics service providers (LSPs), while drops in the same can result in higher short-term profitability and increased market rivalry to offer consumers with the best deals. Hence, the fuel price variations have been studied over the review period and presented along with the causes as well as market impacts.
- GDP Distribution by Economic Activity - Nominal Gross Domestic Product and distribution of the same, across major economic sectors in the geography studied (country or region as per scope of the report) have been studied and presented in this industry trend. As GDP is positively related to the profitability and growth of logistics industry, this data has been used in adjunction to the input-output tables/ supply-use tables for analyzing the potential major contributing sectors towards the logistics demand.
- GDP Growth by Economic Activity - Growth of Nominal Gross Domestic Product across major economic sectors, for the geography studied (country or region as per scope of the report) have been presented in this industry trend. This data has been utilized for assessing the growth of logistics demand from all the market end users (economic sectors considered here).
- Inflation - Variations in both Wholesale Price Inflation (YoY change in producer price index) and Consumer Price Inflation have been presented in this industry trend. This data has been used to assess the inflationary environment as it plays a vital role in smooth functioning of the supply chain, directly impacting the logistics operational cost components e.g., pricing of tyres, driver wages & benefits, energy/fuel prices, maintenace costs, toll charges, warehousing rents, custom brokerage, forwarding rates, courier rates etc. hence impacting the overall freight and logistics market.
- Infrastructure - As infrastructure plays a vital role in an economy's logistics performance, variables like length of roads, distribution of road length by surface category (paved v/s unpaved), distribution of road length by road classification (expressways v/s highways v/s other roads), rail length, volume of containers handled by major ports and tonnage handled by major airports have been analysed and presented in this industry trend.
- Key Industry Trends - The report section named "Key Industry Trends" include all the key variables/parameters studied to better analyze the market size estimates and forecasts. All the trends have been presented in the form of data points (time series or latest available data points) along with analysis of the paramter in the form of concise market relevant commentary, for the geography studied (country or region as per the scope of report).
- Key Strategic Moves - The action taken by a company to differentiate from its competitor or used as a general strategy is referred to as a key strategic move (KSM). This includes (1) Agreements (2) Expansions (3) Financial Restructuring (4) Mergers and Acquisitions (5) Partnerships, and (6) Product Innovations. Key players (Logistics Service Providers, LSPs) in the market have been shortlisted, their KSM have been studied and presented in this section.
- Liner Shipping Bilateral Connectivity Index - It indicates a country pair's integration level into global liner shipping networks and plays a crucial role in determining bilateral trade, which in turn potentially contributes toward the prosperity of a country and its surrounding region. Hence the major economies connected to the country/ region as per scope of the report, have been analyzed and presented in "Liner Shipping Connectivity" industry trend.
- Liner Shipping Connectivity - This industry trend analyses the state of connectivity to the global shipping networks based on the status of maritime transport sector. It includes the analysis of liner shipping connectivity, bilateral shipping connectivity, and port liner shipping connectivity indices for the geography (country/ region as per scope of the report) over the review period.
- Liner Shipping Connectivity Index - It indicates how well countries are connected to global shipping networks based on the status of their maritime transport sector. It is based on five components of the maritime transport sector: (1) The number of shipping lines servicing a country, (2) The size of the largest vessel used on these services (in TEUs), (3) The number of services connecting a country to the other countries, (4) The total number of vessels deployed in a country, (5) The total capacity of those vessels (in TEUs).
- Logistics Performance - Logistics Performance and Logistics Costs are the backbone of trade, and influences trade costs, making countries compete globally. Logistics performance is influenced by market wide adopted supply chain management strategies, government services, investments & policies, fuel/ energy costs, inflationary environment etc. Hence, in this industry trend, the logistics performance of the geography studied (country/ region as per the scope of report) has been analysed and presented over the review period.
- Major Truck Suppliers - Market share of truck brands is influenced by factors like geographical preferences, portfolio of truck types, truck prices, local production, truck repair & maintenance service peneteration, customer support, technological innovations (like electric vehicles, digitalization, autonomous trucks), fuel efficiency, financing options, annual maintenance costs, availability of substitutes, marketing startegies etc. Hence, the distribution (share % for base year of the study) of truck sales volume for leading truck brands and commentary on current market scenario & market anticipation over the forecast period have been presented in this industry trend.
- Manufacturing - This end user industry segment captures the external (outsourced) logistics expenditure incurred by the Manufacturing industry players. The end user players considered are the establishments primarily engaged in the chemical, mechanical or physical transformation of materials or substances into new products. Logistics Service Providers (LSPs) play a crucial role in maintaining a smooth flow of raw materials across the supply chain, enabling timely delivery of finished goods to distributors or end customers and storing & supplying the raw materials to clients for just-in-time manufacturing.
- Maritime Fleet Load Carrying Capacity - Maritime fleet load carrying capacity depicts the development state of an economy's maritime infrastructure & trade. It is influenced by factors like volume of production, international trade, major end user industries, maritime connectivity, environmental regulations, investments in port infrastructure development, port container cargo handling capacity etc. This industry trend represents the maritime fleet load carrying capacity by type of ship viz. container ships, oil tankers, bulk carriers, general cargo, among other types alongwith the influencing factors for the geography studied (country/ region as per scope of the report), over the review period.
- Modal Share - Freight Modal Share is influenced by factors like modal productivity, government regulations, containerization, distance of shipment, temperature control requirements, type of goods, international trade, terrain, speed of delivery, shipment weight, bulk shipments, etc. Also, modal share by tonnage (tons) and modal share by freight turnover (ton-km) differ as per average distance of shipments, weight of major commodity groups transported in the economy and number of trips. This industry trend represents the distribution of freight transported by mode of transport (tons as well as ton-km), for the study base year.
- Oil and Gas, Mining and Quarrying - This end user industry segment captures the external (outsourced) logistics expenditure incurred by the extraction industry players. The end user players considered are the establishments that extract naturally occurring mineral solids, such as coal and ores; liquid minerals, such as crude petroleum; and gases, such as natural gas. Logistics Service Providers (LSPs) covers entire phases from upstream to downstream and plays a crucial role in the transportation of machinery, drilling equipments, extracted minerals, crude oil & natural gas and refined/ processed products from one place to another.
- Other End Users - Other end user segment captures the external (outsourced) logistics expenditure incurred by the financial services (BFSI), real estate, educational services, healthcare, and professional services (administrative, waste management, legal, architectural, engineering, design, consulting, scientific R&D). Logistics Service Providers (LSPs) plays a crucial role in the reliable movement of supplies and documents to/from these industries such as transporting any equipment or resources required, shipping confidential documents and files, movement of medical goods & supplies (surgical supplies and instruments, including gloves, masks, syringes, equipment) to name a few.
- Other Services - Other Services segment captures revenue earned through (1) Value added services (VAS) for freight transportation by road, rail, air and sea & inland waterways, (2) VAS for marine cargo transportation (operation of terminal facilities such as harbours and piers, operation of waterway locks, navigation, pilotage and berthing activities, lighterage, salvage activities, lighthouse activities, among other miscellaneous support activities), (3) VAS for land freight transportation (operation of terminal facilities such as railway stations, stations for the handling of goods, operation of railroad infrastructure, switching and shunting, towing and road side assistance, liquefaction of gas for transportation purposes, among other miscellaneous support activities), (4) VAS for air cargo transportation (operation of terminal facilities such as airway terminals, airport and air-traffic-control activities, ground service activities on airfields, runway maintenance, inspection/ ferrying/ maintenance/ testing of aircrafts, aircraft fuelling services, among other miscellaneous support activities), (5) VAS for warehousing and storage service (operation of grain silos, general merchandise warehouses, refrigerated warehouses, storage tanks etc., storage of goods in foreign trade zones, blast freezing, crating goods for shipping, packing and preparing goods for shipping, labelling and/or imprinting the package, kit assembling and packaging services, among other miscellaneous support activities), and (6) VAS for courier, express and parcel service (pickup, sorting).
- Port Calls and Performance - The performance of ports is key to an economy's freight movement, trade, global connectivity, successful growth strategies, investment attractiveness for production & distribution systems, and thus affects GDP, employment, per capita income and industrial growth. Hence, the port perfomance parameters like median time spent by vessels in the ports; average age, size, cargo carrying capacity, container carrying capacity, of vessels entering the ports, port calls, and container port throughput have been analysed and presented in this industry trend.
- Port Liner Shipping Connectivity Index - It reflects a port's position in the global liner shipping network, wherein a higher value of index is associated with better connectivity. Efficient and well-connected ports (1) contribute towards minimizing transport costs, linking supply chains and supporting international trade, (2) pave the way for economies of scale and development of expertise by permitting producers to better exploit possibilities in domestic as well as foreign markets. Hence the major ports of strategic importance, in the country/ region as per scope of the report, have been analyzed and presented in "Liner Shipping Connectivity" industry trend.
- Port Throughput - It reflects the amount of cargo or number of vessels a port handles annually. It can be related to (1) cargo tonnage, (2) container TEU, and (3) vessel calls. Port throughput in terms of total containers handled (TEU's), has been presented in the "Port Calls and Performance" industry trend.
- Producer Price Inflation - It indicates inflation from viewpoint of the producers viz. the average selling price received for their output over a period of time. Annual change (YoY) of producer price index is reported as wholesale price inflation in the "Inflation" industry trend. As WPI captures dynamic price movements in most comprehensive way, it is widely used by governments, banks, industry, business circles and is deemed important in formulation of trade, fiscal and other economic policies. The data has been used in adjunction to consumer price inflation for better understanding the inflationary environment.
- Segmental Revenue - Segmental Revenue has been triangulated or computed and presented for all the major players in the market. It refers to the freight and logistics market specific revenue earned by the company, over the base year of study, in the geography studied (country or region as per the scope of report). It is computed through the study and analysis of major parameters like financials, service portfolio, employee strength, fleet size, investments, number of countries present in, major economies of concern, etc. that have been reported by the company in its annual reports, webpage. For companies having scarce financial disclosures, paid databases like D&B Hoovers, Dow Jones Factiva have been resorted to and verified through industry/expert interactions.
- Transport and Storage Sector GDP - Value and growth of Transport and Storage Sector GDP has a direct relation to the freight and logistics market size. Hence, this variable has been studied and presented over the review period, in value terms (USD) and as share % of total GDP, in this industry trend. The data has been supported by concise and relevant commentary around the investments, developments, and current market scenario.
- Trends in E-Commerce Industry - Enhanced internet connectivity and boom in smartphone penetration, coupled with increasing disposable incomes, has led to a phenomenal growth in the e-commerce market globally. Online shoppers require fast and efficient delivery of their orders leading to an increase in the demand for logistics services especially e-commerce fulfilment services. Hence, the Gross Merchandise Value (GMV), historial and projected growth, breakup of major commodity groups in e-commerce industry for the studied geography (country or region as per scope of the report) have been analysed and presented in this industry trend.
- Trends in Manufacturing Industry - Manufacturing industry involves the transformation of raw materials into finished products, while logistics industry ensures the efficient flow of raw materials to the factory, and the transport of manufactured products to the distributors & consumers. Demand-Supply of both industries are highly cross-linked and critical for a seamless supply chain. Hence, the Gross Value Added (GVA), breakup of GVA into major manufacturing sectors, and growth of manufacturing industry over the review period have been analysed and presented, in this industry trend.
- Trucking Fleet Size By Type - Market share of truck types is influenced by factors like geographical preferences, major end user industries, truck prices, local production, truck repair & maintenance service peneteration, customer support, technological disruptions (like electric vehicles, digitalization, autonomous trucks) etc. Hence, the distribution (share % for base year of study) of truck parc volume by type of truck, market disruptors, truck manufacturing investments, truck specifications, truck use & import regulations, and market anticipation over the forecast period have been presented in this industry trend.
- Trucking Operational Costs - The prime reasons for measuring/ benchmarking logistics performance of any trucking company are to reduce operational costs and increase profitability. On the other hand, measuring operational costs helps to identify whether and where to make operational changes to control expenses and identify areas for improved performance. Hence, in this industry trend, trucking operational costs and the variables involved viz. driver wages & benefits, fuel prices, repairs & maintenance costs, tyre costs etc. have been studied over the base year of study, and presented for the geography studied (country or region as per the scope of report).
- Warehousing and Storage - Warehousing and storage segment captures revenue earned through the operation of general merchandise, refrigerated and other types of warehousing & storage facilities. These establishments take responsibility for storing the goods and keeping them secure in lieu of charges. Value added services (VAS) they may provide are considered to be a part of the "other services" segment. Here VAS refer to a range of services, related to the distribution of a customer's goods and can include labelling, breaking bulk, inventory control & management, light assembly, order entry & fulfillment, packaging, pick & pack, price marking & ticketing and transportation arrangement.
- Wholesale and Retail Trade - This end user industry segment captures the external (outsourced) logistics expenditure incurred by the wholesalers and retailers. The end user players considered are the establishments primarily engaged in wholesaling or retailing merchandise, generally without transformation, and rendering services incidental to the sale of merchandise. Logistics Service Providers (LSPs) plays a crucial role in the reliable movement of supplies to and finished products from production houses to the distributors and finally to the end customer covering activites like material sourcing, transportation, order fulfillment, warehousing & storage, demand forecasting, inventory management etc.
| Keyword | Definition |
|---|---|
| Axle Load | The axle load of a wheeled vehicle is the total weight bearing on the roadway for all wheels connected to a given axle. |
| Back Haul | Backhaul is the return movement of a transport vehicle from its original destination to its original point of departure. |
| Bill of Lading | A bill of lading is a legal document issued by a carrier to a shipper that details the type, quantity, and destination of the goods being carried. |
| Bunkering | Bunkering is the process of supplying fuel and/or gasoil to be used to power the propulsion system of a ship (such fuel is referred to as bunker). It includes the logistics of loading and distributing the fuel among available shipboard tanks. A person dealing in trade of bunker (fuel) is called a bunker trader. |
| Bunkering Service | Bunkering service is the supply of a requested quality and quantity of bunkers to a ship. |
| C-commerce | C-commerce (Collaborative commerce) describes electronically enabled business interactions among an enterprise’s internal personnel, business partners and customers throughout a trading community. The trading community could be an industry, industry segment, supply chain or supply chain segment. |
| Cabotage | Transport by a vehicle registered in a country performed on the national territory of another country. |
| Cartage Agent | A ground transportation service that provides pickup and delivery of freight in locations not served directly by an air or ocean carrier. |
| Contract logistics | Contract logistics refers to the outsourcing of resource management tasks by one company to a third-party company specializing in logistical matters, such as transportation, warehousing, and order fulfillment. |
| Courier | A business that is used to send messages, packages, etc. Courier service refers to the fast or quick, door to door pickup and delivery service for goods or documents. It can be local or international. A company that provides such delivery services is called a courier company. A courier company hires people to provide their services. Such a person hired by the courier service company is called a courier. |
| Cross docking | Cross docking is a practice in logistics management that includes unloading incoming delivery vehicles and loading the materials directly into outbound delivery vehicles, omitting traditional warehouse logistical practices and saving time and money. |
| Cross Trade | International transport between two different countries performed by a vehicle registered in a third country. A third country is a country other than the country of loading/embarkation and than the country of unloading/disembarkation. |
| Customs Clearance | The procedures involved in getting cargo released by Customs through designated formalities such as presenting import license/permit, payment of import duties and other required documentations by the nature of the cargo such as FCC or FDA approval. |
| Customs seal | Customs seal means a seal, stamp or any other preventive means affixed by customs officials to ensure the inviolability of goods, commercial means of transport or warehouses. |
| Dangerous Goods | Dangerous goods (or hazardous materials or HAZMAT) include flammable liquids/solids, gases, compressed, liquified, dissolved under pressure, corrosives, oxidising substances, explosive substances and articles, substances, which on contact with water, emit flammable gasses, organic peroxides, toxic substances, infectious substances, radioactive materials, miscellaneous dangerous goods and articles. |
| Direct Shipment | Direct shipment is a method of delivering goods from the supplier or the product owner to the customer directly. In most cases, the customer orders the goods from the product owner. This delivery scheme reduces transportation and storage costs, but requires additional planning and administration. |
| Drayage | A drayage is a form of trucking service that connects the different modes of shipping (intermodal), such as ocean freight or air freight. It’s a short-haul trip that transports goods from one place to another, usually before or after its long-haul shipping process. Drayage trucks move cargo to and from various destinations, such as container ships, storage lots, order fulfillment warehouses, and rail yards. Typically, drayage only transports goods in short distances and operates only in one metropolitan area. It also requires only one trucker in a single shift. |
| Dry Docking | Dry docking is a term used for repairs or when a ship is taken to the service yard. During dry docking, the whole ship is brought to a dry land so that the submerged portions of the hull can be cleaned or inspected. |
| Dry van | A dry van is a type of semi-trailer that's fully enclosed to protect shipments from outside elements. Designed to carry palletized, boxed or loose freight, dry vans aren't temperature-controlled (unlike refrigerated “reefer” units) and can't carry oversized shipments (unlike flatbed trailers). |
| Feedering | Transport service whereby loaded or empty containers in a regional are transferred to a “mother ship” for a long-haul ocean voyage. |
| Final Demand | Final demand includes all types of commodities (goods as well as services) consumed as final use and might include personal consumption, or consumption by government, by businesses as capital investment, and as exports. includes all types of commodities (goods as well as services) consumed as final use and might include personal consumption, or consumption by government, by businesses as capital investment, and as exports. |
| First mile Delivery | First mile delivery refers to the first stage of the transportation. This is when the parcel leaves the seller’s warehouse and is taken by the courier pick up agent to process it or take it to the warehouse. Once the package reaches the post office or the courier’s hub, it is then sorted and transported further until it reaches the customer’s doorstep. |
| Fiscal storage services | It means a facility, clearly separated from other premises, where the excise goods are produced, processed, held, received or dispatched under a duty suspension arrangement by an authorized depositor, in the course of his business, under conditions laid down by the customs authorities. |
| Flat Bed | It has a back body that is flatly shaped for easy loading and unloading of goods. The flatbed truck is mostly used to transport heavy, oversized, wide and indelicate goods. |
| Flatbed Truck | A flatbed truck is a type of truck with rigid design. It has a back body that is flatly shaped for easy loading and unloading of goods. The flatbed truck is mostly used to transport heavy, oversized, wide and indelicate goods such as machinery, building supplies or equipment. Due to the truck open body, the goods transported with it must not be vulnerable to rain. By functionality, the flatbed truck is comparable to a flatbed trailer. |
| Freight Transit Time | Transit time is how long it takes for a shipment to be delivered to its final destination after being picked up from a designated pick up point. |
| Halal Logistics | It refers to the process of managing the logistics operations such as fleet management, storage/warehousing, and materials handling according to the principles of Shariah law in ensuring the integrity of the halal products at the point of consumption. |
| Haulage | The commercial transport of goods. |
| Inbound Logistics | Inbound logistics is the way materials and other goods are brought into a company. This process includes the steps to order, receive, store, transport and manage incoming supplies. Inbound logistics focuses on the supply part of the supply-demand equation. |
| Intermediate Demand | Intermediate demand includes goods, services, and maintenance and repair construction sold to businesses, excluding capital investment. |
| International Loaded | Place of loading of goods in reporting country (i.e., country in which the vehicle performing the transport is registered) and place of unloading in a different country. |
| International Unloaded | Place of unloading of goods in reporting country (i.e., country in which the vehicle performing the transport is registered) and place of loading in a different country. |
| Last Mile Delivery | Last mile delivery refers to the very last step of the delivery process when a parcel is moved from a transportation hub to its final destination—which, usually, is a personal residence or retail store. |
| Less than-Truck-Load (LTL) | Less-than-truckload, also known as less-than-load (LTL), is a shipping service for relatively small loads or quantities of freight. An LTL provider combines the loads and shipping requirements of several different companies on their trucks, using a hub-and-spoke system to get goods to their destinations. |
| Locomotives Haluage | The transport of coal, ore, workers, and materials underground by means of locomotive-hauled mine cars. The locomotive may be powered by battery, diesel, compressed air, trolley, or some combination such as battery-trolley or trolley-cable reel. |
| Milkrun | A Milk Run is a delivery method used to transport mixed loads from various suppliers to one customer. Instead of each supplier sending a truck every week to meet the needs of one customer, one truck (or vehicle) visits the suppliers to pick up the loads for that customer. This method of transport got its name from the dairy industry practice, where one tanker used to collect milk from several dairy farms for delivery to a milk processing company. |
| Multi country consolidation | Multi-Country Consolidation (MCC) is a cost-effective solution that consolidates ones cargo from different countries of origin to build Full Container Loads (FCL). MCC is most suitable for companies that import light volumes of goods from multiple countries but want to take advantage of the more economic FCL freight rates. |
| Multi-Modal Logistics | Multimodal transportation or multimodal shipping refers to logistics and freight processes that require multiple modes of transportation. |
| Omni Channel Logistics | Omnichannel distribution is a multichannel approach taken by companies to give customers a way to purchase and receive orders from several sales channels with one-touch seamless integration. Some of the ways include- 1. Buy online, then pick-up at the brick and mortar store; 2. Buy online, then have it delivered to the home or another location; 3.In store purchase, with the delivery either to the home or another location; 4. Drop ship from a warehouse or manufacturing center to store, home or other location; 5.Buy online, then return at store or online; 6. Buy online, then return online. |
| OOG cargo | Out of Gauge (OOG) cargo is any cargo that can not be loaded into six-sided shipping containers simply because it is too large. The term is a very loose classification of all cargo with dimensions beyond the maximum 40HC container dimensions. That is a length beyond 12.05 meters – a width beyond 2.33 meters – or a height beyond 2.59 meters. |
| Other ships | Other ships include: Liquefied petroleum gas carriers, liquefied natural gas carriers, parcel (chemical) tankers, specialized tankers, reefers, offshore supply vessels, tugboats, dredgers, cruise, ferries, other non-cargo ships |
| Other Specialised Cargo | Other specialised goods include pre-slung goods (Goods, one or more items, supplied with a sling or slings), mobile units (Mobile Self Propelled Units, Non Self Propelled Units, unrolled vehicles), oversized equipment load (light and heavy machinery that is often too big or too heavy), high value freight that needs extra protection like electronics, financial services road freight. |
| Outsourced Freight Transport | Transport for hire or reward; The carriage for remuneration of goods. |
| Pallets | Raised platform, intended to facilitate the lifting and stacking of goods. |
| Part load | A part load describes goods which only fills a truck partially. In essence, the quantity of the shipment is bigger than the Less Than Truckload (LTL) shipment. Also, the shipment cannot fully occupy a truck i.e. its capacity is much lower than a Full Truckload (FTL) shipment. |
| Paved Road | Road surfaced with crushed stone (macadam) with hydrocarbon binder or bituminized agents, with concrete or with cobblestone. |
| Q-commerce | Q-commerce, also referred to as quick commerce, is a type of e-commerce where emphasis is on quick deliveries, typically in less than an hour. |
| Quay | A stone or metal platform lying alongside or projecting into water for loading and unloading ships. |
| Recommerce | Recommerce is the selling of previously owned items through online marketplaces to buyers who reuse, recycle or resell them. |
| ReverseLogistics | Reverse logistics is a type of supply chain management that moves goods from customers back to the sellers or manufacturers. |
| Road Freight Transport Service | Hiring a trucking agency for transport of commodities (raw materials or manufactured goods including both solids and liquids) form the origin to a destination within the country (domestic) or cross-border (international) constitutes road freight transport market. The service might be Full-Truck-Load or Less than-Truck-Load, containerized or non-containerized, temperature controlled or non temperature controlled, short haul or long haul. |
| Roll-on/roll-off cargo | Roll-on/roll-off (RORO or ro-ro) ships are cargo ships designed to carry wheeled cargo, such as cars, motorcycles, trucks, semi-trailer trucks, buses, trailers, and railroad cars, that are driven on and off the ship on their own wheels or using a platform vehicle, such as a self-propelled modular transporter. |
| Swap bodies | A swap body, swop body, exchangeable container or interchangeable unit, is one of the types of standard freight containers for road and rail transport. |
| Tank Barge | A non-self-propelled vessel constructed or adapted primarily to carry liquid, solid or gaseous commodities or cargos in bulk in cargo spaces (or tanks) through rivers and inland waterways, and may occasionally carry commodities or cargos through oceans and seas when in transit from one inland waterway to another. The commodities or cargos transported are in direct contact with the tank interior. |
| Tautliner vehicle | Tautliner and curtainsider are used as generic names for curtain sided trucks/trailers. The curtains are permanently fixed to a runner at the top and detachable rails/poles at front and rear, allowing the curtains to be drawn open and forklifts used all along the sides for easy and efficient loading and unloading. When closed for travel, vertical load restraint straps are attached to a rope rail beneath the truck bed, connecting the truck bed and curtain along both sides. Winches at either end of the curtain tension it, hence the 'Tautliner' name. This stops the curtain from flapping or drumming in the wind and can also help retain light loads from slipping sideways. |
| Transloading | Transloading is a shipping term that refers to the transfer of goods from one mode of transportation to another en route to their ultimate destination. |
| Tsubo | A Japanese unit of area equal to 35.58 square feet. |
| Unpaved Road | Road with a stabilized base not surfaced with crushed stone, hydrocarbon binder or bituminized agents, concrete or cobblestone. |
| Vessel Husbandry Services | It includes ship maintenance, repairs, cleaning, upkeep of the hull and rigging and equipment. |
Need More Details on Market Definition?
Ask a Question
Research Methodology
Mordor Intelligence follows a four-step methodology in all our reports.
- Step-1: Identify Key Variables: In order to build a robust forecasting methodology, the variables and factors identified in Step-1 are tested against available historical market numbers. Through an iterative process, the variables required for market forecast are set and the model is built on the basis of these variables.
- Step-2: Build a Market Model: Market-size estimations for the forecast years are in nominal terms. Inflation is not a part of the pricing, and the average selling price (ASP) is kept constant throughout the forecast period for each country.
- Step-3: Validate and Finalize: In this important step, all market numbers, variables and analyst calls are validated through an extensive network of primary research experts from the market studied. The respondents are selected across levels and functions to generate a holistic picture of the market studied.
- Step-4: Research Outputs: Syndicated Reports, Custom Consulting Assignments, Databases & Subscription Platforms

Get More Details On Research Methodology
Download PDF


