
Market Overview
| Study Period | 2020 - 2031 |
|---|---|
| Forecast Data Period | 2026 - 2031 |
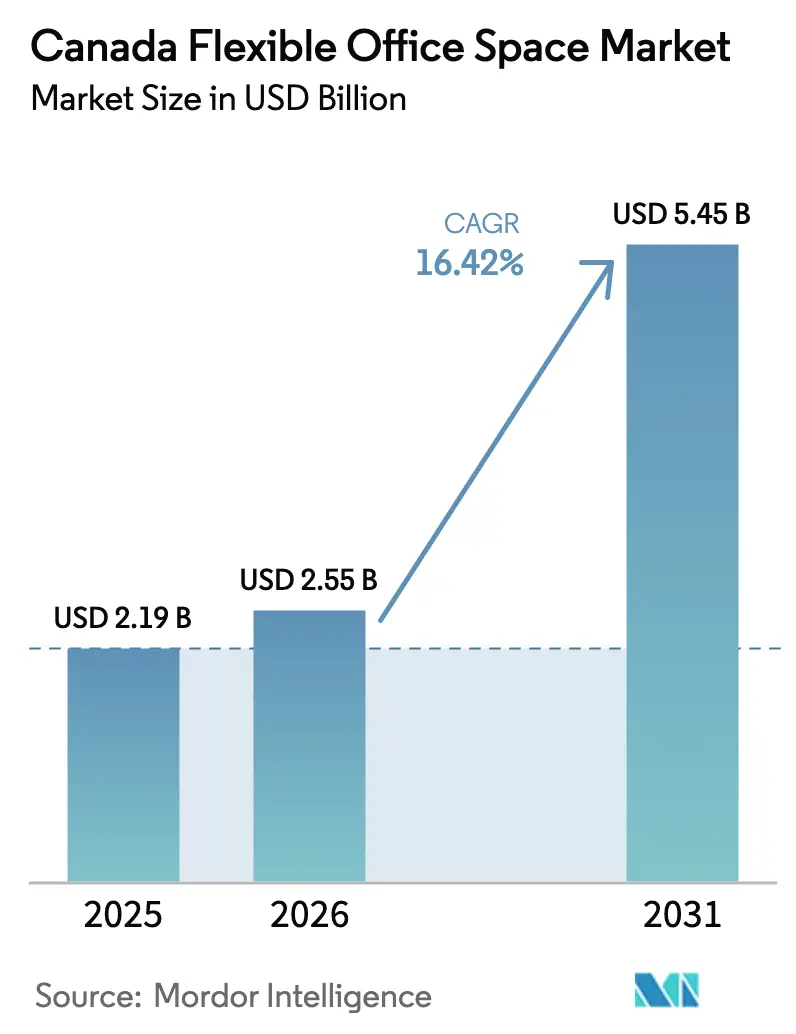
| Base Year Market Size (2025) | USD 2.19 Billion |
| Market Size (2026) | USD 2.55 Billion |
| Market Size (2031) | USD 5.45 Billion |
| Growth Rate (2026 - 2031) | 16.42 % |
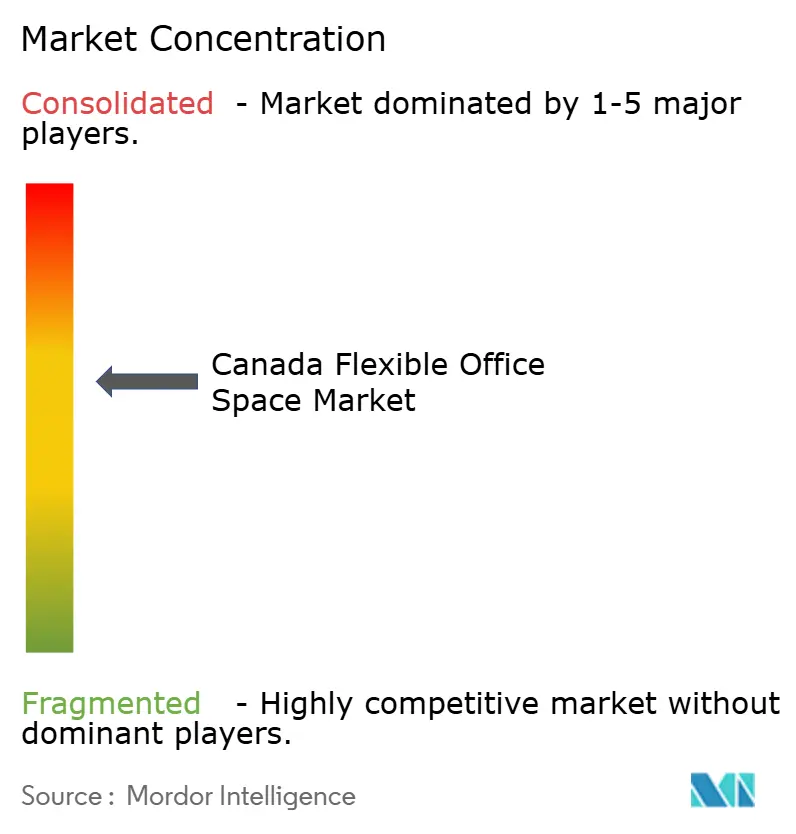
| Market Concentration | Medium |
Major Players *Disclaimer: Major Players sorted in no particular order Image © Mordor Intelligence. Reuse requires attribution under CC BY 4.0. | |
Canada Flexible Office Space Market Analysis by Mordor Intelligence
Canada Flexible Office Space Market size in 2026 is estimated at USD 2.55 billion, growing from 2025 value of USD 2.19 billion with 2031 projections showing USD 5.45 billion, growing at 16.42% CAGR over 2026-2031. Accelerated adoption of hybrid work policies, the push for real-time space utilization data, and the rise of asset-light partnership models are reshaping workplace strategies across provinces. Demand is no longer confined to cost-conscious startups; large enterprises now integrate flexible space into core portfolios to boost talent retention and operational agility. Technology-enabled services, green certifications, and provincial diversification help operators counter rental inflation in core cities. Consolidation—best illustrated by CBRE’s USD 800 million purchase of Industrious—confirms investor confidence in the Canada flexible office space market.
Key Report Takeaways
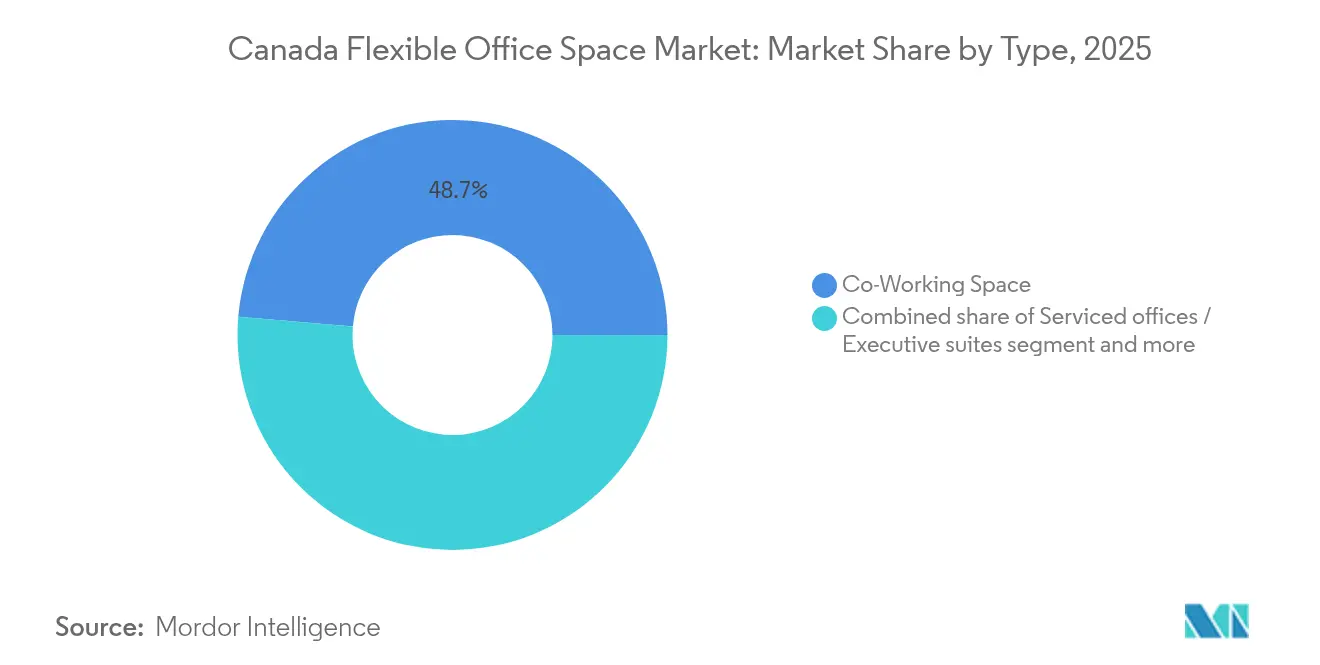
- By type, co-working led with 48.65% of Canada flexible office market share in 2025, while hybrid and virtual office solutions are forecast to grow at a 17.32% CAGR through 2031.
- By sector, information technology accounted for 30.85% of Canada flexible office market size in 2025; business consulting and professional services show the fastest expansion at an 17.75% CAGR to 2031.
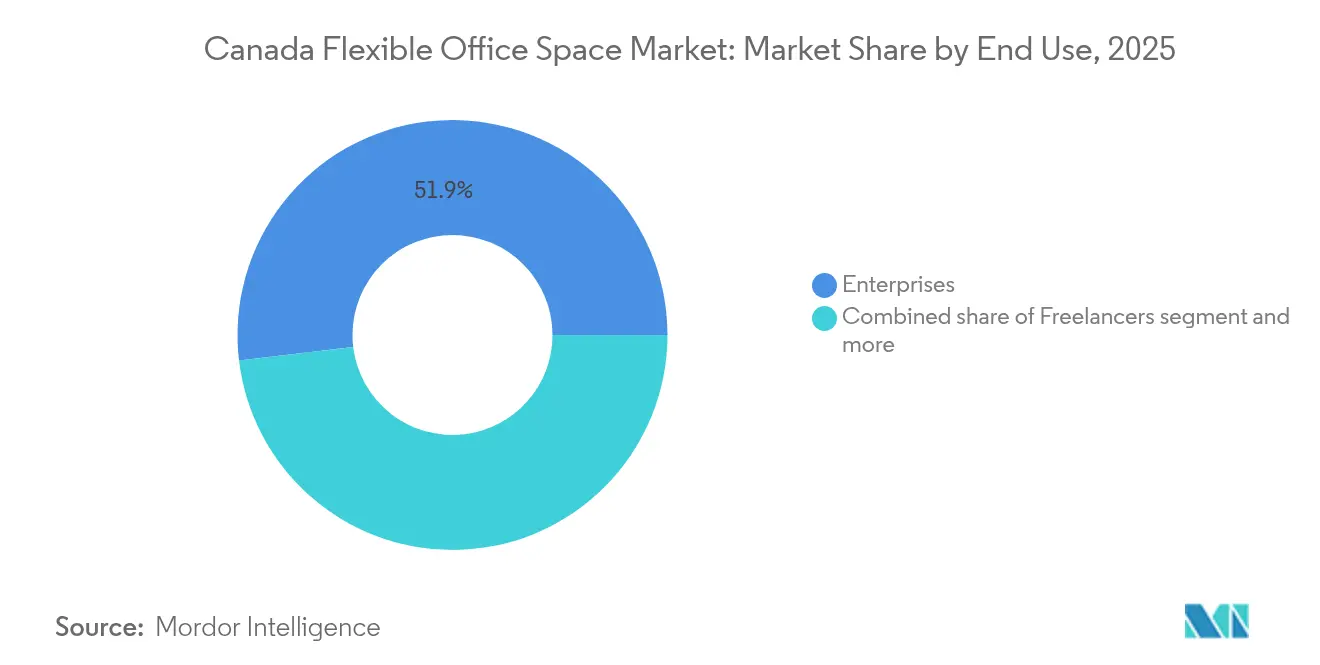
- By end user, enterprises held 51.90% of Canada flexible office market size in 2025, but startups and emerging firms will advance at an 18.29% CAGR through 2031.
- By province, Ontario captured 40.75% of Canada flexible office market share in 2025, whereas Alberta is set to expand at a 18.62% CAGR up to 2031.
Note: Market size and forecast figures in this report are generated using Mordor Intelligence’s proprietary estimation framework, updated with the latest available data and insights as of 2026.
Canada Flexible Office Space Market Trends and Insights
Drivers Impact Analysis*
| Driver | (~) % Impact on CAGR Forecast | Geographic Relevance | Impact Timeline |
|---|---|---|---|
| Enterprise desk-as-a-service pilots | +4.1% | National focus in Ontario and Quebec | Long term (≥ 4 years) |
| Financial-sector hybrid mandates | +3.2% | Ontario, Quebec, British Columbia | Medium term (2-4 years) |
| Vancouver tech-startup migration | +2.8% | British Columbia; spillover into Alberta | Short term (≤ 2 years) |
| Hybrid hubs in secondary cities | +2.5% | Alberta and the rest of Canada | Medium term (2-4 years) |
| Smart-building technology adoption | +1.9% | Ontario, British Columbia | Long term (≥ 4 years) |
| ESG-led demand for green certifications | +1.5% | National, with early uptake in Ontario & B.C. | Long term (≥ 4 years) |
| Source: Mordor Intelligence | |||
Hybrid Work Mandates Drive Financial-Sector Transformation
The evolving workplace dynamics are driving significant changes in real estate strategies across industries. Banks and insurers are reshaping their real estate portfolios, focusing on two-to-three-day office mandates that necessitate compliant satellite spaces for secure collaboration. Flexible-office providers are now offering branded, access-controlled suites that adhere to regulatory standards, alleviating risk concerns for their highly regulated clientele. The endorsement from GCcoworking, a federal entity, adds an extra layer of credibility to these shared environments. Consequently, the flexible office market in Canada witnesses a consistent demand from enterprises, with operators clinching long-term contracts in suburban areas[1]Lucie O’Donnell, “Hybrid Work and Federal Office Utilization,” Public Services and Procurement Canada, tpsgc-pwgsc.gc.ca.
Tech-Startup Migration Accelerates Coworking Adoption
The flexible office market in Canada is undergoing a significant transformation driven by evolving business needs. Vancouver's nascent firms are moving away from traditional leases, opting instead for coworking memberships that align with their venture-funding milestones. These shared spaces have evolved into informal networks for talent acquisition and deal-making, enhancing their allure. Echoing this trend, Calgary and Toronto showcase how fiscal prudence and networking benefits are driving Canada's flexible office market. This shift underscores the growing importance of adaptability and collaboration in the modern workplace landscape.
Enterprise Desk-as-a-Service Models Reshape Corporate Real Estate
The concept of flexible workspaces is transforming how large organizations manage their office needs. Large organizations are now viewing workspaces as subscriptions, allowing them to free up capital and manage occupancy fluctuations. At Ottawa's Vanguard Building, corporates are testing the waters with sophisticated booking tools, zero-trust security measures, and trials of unassigned seating. These pilot programs are not just experiments; they validate the demand for premium, tech-driven solutions in Canada's flexible office market.
Secondary-City Expansion Creates Geographic Diversification
The shift toward suburban markets is gaining momentum as operators adapt to evolving workplace trends. Operators are expanding into Ottawa, Calgary, and Halifax, aiming to be closer to employees and to take advantage of more affordable real estate. IWG's ambitious "15-minute city" initiative, which seeks to boost Canadian locations from 150 to 250, highlights a strong belief in the rising demand for suburban spaces. This geographic diversification not only protects revenues from the unpredictability of downtown markets but also widens the potential customer base. These strategic moves reflect a proactive approach to meeting changing market demands while ensuring sustainable growth.
Restraints Impact Analysis*
| Restraint | (~) % Impact on CAGR Forecast | Geographic Relevance | Impact Timeline |
|---|---|---|---|
| Soaring rental rates in core cities like Toronto are reducing operator profitability | -2.1% | Ontario, British Columbia | Short term (≤ 2 years) |
| Oversupply in major hubs is leading to increased vacancy and discounting pressures | -1.8% | Ontario, Quebec, British Columbia | Medium term (2-4 years) |
| Varying lease and building regulations across provinces are complicating national expansion | -1.4% | National, particularly affecting multi-provincial operators | Long term (≥ 4 years) |
| Concerns around cybersecurity in shared environments are deterring enterprise clients | -1.2% | National, concentrated in BFSI and government sectors | Medium term (2-4 years) |
| Source: Mordor Intelligence | |||
Rental-Rate Inflation Pressures Operator Margins
Toronto is seeing rising rental rates, squeezing flexible office operator margins and prompting changes in pricing and location strategies. The Greater Toronto Area vacancy rate rose to 12.6% in Q3 2024, yet Class A asking rents still edged up to CAD 26.15 per square foot. Providers that hold conventional leases face the sharpest margin pressure and are re-pricing memberships or relocating to suburban sites where costs are lower. Many are now favoring revenue-sharing deals with landlords to cut fixed liabilities and keep expansion plans on track. Market data show a split between Trophy assets, which enjoy their lowest vacancy in four years, and older Class B/C towers that sit half-empty, leaving operators caught between higher rents for premium floors and tenant demands for professional settings
Market Oversupply Creates Competitive Pressures
Major Canadian markets, including Toronto, Vancouver, and Montreal, are facing oversupply in flexible office spaces, driving up vacancy rates and pressuring operator profitability. National office vacancy reached 17.7% in Q1 2023, while downtown Toronto hit 15.3% and other major metros logged record highs. Sublet listings made up 18.1% of all vacancies by late 2022, signaling that many firms cannot fully use the space they already hold. Traditional landlords have joined the flex trend, adding amenities and short leases that intensify price competition for dedicated operators. Net absorption turned positive in early 2024, yet sublet inventory still stands at 15 million square feet, keeping rents in check. Deep-pocketed brands now eye distressed assets and smaller rivals, betting that takeovers will restore balance and lift long-term profitability.
*Our forecasts treat driver/restraint impacts as directional, not additive. The impact forecasts reflect baseline growth, mix effects, and variable interactions.
Segment Analysis
By Type: Hybrid Models Redefine Usage Patterns
Co-working spaces commanded 48.65% of Canada flexible office space market size in 2025, underscoring their entrenched appeal to startups and freelancers. However, hybrid and virtual solutions will post a 17.32% CAGR to 2031 as corporations blend remote work with ad-hoc in-person collaboration. Hybrid plans allow employees to reserve desks only when required, enabling operators to optimize seat density and enterprises to trim fixed commitments. Leading brands such as IWG and WeWork have introduced day-pass bundles and meeting-room tokens to serve this episodic demand. Community-oriented amenities, once the hallmark of coworking, now coexist with enterprise-grade privacy zones and advanced conferencing gear, reflecting the sector’s widening client mix.
Adoption of subscription-based access is accelerating as employers prioritize flexibility over square footage. Virtual-office bundles supply mailing addresses and administrative support, letting companies establish Canadian presence without physical space. As hybrid adoption rises, operators refine booking algorithms to stagger peak usage and maintain service quality. Meanwhile, traditional serviced offices retain a solid niche among legal and consulting firms that value enclosed suites and administrative help, ensuring product diversity within the Canada flexible office market.


By Sector: Professional Services Gain Momentum
Information technology firms held 30.85% of 2025 demand, cementing their role as early adopters comfortable with collaborative setups and short planning cycles. Business consulting and professional services, propelled by an 17.75% CAGR forecast, are closing the gap as project-based engagements call for rapid team scaling and nationwide client coverage. Management consultancies now leverage hub-and-spoke footprints, hosting core teams downtown and deploying project staff in regional centers. This model reduces travel costs and supports just-in-time staffing for client work. IT tenants continue to require robust connectivity and secure network rooms, nudging operators to install multi-carrier fiber and redundant power backups. The influx of professional-services occupiers is broadening demand for client-ready boardrooms and concierge-level reception, diversifying revenue streams across the Canada flexible office market.
Sectoral diversification also mitigates cyclical risk: countercyclical legal and accounting practices temper volatility associated with startup funding flows. Flexible-office brands differentiate by tailoring build-outs—sound-proof rooms for legal depositions, secure data rooms for due diligence—meeting varied compliance needs without departing from shared-service economics.
By End User: Enterprise Demand Bolsters Scale
Enterprises represented 51.90% of 2025 revenue, confirming that flexible offerings have matured into a core real-estate strategy. Pilot programs in telecommunications, banking, and insurance now convert into multi-year frameworks that anchor operator cash flows. The fastest growth, however, stems from startups and emerging firms, projected at an 18.29% CAGR through 2031. Venture-backed teams favor month-to-month memberships that mirror funding rounds, reinforcing throughput for smaller meeting rooms and communal zones. Freelancers remain a stable base, driving daytime desk utilization but exerting limited bargaining power. As both cohorts coexist, operators create tiered access packages—corporate suites, growth-company studios, and freelancer hot-desks—maximizing yield per square foot.
Enterprises are also demanding integration with HR and security systems for badgeless access and single-sign-on authentication. Operators that deliver seamless onboarding and data-driven reporting strengthen retention. Meanwhile, startup-oriented operators differentiate via mentor programs, investor pitch events, and digital talent boards, ensuring their share of the Canada flexible office market expands steadily.
Geography Analysis
Ontario remains the center of gravity, claiming 40.75% share in 2025 on the back of Toronto’s dense financial-services ecosystem and the clustering of multinational headquarters. Hybrid work policies push corporates to reserve premium, Class A suites downtown while adding satellite hubs in suburbs such as Mississauga and Markham, where lower rents bolster margins. Clear lease frameworks under the Commercial Tenancies Act simplify contract negotiations and reduce legal friction for operators. The province’s focus on smart-city initiatives further encourages IoT adoption within flexible offices, reinforcing premium positioning.
Alberta, predicted to grow at 18.62% CAGR through 2031, benefits from economic diversification initiatives that invite technology and professional-services tenants into Calgary and Edmonton. Public incentive schemes fund tower conversions, accelerating inventory growth while maintaining manageable overheads. Large energy firms establishing cleantech incubators rely on turnkey floors with advanced lab space, adding sector depth to the Canada flexible office market. Additionally, Alberta’s competitive housing costs support talent attraction, increasing corporate willingness to open western satellite offices.
British Columbia and Quebec deliver mid-teen growth rates anchored by Vancouver’s tech corridor and Montreal’s aerospace and life-sciences sectors. Vancouver’s emphasis on sustainability dovetails with ESG-oriented tenant preferences, pushing operators to secure LEED Gold and BOMA BEST Platinum labels. Montreal’s bilingual workforce requires dual-language reception and signage, prompting localization of service offerings. Beyond the four largest provinces, secondary cities such as Ottawa, Halifax, and Winnipeg enter the spotlight. Federal GCcoworking rollouts and provincial ShareSpace programs validate demand in public-sector circles, while allowing private operators to seed early positions before saturation.
Regulatory Landscape
Flexible office operations in Canada sit at the intersection of provincial property and building rules and federal workplace direction, which influences how operators structure contracts and manage facilities. Most coworking memberships are documented as license-style agreements rather than traditional leases, affecting member rights (for example, around exclusive possession) and the operator's ability to manage access and shared amenities across multi-tenant environments. Tax compliance also factors into day-to-day operations, as operators crossing the CAD 30,000 annual revenue threshold generally need GST/HST registration and appropriate invoicing practices.
Rules vary by province for accessibility and building requirements, with Ontario's Accessibility for Ontarians with Disabilities Act (AODA) acting as a common anchor for public-facing workspace design and operations. On the demand side, federal workplace direction from the Treasury Board Secretariat, including the July 6, 2026 shift to four days per week onsite for public servants, intersects with Public Services and Procurement Canada (PSPC) real property initiatives such as its 10-year plan to reduce the federal office portfolio by 50%. This combination shapes where public-sector demand concentrates and how third-party flexible space is used or substituted by government-controlled space.
Value Chain Analysis
The Canadian flexible office value chain starts with asset owners and landlords, including developers and institutional investors, providing underutilized office floors. Flexible workspace operators then lease, manage, or partner to convert space into subscription-based products, including coworking, serviced suites, and hybrid/virtual offerings. Workspace design, fit-out contractors, and technology vendors support both conversion and ongoing operations, covering access control, booking and utilization analytics, connectivity, and security tooling that enterprises increasingly require in shared environments.
Commercialization typically runs through operator sales teams, brokerage referrals, and platform-driven distribution such as workspace marketplaces and booking systems. It then feeds ongoing service delivery, including community management, facilities, mail handling, and meeting-room operations. A clear structural shift is toward asset-light partnership models with landlords. IWG reported that partnership agreements accounted for 99% of its new location signings in 2025, reinforcing revenue-share and management-contract pathways that reduce fixed rent exposure for operators. Across the chain, legal documentation, often license-style coworking agreements, and compliance requirements such as GST/HST registration once revenue thresholds are met help standardize member terms, billing, and risk allocation.
Competitive Landscape
The Canada flexible office space market is moderately concentrated. International giants IWG and WeWork coexist with Canadian home-grown brands including Workhaus, iQ Offices, and TCC Canada, resulting in a moderately fragmented but tightening field. The USD 800 million CBRE–Industrious deal in January 2025 signals rising convergence between brokerage, property management, and flexible operations. Such vertical integration equips global players with capital access, enterprise sales channels, and data platforms that small independents find hard to match.
The Canadian flexible office sector is moderately concentrated. Competition increasingly revolves around asset-light revenue-sharing models rather than fixed leases, reducing risk and unlocking faster provincial rollouts. Operators partner with landlords to retrofit under-utilized floors, sharing upside while shielding themselves from rental volatility. Technology becomes the new battleground: white-label booking apps, AI-driven occupancy dashboards, and mobile access control differentiate premium offerings. Firms that integrate real-time ESG metrics also gain traction among corporates mandated to track carbon footprints[3]Competition Bureau Canada, “Merger Review of Real-Estate Service Firms 2025,” competitionbureau.gc.ca.
Specialization emerges as an effective defense for mid-sized brands. Workhaus focuses on community-centric environments with curated networking events for scale-ups, whereas iQ Offices targets boutique, design-forward suites appealing to legal and finance tenants. Regional operators such as The Hive Vancouver and Launch Coworking capture niche demand through hyper-local programming and partnerships with municipal innovation agencies. Meanwhile, traditional landlords increasingly offer spec-suite flex floors, intensifying competition but also validating the broader Canada flexible office market.
Canada Flexible Office Space Industry Leaders
International Workplace Group plc
Spaces
WeWork
Workhaus
iQ Offices
- *Disclaimer: Major Players sorted in no particular order

Market Opportunities and Future Outlook
Government workplace policy and portfolio actions create near-term whitespace for operators that can deliver compliant, distributed capacity. The Treasury Board Secretariat's move to four days per week onsite (effective July 6, 2026) increases the operational need for overflow and satellite collaboration space, while PSPC's 10-year plan to reduce the federal office portfolio by 50% points to continued reconfiguration of where and how office demand is served. PSPC's decision to close GCcoworking sites effective September 30, 2026 also reallocates space for federal departmental needs, tightening access to government-provided coworking in certain nodes and creating room for private providers to compete for public-sector adjacent demand in secondary markets where commutes and capacity constraints are most acute.
On the supply and go-to-market side, the partnership-led expansion model widens addressable inventory without requiring operators to take on full lease risk, which supports faster provincial rollout and landlord-led conversions of vacancy into managed flex. IWG's continued growth in Canada to 166 total locations shows that scaled networks are adding coverage, particularly outside core CBD footprints, aligning with the report's themes of secondary-city expansion and enterprise desk-as-a-service pilots. Opportunities center on (i) enterprise-grade, access-controlled suites for regulated sectors, (ii) conversion partnerships with landlords seeking to stabilize occupancy in older Class B/C towers, and (iii) technology-enabled reporting, including utilization, security, and ESG metrics, that supports corporate portfolio governance across provinces with differing building and tenancy frameworks.
Recent Industry Developments
- July 2026: International Workplace Group plc (IWG) announced new flexible workspace locations in Toronto and Montreal for July 2026, with planned openings in Mission, BC and East Gwillimbury, ON later in 2026. The expansion broadens Canada flexible office space footprint and strengthens enterprise sales channels. The action reinforces an asset-light growth model across Canada.
- March 2026: International Workplace Group plc (IWG) reported preliminary results for the year ended December 31, 2025, with cautious 2026 guidance. The results provide visibility on profitability trajectory and outline planned investments in Canada. The release signals a potential scale-up in Canada through continued expansion and optimization of operations.
- October 2025: International Workplace Group plc (IWG) entered the New Brunswick market with two flexible workspace locations in Moncton. The expansion broadens geographic reach into Atlantic Canada. It diversifies provincial exposure for IWG in Canada.


Research Methodology Framework and Report Scope
Market Definition and Coverage
This market covers the revenue generated in Canada from flexible office space offerings that are sold as ready-to-use workspaces, with short and adjustable terms, and with shared services included in the price.
Scope exclusions: We exclude traditional long-term office leasing that is not packaged or sold as a flexible workspace product.
Segmentation Overview
- By Type
- Co-Working Space
- Serviced offices / Executive suites
- Others (Hybrid, Virtual Office)
- By Sector
- Information Technology (IT and ITES)
- BFSI (Banking, Financial Services and Insurance)
- Business Consulting & Professional Service
- Other Services (Retail, Lifesciences, Energy, Legal Services)
- By End Use
- Freelancers
- Enterprises
- Start Ups and Others
- By Province
- Ontario
- Quebec
- British Columbia
- Alberta
- Rest of Canada
Data Sources, Market Sizing, and Validation
Desk Research
Desk research was used to build the starting structure of the market, and then to anchor the model to observable signals such as office stock, employment, and vacancy. Public sources were reviewed, such as Statistics Canada for labor force and industry employment, CMHC releases where office and rental market context is referenced, and provincial or municipal open data portals that track permits and commercial development activity. We also referenced Bank of Canada and official FX and inflation series to keep currency timing and price escalation assumptions consistent.
The desk layer was then complemented with operator disclosures and general secondary sources like company filings, investor presentations, reputable press coverage, and association websites related to commercial real estate and workplace services. In a few cases, paid subscriptions were used only to fill gaps like private-company financials, patent and innovation signals for workplace tech, and shipment-level trade checks for office furniture and fit-out proxies when needed for reasonableness. The desk sources listed above are illustrative, and many other public and paid sources were also used for collection, validation, and clarification.
Primary Interviews and Surveys
Primary work was done through expert interviews and structured surveys with flexible workspace operators, commercial landlords and brokers, corporate real estate and facilities teams, and enterprise tenants that actively use flexible space. Since this is Canada-specific, coverage was balanced across major demand centers and secondary cities, then re-checked with province-level context where availability and pricing patterns differ. In these discussions, we clarified what is actually being sold as flexible space, how utilization and deal terms are changing, and what the realistic price corridor looks like for desks and private suites.
Distribution of primary research fieldwork respondents
| Company type | Respondent position |
|---|---|
| Top tier: 33% | CXOs: 14% |
| Mid tier: 52% | Functional/Unit leaders: 26% |
| Smaller Players: 15% | Managers: 60% |
Market-Sizing & Forecasting
Sizing starts with a top-down demand pool build that reconstructs flexible office revenue from office-using employment, hybrid work adoption, and a realistic penetration of flexible space by sector, and then translates this into paid seats and monthly revenue. To keep it grounded, we used market fingerprints such as desk and private office price ranges, the average contract length mix, occupancy or utilization norms by facility type, and the share of revenue coming from meeting rooms and services (where applicable). Where the data was not fully visible at a province level, gaps were handled using city-level proxies and then scaled using office stock and employment weights.
To avoid relying on a single method, we corroborated results with selective bottom-up approximations, such as rolling up sampled site counts in key cities, applying a plausible seats-per-location range, and then multiplying by validated average pricing. Channel checks with brokers and tenant-side respondents were also used to pressure-test whether implied seat volumes and price growth match what is being contracted. For forecasting, scenario analysis was used because demand is sensitive to macro conditions, vacancy cycles, and corporate return-to-office enforcement, and those drivers shift unevenly across Canada. Assumptions were tuned using primary expert views on near-term pricing, supply additions, and enterprise adoption pace, and then reviewed for internal consistency year by year.
Data Validation & Update Cycle
Model outputs are checked against independent signals, such as office vacancy direction, leasing momentum, and reported changes in flexible space footprints, and then major variances are investigated before sign-off. Outliers are traced back to inputs like pricing, penetration, or utilization assumptions, and then the logic is either corrected or documented so the trail remains clear.
The work is reviewed in multiple steps, starting with analyst cross-checks and followed by a separate review focused on math integrity and assumption reasonableness. When results move sharply due to new evidence, respondents are re-contacted to confirm whether it reflects a real market shift or a one-off data point. Reports are refreshed annually, with interim updates when material events occur, and before delivery an analyst performs a final pass so clients receive the latest updated view.
Mordor Intelligence's Canada Flexible Office Space Market Size Compared With Other Published Estimates
Published market values for Canada flexible office space can look far apart, even when they seem to reference the same concept. Differences usually come from what is counted as flexible space revenue, how pricing and utilization are treated, and whether the numbers are updated using the latest office cycle signals.
The table shows a visible spread, and in Mordor Intelligence's model the market counts revenue from flexible office offerings such as coworking and serviced offices, while excluding standard long-term office rent that is not sold as a flexible product. Another common gap is how providers treat virtual office services and hybrid bundles, which can either be included as full market revenue or treated as an adjacent add-on with a smaller weight. The refresh cadence also matters, because vacancy shifts and enterprise adoption can change run-rate quickly, which then impacts the base year and the implied CAGR.
Benchmark comparison
| Source | Market Size | Gaps in Research Methodology |
|---|---|---|
| Mordor Intelligence | USD 2.19 B (2025) | |
| Trade Journal A | USD 0.29 B (2023) | Often centers on coworking-only revenue and a limited set of reported locations, which can undercount serviced offices and managed flexible suites that sit outside the coworking label. |
| Industry Association B | USD 3.20 B (2024) | Can apply aggressive utilization and price assumptions and may fold in broader workspace services, which increases totals when virtual office and bundled memberships are treated as equivalent to physical seat revenue. |
Reading the comparison together, the main takeaway is that scope and run-rate assumptions move the number more than small math choices. By keeping the revenue boundary tied to paid flexible workspace use, and then pressure-testing implied seats and prices with interview feedback, the estimate stays traceable to repeatable inputs instead of broad real estate totals.


Key Questions Answered in the Report
What is the current value of the Canada flexible office market?
The market is valued at USD 2.55 billion in 2026 and is projected to reach USD 5.45 billion in 2031.
How fast will the Canada flexible office market grow through 2031?
It is expected to expand at a 16.42% CAGR, pushing total value to USD 5.45 billion by 2031.
Which space type leads the Canada flexible office market?
Co-working spaces lead with a 48.65% share, while hybrid and virtual solutions show the strongest forecast growth.
Why is Alberta the fastest-growing province for flexible offices?
Economic diversification, lower real-estate costs, and municipal incentives drive Alberta’s 18.62% CAGR outlook.
How are enterprises using flexible offices differently from startups?
Enterprises deploy desk-as-a-service models for satellite hubs, whereas startups favor short-term memberships aligned with funding cycles.
What technologies are critical in modern flexible offices?
IoT sensors, AI-driven space analytics, and mobile-first booking platforms improve utilization, energy efficiency, and tenant experience.
Page last updated on:


 Your data is secure and never sold or shared.


