
Market Overview
| Study Period | 2020 - 2031 |
|---|---|
| Forecast Data Period | 2026 - 2031 |
| Base Year Market Size (2025) | USD 41.79 Billion |
| Market Size (2026) | USD 45.66 Billion |
| Market Size (2031) | USD 71.04 Billion |
| Growth Rate (2026 - 2031) | 9.27% CAGR |
| Market Concentration | Medium |
Major Players *Disclaimer: Major Players sorted in no particular order Image © Mordor Intelligence. Reuse requires attribution under CC BY 4.0. | |
Canada E-commerce Market Analysis by Mordor Intelligence
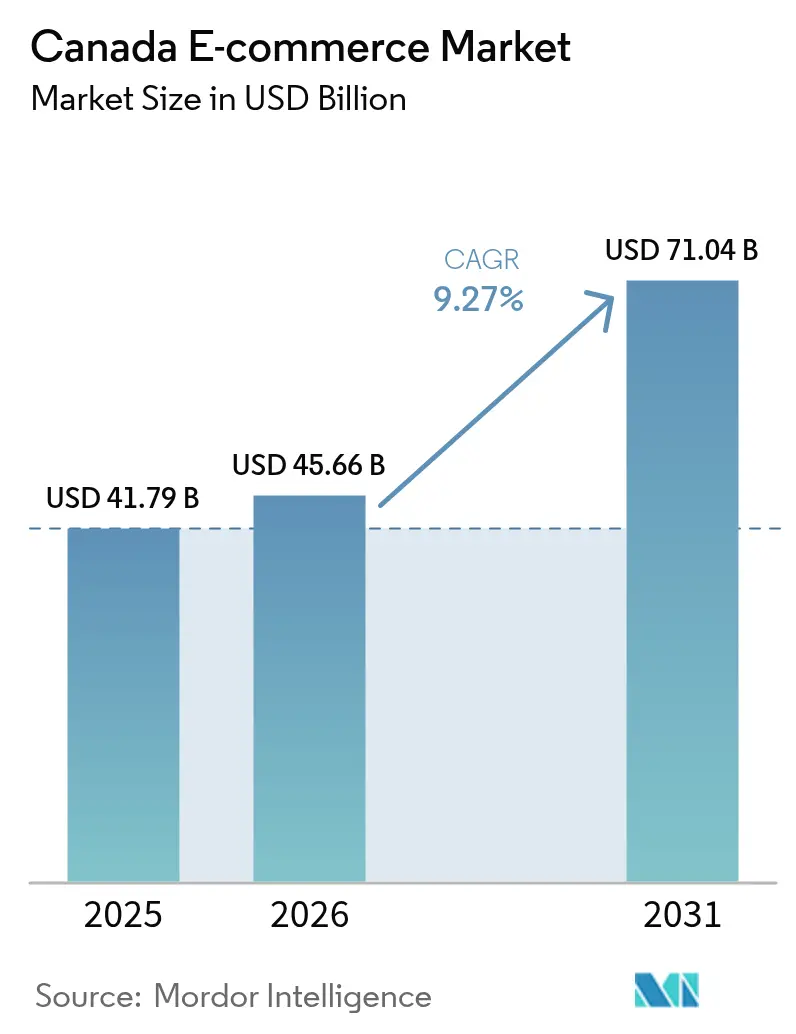
The Canada e-commerce market size was valued at USD 41.79 billion in 2025 and estimated to grow from USD 45.66 billion in 2026 to reach USD 71.04 billion by 2031, at a CAGR of 9.27% during the forecast period (2026-2031). Steady smartphone adoption, faster fulfillment promises, and government incentives are reshaping shopper expectations while pulling more merchants online. Social commerce integrations, localized language capabilities, and payment diversification are further broadening reach and conversion. Intensified competition is motivating investments in micro-fulfillment networks and last-mile capabilities that shorten delivery windows. Meanwhile, regulatory shifts in privacy and cross-border duties are compelling firms to recalibrate data strategies and supply chains to sustain margin resilience. Together, these forces point to a Canada e-commerce market that is moving into a scale phase where omnichannel and logistics excellence determine share gains.
Key Report Takeaways
- By business model, the B2C segment led with 64.35% of Canada e-commerce market share in 2025, while B2B is projected to expand at a 12.17% CAGR through 2031.
- By device type, desktop/laptop held 54.28% of the Canada e-commerce market size in 2025; smartphones are advancing at an 17.62% CAGR between 2026 and 2031.
- By payment method, credit/debit cards commanded 63.22% share of the Canada e-commerce market size in 2025, with BNPL solutions growing at 18.82% CAGR to 2031.
- By product category, consumer electronics accounted for an 17.62% share of the Canada e-commerce market size in 2025, while beauty and personal care is rising at a 14.12% CAGR through 2031.
Note: Market size and forecast figures in this report are generated using Mordor Intelligence’s proprietary estimation framework, updated with the latest available data and insights as of 2026.
Canada E-commerce Market Trends and Insights
Drivers Impact Analysis*
| Driver | (~) % Impact on CAGR Forecast | Geographic Relevance | Impact Timeline |
|---|---|---|---|
| Intensifying Same-Day Delivery Promos in Ontario's Urban Core | +2.5% | Ontario (Toronto, Ottawa, Hamilton), Quebec (Montreal) | Short term (≤ 2 years) |
| Accelerated Adoption of Interac Online & Contactless Debit among Gen-Z | +2.2% | National, with higher penetration in urban centers | Medium term (2-4 years) |
| U.S.–Canada Micro-Fulfilment Networks Lower Cross-Border Lead-Times | +1.8% | Border provinces (Ontario, Quebec, British Columbia) | Medium term (2-4 years) |
| Federal "Digital Adoption" Grants Boosting SMB Web-store Creation | +1.5% | National, with higher impact in smaller urban centers | Short term (≤ 2 years) |
| AI-powered Multilingual CX Tools Expanding Québec Conversion Rates | +1.2% | Quebec, with spillover to other bilingual regions | Medium term (2-4 years) |
| Source: Mordor Intelligence | |||
Intensifying Same-Day Delivery Promos
Same-day delivery has shifted from a premium extra to a baseline expectation in Toronto, Ottawa, and Montreal. Retailers adopting the service report 10% revenue lifts and 80% customer-satisfaction gains as density economics lower per-drop costs by 15-20% since 2024.[1]Supply Chain Brain, “Parcel Rate Hikes to Watch in 2024,” supplychainbrain.com Micro-fulfillment centers embedded within mixed-use properties now accelerate order cycles while reducing line-haul miles, freeing working capital tied up in regional warehouses. Property developers increasingly earmark logistics space to capture this demand. The strategic payoff extends to acquisition economics because shoppers view delivery speed as a proxy for reliability, boosting brand preference in crowded categories. As more merchants upgrade last-mile capabilities, the Canada e-commerce market will witness broad service-level parity that shifts competition toward assortment, loyalty, and price.
Accelerated Adoption of Interac Online & Contactless Debit
Gen-Z’s preference for debit-based payments is accelerating Interac Online and contactless debit volumes, up 27% in 2024.[2]Statistics Canada, “Retail Trade, December 2024,” statcan.gc.ca Card-linked options now contribute to lower cart abandonment, with merchants recording 22% fewer dropped baskets after integrating Interac checkout buttons. Debit dominance is also curbing churn in subscription models, as direct account funding reduces involuntary cancellations tied to expiring credit cards. The behavioral shift is prompting gateways to embed real-time balance checks and tokenized security, thereby enhancing trust. Over the medium term, payment providers able to bundle debit, BNPL, and open-banking rails within a single stack will secure a competitive edge as the Canada e-commerce market prioritizes seamless, low-fee settlement.
U.S.–Canada Micro-Fulfillment Networks
Cross-border lead times have collapsed from up to 10 days to under 3 days in priority corridors after retailers placed inventory in micro-nodes on both sides of the border.[3]Visigistics, “Major Changes to Section 321 De Minimis,” visigistics.com Section 321 duty-free suspensions for Canada-origin parcels entering the U.S. intensify the need for in-market stock, motivating Canadian sellers to lease U.S. warehouse space. Third-party logistics providers supply customs expertise and pooled transport, lowering landed costs while safeguarding delivery promises. Enhanced speed makes U.S. assortments more attractive to Canadian shoppers and vice versa, driving incremental sales on both ends. The development of cross-border micro-fulfillment is expected to keep the Canada e-commerce market competitive against U.S. rivals that already provide one- and two-day delivery nationwide.
Federal Digital-Adoption Grants
The Canada Digital Adoption Program disbursed grants of up to CAD 15,000 (USD 11,100) to 15,000+ SMBs, catalyzing web-store launches and integrated tech stacks. Beneficiaries report 32% sales increases within six months by adding real-time inventory, modern payment gateways, and CRM integrations. Smaller urban and suburban merchants are the main recipients, narrowing regional digital divides. The grant framework mandates advisory engagements that embed long-term digital roadmaps rather than single-feature fixes. Consequently, the program is expected to expand the total addressable base of sellers, adding fresh assortment to the Canada e-commerce market and intensifying category fragmentation.
Restraints Impact Analysis*
| Restraint | (~) % Impact on CAGR Forecast | Geographic Relevance | Impact Timeline |
|---|---|---|---|
| Persistently High Rural Broadband Costs in Atlantic Canada | -1.6% | Atlantic Provinces (Nova Scotia, New Brunswick, PEI, Newfoundland) | Long term (≥ 4 years) |
| Returns-logistics Surcharges on Bulky Items Hinders the Market | -1.3% | National, with higher impact in remote areas | Medium term (2-4 years) |
| Rising Privacy-law Compliance Spend under CPPA & Quebec Bill-64 | -1.1% | National, with concentrated impact in Quebec | Medium term (2-4 years) |
| Intensified U.S. Marketplace Fee Structures Squeezing Margins | -0.9% | National | Short term (≤ 2 years) |
| Source: Mordor Intelligence | |||
Persistently High Rural Broadband Costs in Atlantic Canada
Atlantic Canada’s rural households pay 42% more for internet but still face slower speeds, holding online shopping participation 37% below the national average. Although Ottawa’s USD 3.225 billion Universal Broadband Fund targets 100% high-speed coverage by 2030, last-mile economics remain challenging. Retailers serving these regions contend with higher delivery surcharges and longer transit times that erode customer experience. The digital divide limits addressable demand for categories such as groceries and bulky goods that depend on reliable connectivity for scheduling and tracking. Until infrastructure investments reach completion, the Canada e-commerce market will exhibit two-speed growth that favors urban corridors over coastal rural communities.
Returns-Logistics Surcharges on Bulky Items
Parcel carriers raised base rates by 5.9% in 2024, and oversized-item surcharges jumped even higher, pushing total shipping costs up more than 20% within 25 months. Furniture, appliance, and DIY retailers face a strategic dilemma: absorb costs or risk conversion by passing them on. Consumer expectations for free returns intensify the margin squeeze. In response, merchants deploy augmented-reality configurators and detailed dimension filters that lower mismatch-driven returns by double-digit percentages. Despite these mitigations, elevated reverse-logistics expenses will constrain growth in bulky categories and temper the overall CAGR for the Canada e-commerce market through the medium term.
*Our forecasts treat driver/restraint impacts as directional, not additive. The impact forecasts reflect baseline growth, mix effects, and variable interactions.
Segment Analysis
By Business Model: B2B Exhibits Accelerated Digital Migration
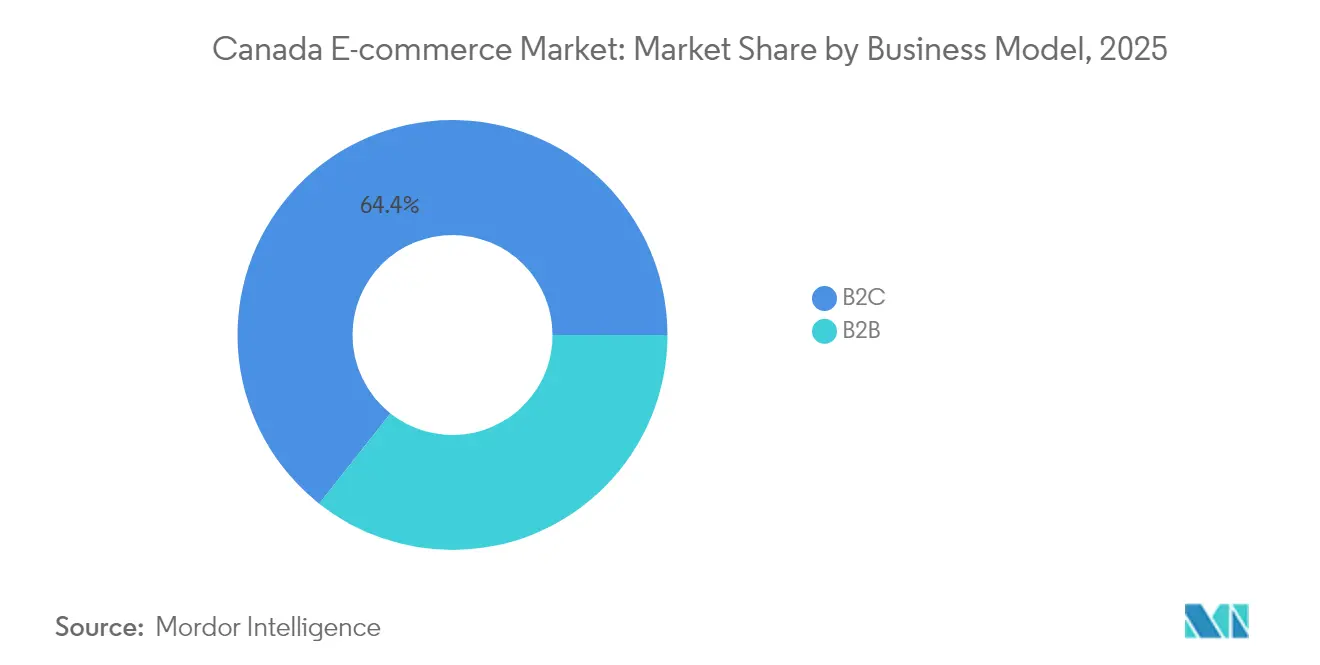
The B2C segment represented 64.35% of the Canada e-commerce market in 2025, underscoring its entrenched consumer adoption. However, the B2B channel is tracking a 12.17% CAGR from 2026 to 2031, well above the total market pace. Procurement departments are shifting to digital workflows that integrate catalog search, purchase-order automation, and budget controls. Vertical marketplaces for construction, healthcare, and industrial supplies simplify supplier discovery and compliance validation. Subscription replenishment and punch-out catalog features mirror consumer convenience, narrowing experiential gaps between business and personal shopping.
B2C growth persists as social-commerce funnels and DTC playbooks deepen engagement. Influencer-led drops and community memberships lock in repeat buyers. Meanwhile, B2B portals adopt AI-based demand-forecast modules that align purchasing with production schedules, reducing stockouts and over-ordering. The convergence of expectations is leading to unified platform architectures that serve both personas with role-based interfaces, thereby expanding total addressable volume in the Canada e-commerce market.


By Device Type: Smartphones Close the Conversion Gap
Desktops commanded 54.28% of transactions in 2025, yet smartphones are growing at 17.62% CAGR, reshaping merchandising priorities. Progressive web apps now deliver near-native performance, narrowing the historical 2.3x desktop-mobile conversion gap to 1.4x. Mobile wallets such as Apple Pay and Google Pay cut checkout friction and lift conversion by 28% when enabled. Voice commerce and connected-device shopping represent less than 5% of orders but signal a future multimodal landscape.
Retailers optimizing product imagery, one-hand navigation, and biometric login earn disproportionate share of wallet among younger cohorts. Inventory visibility tailored to geo-location supports last-minute pickup and delivery, boosting impulse purchasing. As smartphone penetration nears saturation, incremental growth will depend on latency reductions and richer real-time personalization that leverages device sensors, cementing the centrality of mobile in the Canada e-commerce market.
By Payment Method: BNPL Catalyzes Higher Basket Sizes
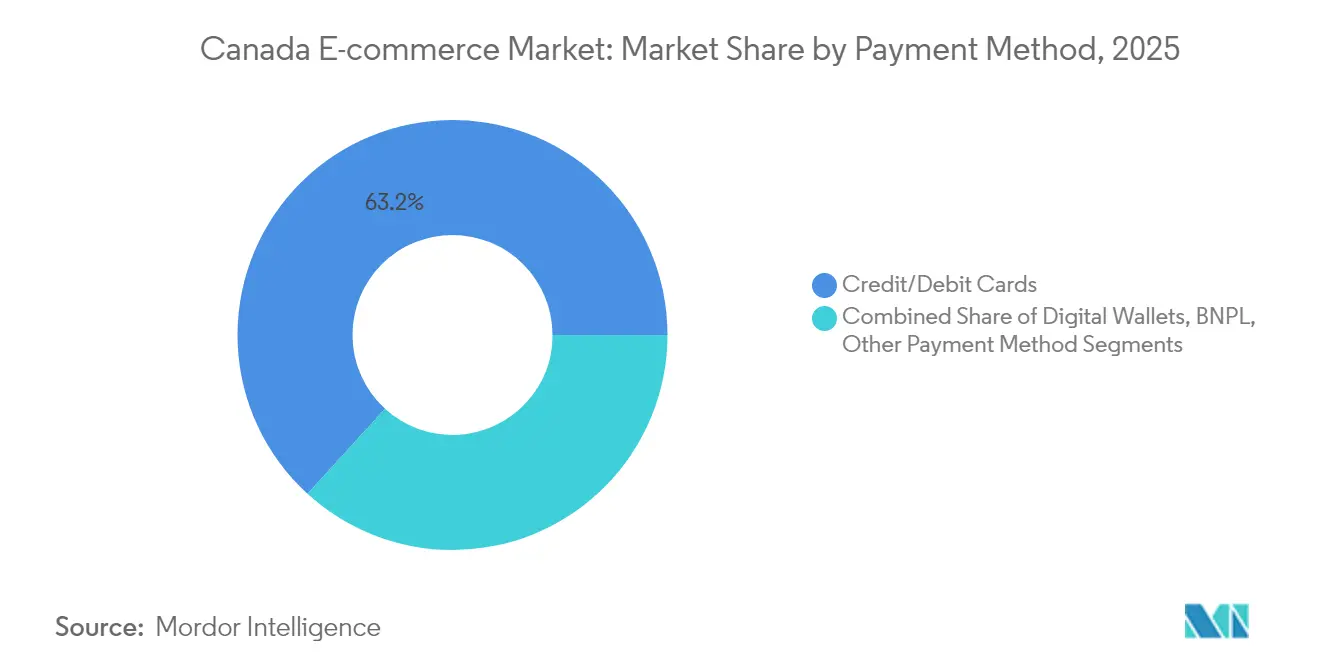
Credit/debit cards held 63.22% market share in 2025. BNPL, while nascent, is scaling at 18.82% CAGR and is forecast to reach USD 13.45 billion in transaction value by 2031. Merchants advertising BNPL at product pages see basket values climb 30-45% as consumers amortize higher-ticket purchases. Digital wallets rank second for popularity, especially on mobile, combining tokenized security with one-tap ease. Open-banking payments are in pilot but promise lower interchange fees and instant settlement.
Regulatory scrutiny from the Financial Consumer Agency of Canada is prompting providers to clarify fee structures and repayment schedules. Nonetheless, flexible terms resonate with budget-conscious shoppers, suggesting sustained double-digit expansion. Merchants adopting multi-rail orchestration can route transactions by cost and risk, optimizing net margin while meeting shopper preference across the Canada e-commerce market.
By B2C Product Category: Beauty Leads Growth Momentum
Consumer electronics remained the largest category with 17.62% share in 2025, aligned with high ASPs and frequent upgrade cycles. Beauty and personal care, however, is the fastest riser at a 14.12% CAGR to 2031, fueled by virtual try-on and replenishment subscriptions. User-generated content on social platforms drives discovery, with 54% of beauty transactions influenced by social feeds.
Fashion and apparel combat high return rates through AI sizing tools that cut misfits by 23%, while meal-kit providers maintain pandemic-era momentum via curated menu personalization. Furniture retailers leverage AR to visualize fit and color, reducing return freight costs. Each vertical’s optimized experience underlines the shift toward specialized value propositions within the Canada e-commerce market.
Geography Analysis
Ontario and Quebec control 64.18% of transaction value in 2025, supported by dense populations and robust fiber coverage. Urban centers such as Toronto, Montreal, and Ottawa show penetration levels comparable to leading U.S. metros. British Columbia and Alberta form the next tier, with lifestyle-driven category skews toward outdoor gear and wellness. Cross-border purchasing remains elevated in border provinces, where delivery times from U.S. micro-fulfillment hubs average two days. The recent duty-free suspension has spurred Canadian sellers to warehouse inventory stateside to protect competitive delivery times.
Quebec’s Bill 96 demands French-language parity across all digital touchpoints by June 2025, impacting 250,000 businesses. Compliance costs are encouraging adoption of AI translation and bilingual CX tooling that raises conversion by 35% among francophone shoppers. Atlantic Canada’s sparse connectivity suppresses adoption, though federal broadband initiatives promise incremental uplift post-2026. Prairie provinces exhibit strong agricultural-equipment e-procurement, illustrating regional specialization.
Growth pockets emerge in second-tier cities where cost-of-living advantages attract population inflows. Retailers tailoring assortments and fulfillment to these local nuances gain traction. Consequently, the Canada e-commerce market demonstrates a mosaic of micro-dynamics that require province-specific go-to-market blueprints.
Regulatory Landscape
Canada e-commerce operates under a competition-led framework anchored by the Competition Act, with enforcement by the Competition Bureau guiding platform conduct in digital marketplaces. In July 2025, the Bureau advanced an investigation into Amazon's Marketplace Fair Pricing Policy, signaling heightened scrutiny of pricing practices. A March 2026 Competition Tribunal decision allowed the Bureau's case against a major platform to proceed, underscoring ongoing competitive oversight in online retail.
Value Chain Analysis
The Canada e-commerce value chain flows from merchants and brands (B2C and B2B) through storefront and marketplace platforms, payments and fraud tooling, to fulfillment, line-haul, and last-mile delivery, with reverse logistics completing the loop. In payments, card networks dominate transaction share while Interac Online and contactless debit growth increase demand for low-friction checkout integrations; BNPL adds another layer of risk management, disclosures, and orchestration across payment service providers and gateways.
Competitive Landscape
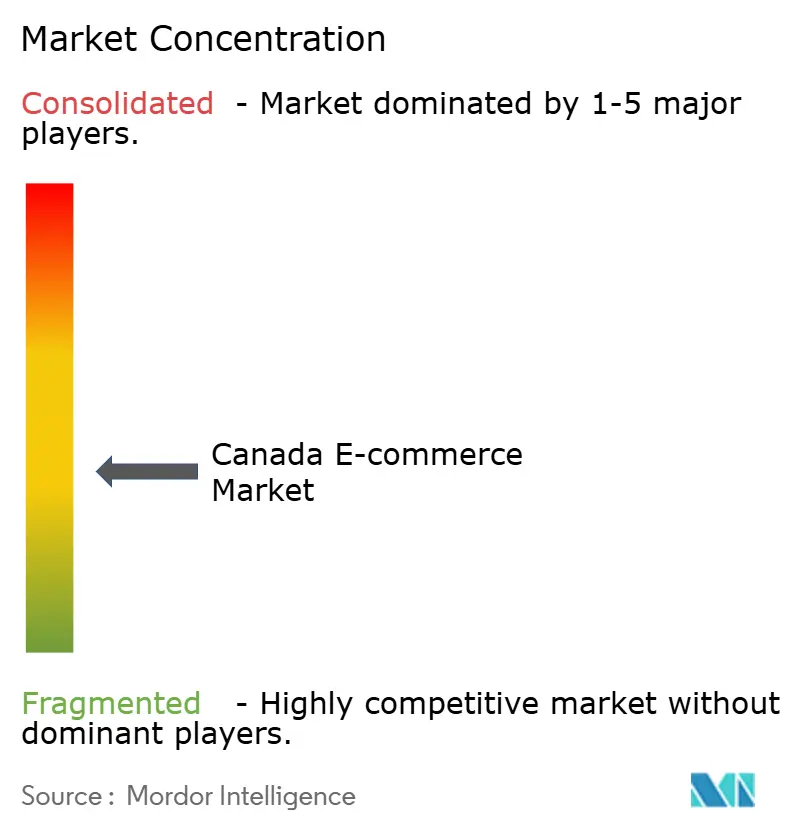
The top five players hold around 40% share, indicating moderate concentration. Amazon Canada leads with a Prime-driven value proposition that locks in loyalty through fast shipping and exclusive media. Walmart and Costco leverage store footprints as forward-inventory nodes, reducing last-mile costs and enabling same-day pickup. Canadian Tire’s agile curbside model converts its broad category mix into rapid fulfillment, supporting its omnichannel ambitions.
Shopify’s acquisition of Deliverr for USD 2.1 billion strengthens its fulfillment network, giving merchants two-day coverage nationwide and challenging Amazon’s logistics moat. Larger incumbents invest in robotics-enabled DCs to raise throughput and lower per-unit costs. Specialized vertical merchants capitalize on domain expertise and curated assortments to attract enthusiast consumers. Social-commerce natives use influencer coalitions and content commerce to bypass traditional advertising, gaining rapid brand awareness.
Privacy regulation and language mandates add new competitive variables. Firms with scalable compliance frameworks and bilingual platforms gain faster entry into Quebec and data-sensitive segments. As technology and last-mile capabilities converge, differentiation gravitates to loyalty ecosystems, curated private labels, and sustainability commitments, shaping the next phase of the Canada e-commerce market.
Canada E-commerce Industry Leaders
Amazon.com Canada Ltd.
Walmart Canada Corp.
Costco Wholesale Canada Ltd.
Home Depot of Canada Inc.
Apple Canada Inc.
- *Disclaimer: Major Players sorted in no particular order

Market Opportunities and Future Outlook
Privacy-by-design tooling, consent and preference management, data-mapping, and audit-ready governance address heightened privacy and platform oversight. The June 2026 tabling of Bill C-36 signals increased attention to data governance and bilingual CX requirements in markets like Quebec that support discovery-to-checkout journeys without breaking conversions. Infrastructure, compute access, and trade digitization create investable lanes tied to named programs and pilots rather than abstract demand. Transport Canada's CAD 5 billion Trade Diversification Corridors Fund and the CAD 1 billion Arctic Infrastructure Fund expand the field for logistics modernization and digital supply chain visibility that improves delivery promises and lowers exception costs. The federal AI for All strategy launched in June 2026 includes a compute access fund and growth financing vehicles that support personalization, fraud detection, and automation workflows for e-commerce and B2B procurement. Cross-border enablement remains an operational lever, supported by Canada's participation in WTO electronic commerce discussions and emerging standards-aligned digital trade workflow efforts such as TransPacific Trade Nexus (TPTN) prototype and pilot dialogue as of March 2026.
Recent Industry Developments
- June 2026: Walmart Canada launched Walmart+ in Canada, bundling unlimited same-day store delivery, free shipping on Walmart.ca with no order minimum, and a Crave subscription. The move intensifies the membership-led competition for purchase frequency and retention, and it raises service-level expectations for delivery and digital benefits across mass retail.
- April 2026: Shopify completed its acquisition of Deliverr for USD 2.1 billion, deepening its fulfillment capabilities for merchants targeting faster delivery promises. By strengthening two-day coverage, the deal increases competitive pressure on marketplaces and large omnichannel retailers that use logistics speed as a primary differentiator.
- February 2025: Walmart Canada introduced a Delivery-as-a-Service model, offering same-day last-mile solutions to third-party sellers. This monetizes existing logistics capacity and expands options for marketplace sellers that need rapid delivery coverage in major urban corridors.


Research Methodology Framework and Report Scope
Market Definition and Coverage
For this report, the Canada e-commerce market is defined as the value of goods and services ordered through online channels by buyers in Canada, covering purchases completed on websites and apps across B2C and B2B activity.
Scope exclusions: We exclude offline sales that are only influenced by online marketing and any purely in-store transactions without an online order step.
Segmentation Overview
- By Business Model
- B2C
- B2B
- By Device Type
- Smartphone / Mobile
- Desktop and Laptop
- Other Device Types
- By Payment Method
- Credit / Debit Cards
- Digital Wallets
- BNPL
- Other Payment Method
- By B2C Product Category
- Beauty and Personal Care
- Consumer Electronics
- Fashion and Apparel
- Food and Beverages
- Furniture and Home
- Toys, DIY and Media
- Other Product Categories
Data Sources, Market Sizing, and Validation
Desk Research
Desk research was used to anchor the model to measurable signals that reflect how online commerce behaves in Canada, and then to sanity-check results against broader retail and digital economy context. We reviewed public statistics first, such as Statistics Canada retail e-commerce and retail trade tables, along with Bank of Canada releases on consumer and credit conditions that affect online spend.
To add external checks, we also referenced Government of Canada and Canada Border Services Agency materials on duties and cross-border compliance, plus Canada Post public updates that indicate delivery capacity and service changes. We also reviewed peer-reviewed journals covering online shopping behavior and returns. Supporting sources such as company filings, quarterly investor presentations, reputable press, and marketplace seller updates helped interpret promotion intensity and pricing moves that influence average order value. Where it helped, we used paid subscriptions for company financials and intelligence, and for news and financials tracking, so event timing and disclosures were captured consistently. The sources listed are illustrative only, and many other public and paid references were used for data collection, cross-checking, and clarification during the work.
Primary Interviews and Surveys
Primary work focused on confirming how the Canada online demand pool is forming and how much of it is captured through digital checkout, which is not always clear from published series alone. Our interviews and surveys covered e-commerce operators, brands, logistics and fulfillment participants, and enabling-service stakeholders. This input was used to validate assumptions on category mix, promotion depth, and average selling price patterns, then we re-checked where responses suggested gaps.
Distribution of primary research fieldwork respondents
| Company type | Respondent position | Region |
|---|---|---|
| Top tier: 34% | CXOs: 15% | |
| Mid tier: 49% | Functional/Unit leaders: 31% | |
| Smaller Players: 17% | Managers: 54% |
Market-Sizing & Forecasting
Sizing was built using a top-down and bottom-up logic. In the top-down build, we started from Canada online spending signals and then reallocated value into e-commerce using observed channel mix, category composition, and purchase frequency patterns. Because retail-only e-commerce series do not capture all online commerce, we adjusted totals using inputs on B2B online ordering intensity and the mix of goods versus service-type orders that pass through online checkout.
To keep the model practical and repeatable, we relied on a short list of market fingerprints that can be refreshed each cycle, including online order frequency, average order value progression, smartphone-led purchase behavior, delivery speed expectations that change cart size, and cross-border share shifts that impact pricing in USD terms. Forecasts were developed using scenario analysis tied to macro demand conditions and category-level adoption, then tuned using expert views on discounting, shipping fee strategies, and returns friction. Where bottom-up details were patchy, we used selective supplier and channel checks (sampled category volumes paired with realistic price bands) to close gaps without forcing a full roll-up that public data cannot support.
Data Validation & Update Cycle
Validation was done by checking the modeled totals against independent indicators, and then reviewing any large variances before final sign-off. We compared the implied online share with published retail e-commerce series, reconciled directionally with company disclosures, and re-checked step-changes against known events like tax and duty changes or major fulfillment policy shifts.
Outputs go through multi-step analyst review, where inputs, calculations, and assumptions are re-tested and notes are documented so the steps can be repeated. If new information creates a meaningful change in pricing, currency translation, or category mix, respondents are re-contacted to confirm the shift and reduce guesswork. The report is refreshed annually, with interim updates for material events, and a final pre-delivery review is completed so clients receive the latest updated view.
Mordor Intelligence's Canada Ecommerce Market Sizing Compared With Other Published Estimates
Published estimates for Canada e-commerce often vary because the timing of currency conversion, price inflation handling, and category mix updates are not aligned. These differences can move value totals in either direction. The numbers also change when some publishers rely mainly on retail e-commerce series, while others blend in wider online ordering that is not strictly retail.
In this market, the main gap drivers tend to be whether B2B online ordering is included, how cross-border online purchases are treated, and how average selling prices are advanced from the base year during periods of heavy promotions and shipping-fee changes. When the model is refreshed using a consistent FX window and re-validated against the latest order frequency and online share signals, the market size stays tied to real transaction behavior, reflecting the refresh-led discipline applied in Mordor Intelligence.
Benchmark comparison
| Source | Market Size | Gaps in Research Methodology |
|---|---|---|
| Mordor Intelligence | USD 41.79 B (2025) | |
| Industry Association A | USD 47.60 B (2025) | This estimate can run higher when broader online retail spending proxies are used and marketplace activity is treated like full transaction value without consistently separating cancellations, returns, or service-heavy orders. |
| Global Consultancy B | USD 38.20 B (2025) | This figure appears closer to a retail-only definition of e-commerce and can undercount non-retail online orders and parts of B2B purchasing that still move through online checkout, which pulls the total down. |
The table shows that most dispersion is explained by what is counted as an online order, plus how pricing and currency timing are carried into the base year. By keeping the inputs traceable to demand and pricing checks, and by revisiting the key assumptions on a set refresh cycle, we produce a market value that can be repeated and audited with the same steps.


Key Questions Answered in the Report
What is the current value of the Canada e-commerce market?
The market is valued at USD 45.66 billion in 2026 and is on track to reach USD 71.04 billion by 2031.
Which segment is expanding fastest within the Canada e-commerce market?
The B2B channel is growing at a 12.17% CAGR, outpacing the broader market’s 9.27% CAGR.
How quickly is mobile commerce growing?
Smartphone-based transactions are advancing at an 17.62% CAGR, eroding desktop’s historical dominance.
What payment method shows the highest growth momentum?
Buy Now Pay Later solutions are scaling at a 18.82% CAGR and are raising average order values by up to 45%.
How concentrated is the competitive landscape?
The top five companies hold around 40% market share, indicating moderate concentration and room for specialized entrants.
How are government grants influencing small business e-commerce adoption?
CDAP grants of up to CAD 15,000 have helped over 15,000 SMBs launch or upgrade online stores, driving 32% average sales lifts within six months.
Page last updated on:


