| Study Period | 2017 - 2030 |
| Base Year For Estimation | 2024 |
| Forecast Data Period | 2025 - 2030 |
| Market Size (2025) | USD 16.2 Billion |
| Market Size (2030) | USD 21.3 Billion |
| CAGR (2025 - 2030) | 5.63 % |
| Market Concentration | Medium |
Major Players*Disclaimer: Major Players sorted in no particular order |

Canada Dairy Market Analysis
The Canada Dairy Market size is estimated at 16.2 billion USD in 2025, and is expected to reach 21.3 billion USD by 2030, growing at a CAGR of 5.63% during the forecast period (2025-2030).
The Canadian dairy industry operates under a sophisticated supply management system that coordinates planned domestic production, administered pricing, and import controls. The retail landscape has evolved significantly, with over 15,000 supermarkets operating across Canada in 2022, predominantly concentrated in Ontario and Quebec. This extensive retail network has been instrumental in maintaining stable product availability and pricing. The industry's structure continues to support both large-scale producers and smaller regional dairy farms, fostering a diverse and competitive market environment. Supermarkets and hypermarkets have emerged as the dominant retail channel, accounting for 79.3% of dairy product sales in 2022, highlighting the crucial role of organized retail in product distribution.
Consumer preferences in Canada's dairy market reflect a growing emphasis on health and nutrition, with approximately 40% of consumers specifically choosing dairy products for their nutritional benefits. The market has witnessed a significant shift toward premium and specialized products, particularly in cheese consumption, which reached 10.17 kilograms per capita in 2022. Product innovation has focused on addressing diverse consumer needs, including lactose-free options, organic variants, and fortified dairy products. Manufacturers have responded by expanding their product portfolios and introducing new flavors and formulations to meet these evolving consumer preferences.
The distribution landscape has undergone substantial transformation, with the off-trade sector experiencing a 3.3% growth in 2022 compared to the previous year. The foodservice sector has maintained its significance, with over 97,000 restaurants operational in 2022, contributing to the robust on-trade segment. Multi-channel distribution strategies have become increasingly important, with retailers adopting hybrid models that combine traditional retail presence with digital capabilities. The market has seen particular success in implementing click-and-collect services, allowing consumers to combine the convenience of online shopping with traditional retail pickup.
Digital transformation has become a cornerstone of market development, with approximately 75% of the Canadian population actively engaging in e-commerce for dairy products in 2022. Online retail platforms have enhanced their dairy product offerings, implementing sophisticated cold chain logistics to ensure product quality during delivery. Major retailers have invested in advanced inventory management systems and consumer analytics to optimize stock levels and reduce waste. The integration of digital payment solutions and mobile applications has further streamlined the purchasing process, with retailers offering personalized promotions and loyalty programs through digital channels.
Canada Dairy Market Trends
Increase in dairy product consumption in Canada attributed to dairy being a nutritionally valuable and essential component of a healthy diet
- In Canada, 40% of consumers turn to dairy products that are rich in nutrition for better health. The popularity of dairy products is due to their importance in an overall well-balanced and healthy diet. Among overall dairy products, milk remains the most popular. In 2021, 61% of consumers turned to fresh milk. The number of consumers using these products has not changed over the past few years. This indicates that even though consumers try to improve their health through nutrition, they are not cutting down on their intake of fresh milk.
- Though the per capita consumption of drinking milk declined in 2020, COVID-19 temporarily slowed the trend, as consumers spent more time at home. In 2021, the declining trend in fluid milk consumption resumed, and it is now expected to continue during the forecast period. The per capita consumption of milk is anticipated to grow by 6.6% in 2024 from 2021.
- The recent positive change in consumer perception toward consuming foods rich in butterfat has had an impact on the per capita consumption of cheese. After a flat or declining trend for a long period, Canadians increased their per capita consumption of cheese with new records almost every year till 2022. The per capita consumption of cheese was slightly affected by COVID-19, which decreased by 7.8% of the population in 2020. Strong retail grocery demand, either directly or in processed products, and the demand from the fast-food restaurant sub-segment, are expected to drive the per capita consumption of dairy. The per capita consumption of cheese is anticipated to increase by 7.2% in 2024 from 2021.

Understand The Key Trends Shaping This Market
Download PDF
OTHER KEY INDUSTRY TRENDS COVERED IN THE REPORT
- Increased commercial manufacturing of baked goods and expanded market access under Canada's trade agreements impact the production of butter
- The growth in the production of milk for industrial purposes and increased cash receipts from milk and cream sales off farms boosted milk consumption in Canada
- Increase in cheese production attributed to consistent high demand for different cheese products with facilitated cheese exports
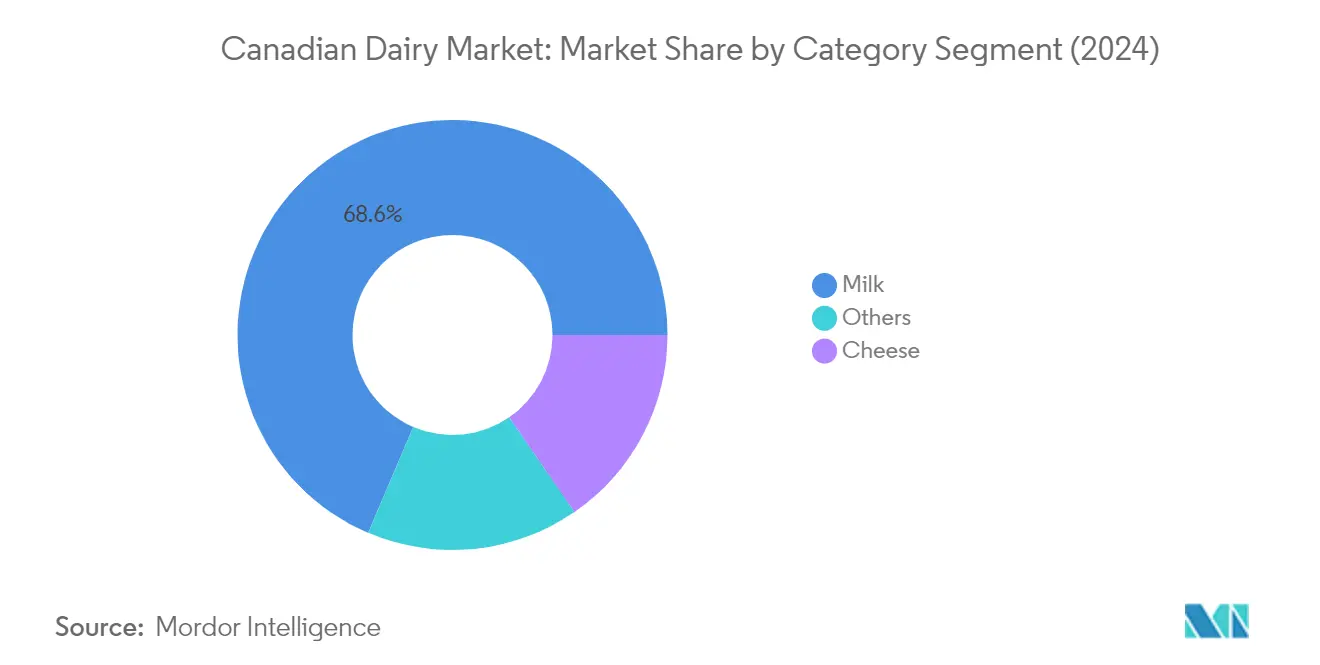
Segment Analysis: Category
Milk Segment in Canadian Dairy Market
The milk segment continues to dominate the Canadian dairy market, commanding approximately 69% of the total market share in 2024. This substantial market position is primarily driven by fresh milk, which accounts for the majority of consumption, followed by UHT milk with around a 13% share. The segment's strength is reinforced by Canada's robust supply management system that ensures planned domestic production and administered pricing. The productivity of Canadian dairy cows has been steadily increasing due to improved genetics, enhanced management practices, better feed quality, and greater adoption of robotic milking technologies that increase total milking efficiency per day. The segment serves two primary markets: the fluid milk market for direct consumption and the industrial milk market for manufacturing various dairy products.
Cheese Segment in Canadian Dairy Market
The cheese segment is demonstrating remarkable growth potential in the Canadian dairy market, with a projected growth rate of approximately 8% during 2024-2029. This impressive growth trajectory is driven by several factors, including the increasing consumer preference for protein-rich foods and the expanding use of cheese in diverse menu offerings. The segment's expansion is further supported by government initiatives, exemplified by significant investments through the Dairy Processing Investment Fund to help processors adapt to market changes. The growth is particularly notable in natural cheese varieties, with cheddar cheese leading production volumes. Canadian cheese producers are actively expanding their product portfolios with new varieties and focusing on premium offerings to meet evolving consumer preferences.
Remaining Segments in Canadian Dairy Market
The Canadian dairy market encompasses several other significant segments, including butter, cream, dairy desserts, sour milk drinks, and yogurt, each contributing uniquely to the market's diversity. The butter segment, comprising both cultured and uncultured varieties, plays a crucial role in both retail and industrial applications. The cream segment, with its various subcategories including double cream, single cream, and whipping cream, caters to both household and commercial culinary needs. Dairy desserts, particularly ice cream and frozen desserts, represent a growing segment driven by innovation in flavors and formats. The yogurt segment, with both flavored and unflavored varieties, continues to evolve with new probiotic and functional offerings. Sour milk drinks maintain a steady presence in the market, particularly appealing to health-conscious consumers seeking probiotic benefits.
Segment Analysis: Distribution Channel
Off-trade Segment in Canadian Dairy Market
The off-trade distribution channel dominates the Canadian dairy market, commanding approximately 76% market share in 2024, driven by the extensive network of supermarkets, hypermarkets, convenience stores, and online retail platforms. This segment's prominence is attributed to the widespread accessibility of dairy products through various retail formats and the increasing consumer preference for purchasing dairy products during regular grocery shopping trips. The segment's growth is further propelled by the rising adoption of e-commerce platforms, with major retailers like Walmart, Amazon, and local supermarket chains expanding their online presence. Supermarkets and hypermarkets contribute significantly to this channel's success, offering extensive product varieties, competitive pricing, and frequent promotional activities. The off-trade segment is expected to maintain its strong growth trajectory with a projected growth rate of approximately 5% from 2024 to 2029, driven by technological advancements in retail operations, improved cold chain logistics, and the increasing penetration of organized retail formats across Canada.
On-trade Segment in Canadian Dairy Market
The on-trade distribution channel, encompassing restaurants, cafes, and foodservice operators, represents a vital component of Canada's dairy market. This segment serves as a crucial platform for dairy product consumption through food establishments, particularly for products like cheese, cream, and butter used in food preparation. The channel's significance is underscored by the growing trend of out-of-home food consumption and the expanding foodservice industry in Canada. With over 97,000 restaurants operating across the country and an increasing number of Canadians preferring to dine out, the on-trade segment continues to play an essential role in driving dairy product consumption. The segment's evolution is also influenced by changing consumer preferences, with many establishments incorporating innovative dairy-based dishes and beverages into their menus to cater to diverse customer preferences.
Canada Dairy Industry Overview
Top Companies in Canada Dairy Market
The Canadian dairy companies market is characterized by companies focusing heavily on product innovation and operational excellence to maintain their competitive edge. Major players are actively expanding their product portfolios through new launches targeting health-conscious consumers, including organic, lactose-free, and fortified dairy products. Operational agility is demonstrated through investments in modernizing manufacturing facilities and adopting advanced technologies for dairy processing efficiency. Strategic moves in the industry primarily revolve around strengthening distribution networks and establishing partnerships with local dairy farming operations to ensure consistent supply. Companies are also expanding their geographical presence through strategic acquisitions and investments in new production facilities, particularly in key dairy-producing regions like Ontario and Quebec.
Market Led By Domestic Cooperative Players
The Canadian dairy market exhibits a unique structure dominated by large domestic cooperatives and established multinational corporations. Local cooperative players like Saputo Inc. and Agropur Dairy Cooperative maintain significant market presence through their strong relationships with Canadian dairy farmers and extensive distribution networks. The market shows moderate consolidation with the largest dairy companies in Canada controlling substantial market share, while still allowing space for specialized regional players focusing on premium and niche dairy products. These regional players often compete through product differentiation and local market expertise.
Merger and acquisition activity in the market is primarily driven by larger players seeking to expand their product portfolios and geographic reach. Global top dairy companies in Canada are entering the Canadian market through strategic acquisitions of established local players, bringing international expertise and innovation capabilities. The industry also sees vertical integration attempts, with companies acquiring or partnering with dairy farms and distribution channels to strengthen their supply chain control and market presence.
Innovation and Distribution Drive Market Success
Success in the Canadian dairy market increasingly depends on companies' ability to innovate while maintaining operational efficiency. Players must focus on developing products that align with emerging consumer preferences for health, sustainability, and convenience. Building strong relationships with retailers and investing in multiple distribution channels, including e-commerce platforms, is crucial for market success. Companies need to maintain robust quality control systems and comply with stringent regulatory requirements while optimizing their production costs to remain competitive.
For new entrants and smaller players, success lies in identifying and serving niche market segments with specialized products. This includes focusing on premium organic products, specialty cheeses, or innovative dairy alternatives. Companies must also consider potential regulatory changes in the dairy industry, particularly regarding supply management systems and international trade agreements. Building strong brand recognition through targeted marketing campaigns and maintaining transparency in sourcing and production practices are becoming increasingly important for market success.
Canada Dairy Market Leaders
-
Agropur Dairy Cooperative
-
Danone SA
-
Groupe Lactalis
-
Saputo Inc.
-
The Kraft Heinz Company
- *Disclaimer: Major Players sorted in no particular order

Need More Details on Market Players and Competitors?
Download PDF
Canada Dairy Market News
- December 2022: Lactalis Canada acquired Kraft Heinz's Grated Cheese business in Canada, marking its entry into the ambient category.
- November 2022: The Kraft Heinz Company launched the cheesecake kit Philly Handbag.
- June 2022: Danone North America partnered with White Plains, Boulder, and Colo and launched Activia+ Multi-Benefit Probiotic Yogurt Drinks.
Free With This Report
We provide a comprehensive and exhaustive set of data pointers for global, regional, and country-level metrics that illustrate the fundamentals of the dairy industry. With the help of 45+ free charts, clients can access in-depth market analysis based on per capita consumption numbers and production data of raw materials for dairy, through granular-level segmental information supported by a repository of market data, trends, and expert analysis. Data and analysis on dairy, categories of dairy products, product types, etc., are available in the form of comprehensive reports as well as excel based data worksheets.


Canada Dairy Market Report - Table of Contents
1. EXECUTIVE SUMMARY & KEY FINDINGS
2. REPORT OFFERS
3. INTRODUCTION
- 3.1 Study Assumptions & Market Definition
- 3.2 Scope of the Study
- 3.3 Research Methodology
4. KEY INDUSTRY TRENDS
- 4.1 Per Capita Consumption
-
4.2 Raw Material/commodity Production
- 4.2.1 Butter
- 4.2.2 Cheese
- 4.2.3 Milk
-
4.3 Regulatory Framework
- 4.3.1 Canada
- 4.4 Value Chain & Distribution Channel Analysis
5. MARKET SEGMENTATION (includes market size in Value in USD and Volume, Forecasts up to 2030 and analysis of growth prospects)
-
5.1 Category
- 5.1.1 Butter
- 5.1.1.1 By Product Type
- 5.1.1.1.1 Cultured Butter
- 5.1.1.1.2 Uncultured Butter
- 5.1.2 Cheese
- 5.1.2.1 By Product Type
- 5.1.2.1.1 Natural Cheese
- 5.1.2.1.2 Processed Cheese
- 5.1.3 Cream
- 5.1.3.1 By Product Type
- 5.1.3.1.1 Double Cream
- 5.1.3.1.2 Single Cream
- 5.1.3.1.3 Whipping Cream
- 5.1.3.1.4 Others
- 5.1.4 Dairy Desserts
- 5.1.4.1 By Product Type
- 5.1.4.1.1 Cheesecakes
- 5.1.4.1.2 Frozen Desserts
- 5.1.4.1.3 Ice Cream
- 5.1.4.1.4 Mousses
- 5.1.4.1.5 Others
- 5.1.5 Milk
- 5.1.5.1 By Product Type
- 5.1.5.1.1 Condensed milk
- 5.1.5.1.2 Flavored Milk
- 5.1.5.1.3 Fresh Milk
- 5.1.5.1.4 Powdered Milk
- 5.1.5.1.5 UHT Milk
- 5.1.6 Sour Milk Drinks
- 5.1.7 Yogurt
- 5.1.7.1 By Product Type
- 5.1.7.1.1 Flavored Yogurt
- 5.1.7.1.2 Unflavored Yogurt
-
5.2 Distribution Channel
- 5.2.1 Off-Trade
- 5.2.1.1 Convenience Stores
- 5.2.1.2 Online Retail
- 5.2.1.3 Specialist Retailers
- 5.2.1.4 Supermarkets and Hypermarkets
- 5.2.1.5 Others (Warehouse clubs, gas stations, etc.)
- 5.2.2 On-Trade
6. COMPETITIVE LANDSCAPE
- 6.1 Key Strategic Moves
- 6.2 Market Share Analysis
- 6.3 Company Landscape
-
6.4 Company Profiles (includes Global Level Overview, Market Level Overview, Core Business Segments, Financials, Headcount, Key Information, Market Rank, Market Share, Products and Services, and Analysis of Recent Developments).
- 6.4.1 Agropur Dairy Cooperative
- 6.4.2 Amalgamated Dairies Ltd
- 6.4.3 Danone SA
- 6.4.4 Gay Lea Foods Co-operative Limited
- 6.4.5 Groupe Lactalis
- 6.4.6 Maple Dale Cheese Inc.
- 6.4.7 Organic Meadow Limited Partnership
- 6.4.8 Reid’s Dairy Company Ltd
- 6.4.9 Saputo Inc.
- 6.4.10 St-Albert Cheese Co-operative
- 6.4.11 The Kraft Heinz Company
7. KEY STRATEGIC QUESTIONS FOR DAIRY AND DAIRY ALTERNATIVE CEOS
8. APPENDIX
-
8.1 Global Overview
- 8.1.1 Overview
- 8.1.2 Porter’s Five Forces Framework
- 8.1.3 Global Value Chain Analysis
- 8.1.4 Market Dynamics (DROs)
- 8.2 Sources & References
- 8.3 List of Tables & Figures
- 8.4 Primary Insights
- 8.5 Data Pack
- 8.6 Glossary of Terms
You Can Purchase Parts Of This Report. Check Out Prices For Specific Sections
Get Price Break-up Now
List of Tables & Figures
- Figure 1:
- PER CAPITA CONSUMPTION OF MILK, BUTTER, CHEESE, KG, CANADA, 2017 - 2029
- Figure 2:
- PRODUCTION OF BUTTER, METRIC TONNES, CANADA, 2017 - 2021
- Figure 3:
- PRODUCTION OF CHEESE, METRIC TONNES, CANADA, 2017 - 2021
- Figure 4:
- PRODUCTION OF MILK, METRIC TONNES, CANADA, 2017 - 2021
- Figure 5:
- VOLUME OF DAIRY, METRIC TONNES, BY CANADA, 2017 - 2029
- Figure 6:
- VALUE OF DAIRY, USD MN, BY CANADA, 2017 - 2029
- Figure 7:
- VOLUME OF DAIRY MARKET BY CATEGORY, METRIC TONNES, CANADA, 2017 - 2029
- Figure 8:
- VALUE OF DAIRY MARKET BY CATEGORY, USD MN, CANADA, 2017 - 2029
- Figure 9:
- VOLUME SHARE OF DAIRY MARKET, BY CATEGORY , %, CANADA, 2017 VS 2023 VS 2029
- Figure 10:
- VALUE SHARE OF DAIRY MARKET, BY CATEGORY , %, CANADA, 2017 VS 2023 VS 2029
- Figure 11:
- VOLUME OF BUTTER MARKET BY PRODUCT TYPE, METRIC TONNES, CANADA, 2017 - 2029
- Figure 12:
- VALUE OF BUTTER MARKET BY PRODUCT TYPE, USD MN, CANADA, 2017 - 2029
- Figure 13:
- VOLUME SHARE OF BUTTER MARKET BY PRODUCT TYPE, %, CANADA, 2017 VS 2023 VS 2029
- Figure 14:
- VALUE SHARE OF BUTTER MARKET BY PRODUCT TYPE, %, CANADA, 2017 VS 2023 VS 2029
- Figure 15:
- VOLUME OF CULTURED BUTTER MARKET, METRIC TONNES, CANADA, 2017 - 2029
- Figure 16:
- VALUE OF CULTURED BUTTER MARKET, USD MN, CANADA, 2017 - 2029
- Figure 17:
- VALUE SHARE OF CULTURED BUTTER MARKET, BY DISTRIBUTION CHANNEL , %, CANADA, 2022 VS 2029
- Figure 18:
- VOLUME OF UNCULTURED BUTTER MARKET, METRIC TONNES, CANADA, 2017 - 2029
- Figure 19:
- VALUE OF UNCULTURED BUTTER MARKET, USD MN, CANADA, 2017 - 2029
- Figure 20:
- VALUE SHARE OF UNCULTURED BUTTER MARKET, BY DISTRIBUTION CHANNEL , %, CANADA, 2022 VS 2029
- Figure 21:
- VOLUME OF CHEESE MARKET BY PRODUCT TYPE, METRIC TONNES, CANADA, 2017 - 2029
- Figure 22:
- VALUE OF CHEESE MARKET BY PRODUCT TYPE, USD MN, CANADA, 2017 - 2029
- Figure 23:
- VOLUME SHARE OF CHEESE MARKET BY PRODUCT TYPE, %, CANADA, 2017 VS 2023 VS 2029
- Figure 24:
- VALUE SHARE OF CHEESE MARKET BY PRODUCT TYPE, %, CANADA, 2017 VS 2023 VS 2029
- Figure 25:
- VOLUME OF NATURAL CHEESE MARKET, METRIC TONNES, CANADA, 2017 - 2029
- Figure 26:
- VALUE OF NATURAL CHEESE MARKET, USD MN, CANADA, 2017 - 2029
- Figure 27:
- VALUE SHARE OF NATURAL CHEESE MARKET, BY DISTRIBUTION CHANNEL , %, CANADA, 2022 VS 2029
- Figure 28:
- VOLUME OF PROCESSED CHEESE MARKET, METRIC TONNES, CANADA, 2017 - 2029
- Figure 29:
- VALUE OF PROCESSED CHEESE MARKET, USD MN, CANADA, 2017 - 2029
- Figure 30:
- VALUE SHARE OF PROCESSED CHEESE MARKET, BY DISTRIBUTION CHANNEL , %, CANADA, 2022 VS 2029
- Figure 31:
- VOLUME OF CREAM MARKET BY PRODUCT TYPE, METRIC TONNES, CANADA, 2017 - 2029
- Figure 32:
- VALUE OF CREAM MARKET BY PRODUCT TYPE, USD MN, CANADA, 2017 - 2029
- Figure 33:
- VOLUME SHARE OF CREAM MARKET BY PRODUCT TYPE, %, CANADA, 2017 VS 2023 VS 2029
- Figure 34:
- VALUE SHARE OF CREAM MARKET BY PRODUCT TYPE, %, CANADA, 2017 VS 2023 VS 2029
- Figure 35:
- VOLUME OF DOUBLE CREAM MARKET, METRIC TONNES, CANADA, 2017 - 2029
- Figure 36:
- VALUE OF DOUBLE CREAM MARKET, USD MN, CANADA, 2017 - 2029
- Figure 37:
- VALUE SHARE OF DOUBLE CREAM MARKET, BY DISTRIBUTION CHANNEL , %, CANADA, 2022 VS 2029
- Figure 38:
- VOLUME OF SINGLE CREAM MARKET, METRIC TONNES, CANADA, 2017 - 2029
- Figure 39:
- VALUE OF SINGLE CREAM MARKET, USD MN, CANADA, 2017 - 2029
- Figure 40:
- VALUE SHARE OF SINGLE CREAM MARKET, BY DISTRIBUTION CHANNEL , %, CANADA, 2022 VS 2029
- Figure 41:
- VOLUME OF WHIPPING CREAM MARKET, METRIC TONNES, CANADA, 2017 - 2029
- Figure 42:
- VALUE OF WHIPPING CREAM MARKET, USD MN, CANADA, 2017 - 2029
- Figure 43:
- VALUE SHARE OF WHIPPING CREAM MARKET, BY DISTRIBUTION CHANNEL , %, CANADA, 2022 VS 2029
- Figure 44:
- VOLUME OF OTHERS MARKET, METRIC TONNES, CANADA, 2017 - 2029
- Figure 45:
- VALUE OF OTHERS MARKET, USD MN, CANADA, 2017 - 2029
- Figure 46:
- VALUE SHARE OF OTHERS MARKET, BY DISTRIBUTION CHANNEL , %, CANADA, 2022 VS 2029
- Figure 47:
- VOLUME OF DAIRY DESSERTS MARKET BY PRODUCT TYPE, METRIC TONNES, CANADA, 2017 - 2029
- Figure 48:
- VALUE OF DAIRY DESSERTS MARKET BY PRODUCT TYPE, USD MN, CANADA, 2017 - 2029
- Figure 49:
- VOLUME SHARE OF DAIRY DESSERTS MARKET BY PRODUCT TYPE, %, CANADA, 2017 VS 2023 VS 2029
- Figure 50:
- VALUE SHARE OF DAIRY DESSERTS MARKET BY PRODUCT TYPE, %, CANADA, 2017 VS 2023 VS 2029
- Figure 51:
- VOLUME OF CHEESECAKES MARKET, METRIC TONNES, CANADA, 2017 - 2029
- Figure 52:
- VALUE OF CHEESECAKES MARKET, USD MN, CANADA, 2017 - 2029
- Figure 53:
- VALUE SHARE OF CHEESECAKES MARKET, BY DISTRIBUTION CHANNEL , %, CANADA, 2022 VS 2029
- Figure 54:
- VOLUME OF FROZEN DESSERTS MARKET, METRIC TONNES, CANADA, 2017 - 2029
- Figure 55:
- VALUE OF FROZEN DESSERTS MARKET, USD MN, CANADA, 2017 - 2029
- Figure 56:
- VALUE SHARE OF FROZEN DESSERTS MARKET, BY DISTRIBUTION CHANNEL , %, CANADA, 2022 VS 2029
- Figure 57:
- VOLUME OF ICE CREAM MARKET, METRIC TONNES, CANADA, 2017 - 2029
- Figure 58:
- VALUE OF ICE CREAM MARKET, USD MN, CANADA, 2017 - 2029
- Figure 59:
- VALUE SHARE OF ICE CREAM MARKET, BY DISTRIBUTION CHANNEL , %, CANADA, 2022 VS 2029
- Figure 60:
- VOLUME OF MOUSSES MARKET, METRIC TONNES, CANADA, 2017 - 2029
- Figure 61:
- VALUE OF MOUSSES MARKET, USD MN, CANADA, 2017 - 2029
- Figure 62:
- VALUE SHARE OF MOUSSES MARKET, BY DISTRIBUTION CHANNEL , %, CANADA, 2022 VS 2029
- Figure 63:
- VOLUME OF OTHERS MARKET, METRIC TONNES, CANADA, 2017 - 2029
- Figure 64:
- VALUE OF OTHERS MARKET, USD MN, CANADA, 2017 - 2029
- Figure 65:
- VALUE SHARE OF OTHERS MARKET, BY DISTRIBUTION CHANNEL , %, CANADA, 2022 VS 2029
- Figure 66:
- VOLUME OF MILK MARKET BY PRODUCT TYPE, METRIC TONNES, CANADA, 2017 - 2029
- Figure 67:
- VALUE OF MILK MARKET BY PRODUCT TYPE, USD MN, CANADA, 2017 - 2029
- Figure 68:
- VOLUME SHARE OF MILK MARKET BY PRODUCT TYPE, %, CANADA, 2017 VS 2023 VS 2029
- Figure 69:
- VALUE SHARE OF MILK MARKET BY PRODUCT TYPE, %, CANADA, 2017 VS 2023 VS 2029
- Figure 70:
- VOLUME OF CONDENSED MILK MARKET, METRIC TONNES, CANADA, 2017 - 2029
- Figure 71:
- VALUE OF CONDENSED MILK MARKET, USD MN, CANADA, 2017 - 2029
- Figure 72:
- VALUE SHARE OF CONDENSED MILK MARKET, BY DISTRIBUTION CHANNEL , %, CANADA, 2022 VS 2029
- Figure 73:
- VOLUME OF FLAVORED MILK MARKET, METRIC TONNES, CANADA, 2017 - 2029
- Figure 74:
- VALUE OF FLAVORED MILK MARKET, USD MN, CANADA, 2017 - 2029
- Figure 75:
- VALUE SHARE OF FLAVORED MILK MARKET, BY DISTRIBUTION CHANNEL , %, CANADA, 2022 VS 2029
- Figure 76:
- VOLUME OF FRESH MILK MARKET, METRIC TONNES, CANADA, 2017 - 2029
- Figure 77:
- VALUE OF FRESH MILK MARKET, USD MN, CANADA, 2017 - 2029
- Figure 78:
- VALUE SHARE OF FRESH MILK MARKET, BY DISTRIBUTION CHANNEL , %, CANADA, 2022 VS 2029
- Figure 79:
- VOLUME OF POWDERED MILK MARKET, METRIC TONNES, CANADA, 2017 - 2029
- Figure 80:
- VALUE OF POWDERED MILK MARKET, USD MN, CANADA, 2017 - 2029
- Figure 81:
- VALUE SHARE OF POWDERED MILK MARKET, BY DISTRIBUTION CHANNEL , %, CANADA, 2022 VS 2029
- Figure 82:
- VOLUME OF UHT MILK MARKET, METRIC TONNES, CANADA, 2017 - 2029
- Figure 83:
- VALUE OF UHT MILK MARKET, USD MN, CANADA, 2017 - 2029
- Figure 84:
- VALUE SHARE OF UHT MILK MARKET, BY DISTRIBUTION CHANNEL , %, CANADA, 2022 VS 2029
- Figure 85:
- VOLUME OF SOUR MILK DRINKS MARKET, METRIC TONNES, CANADA, 2017 - 2029
- Figure 86:
- VALUE OF SOUR MILK DRINKS MARKET, USD MN, CANADA, 2017 - 2029
- Figure 87:
- VALUE SHARE OF SOUR MILK DRINKS MARKET, BY DISTRIBUTION CHANNEL , %, CANADA, 2022 VS 2029
- Figure 88:
- VOLUME OF YOGURT MARKET BY PRODUCT TYPE, METRIC TONNES, CANADA, 2017 - 2029
- Figure 89:
- VALUE OF YOGURT MARKET BY PRODUCT TYPE, USD MN, CANADA, 2017 - 2029
- Figure 90:
- VOLUME SHARE OF YOGURT MARKET BY PRODUCT TYPE, %, CANADA, 2017 VS 2023 VS 2029
- Figure 91:
- VALUE SHARE OF YOGURT MARKET BY PRODUCT TYPE, %, CANADA, 2017 VS 2023 VS 2029
- Figure 92:
- VOLUME OF FLAVORED YOGURT MARKET, METRIC TONNES, CANADA, 2017 - 2029
- Figure 93:
- VALUE OF FLAVORED YOGURT MARKET, USD MN, CANADA, 2017 - 2029
- Figure 94:
- VALUE SHARE OF FLAVORED YOGURT MARKET, BY DISTRIBUTION CHANNEL , %, CANADA, 2022 VS 2029
- Figure 95:
- VOLUME OF UNFLAVORED YOGURT MARKET, METRIC TONNES, CANADA, 2017 - 2029
- Figure 96:
- VALUE OF UNFLAVORED YOGURT MARKET, USD MN, CANADA, 2017 - 2029
- Figure 97:
- VALUE SHARE OF UNFLAVORED YOGURT MARKET, BY DISTRIBUTION CHANNEL , %, CANADA, 2022 VS 2029
- Figure 98:
- VOLUME OF DAIRY MARKET BY DISTRIBUTION CHANNEL, METRIC TONNES, CANADA, 2017 - 2029
- Figure 99:
- VALUE OF DAIRY MARKET BY DISTRIBUTION CHANNEL, USD MN, CANADA, 2017 - 2029
- Figure 100:
- VOLUME SHARE OF DAIRY MARKET, BY DISTRIBUTION CHANNEL , %, CANADA, 2017 VS 2023 VS 2029
- Figure 101:
- VALUE SHARE OF DAIRY MARKET, BY DISTRIBUTION CHANNEL , %, CANADA, 2017 VS 2023 VS 2029
- Figure 102:
- VOLUME OF DAIRY MARKET BY SUB DISTRIBUTION CHANNELS, METRIC TONNES, CANADA, 2017 - 2029
- Figure 103:
- VALUE OF DAIRY MARKET BY SUB DISTRIBUTION CHANNELS, USD MN, CANADA, 2017 - 2029
- Figure 104:
- VOLUME SHARE OF DAIRY MARKET, BY SUB DISTRIBUTION CHANNELS , %, CANADA, 2017 VS 2023 VS 2029
- Figure 105:
- VALUE SHARE OF DAIRY MARKET, BY SUB DISTRIBUTION CHANNELS , %, CANADA, 2017 VS 2023 VS 2029
- Figure 106:
- VOLUME OF DAIRY MARKET SOLD VIA CONVENIENCE STORES, METRIC TONNES, CANADA, 2017 - 2029
- Figure 107:
- VALUE OF DAIRY MARKET SOLD VIA CONVENIENCE STORES, USD MN, CANADA, 2017 - 2029
- Figure 108:
- VALUE SHARE OF DAIRY MARKET, SOLD VIA CONVENIENCE STORES, BY CATEGORY , %, CANADA, 2022 VS 2029
- Figure 109:
- VOLUME OF DAIRY MARKET SOLD VIA ONLINE RETAIL, METRIC TONNES, CANADA, 2017 - 2029
- Figure 110:
- VALUE OF DAIRY MARKET SOLD VIA ONLINE RETAIL, USD MN, CANADA, 2017 - 2029
- Figure 111:
- VALUE SHARE OF DAIRY MARKET, SOLD VIA ONLINE RETAIL, BY CATEGORY , %, CANADA, 2022 VS 2029
- Figure 112:
- VOLUME OF DAIRY MARKET SOLD VIA SPECIALIST RETAILERS, METRIC TONNES, CANADA, 2017 - 2029
- Figure 113:
- VALUE OF DAIRY MARKET SOLD VIA SPECIALIST RETAILERS, USD MN, CANADA, 2017 - 2029
- Figure 114:
- VALUE SHARE OF DAIRY MARKET, SOLD VIA SPECIALIST RETAILERS, BY CATEGORY , %, CANADA, 2022 VS 2029
- Figure 115:
- VOLUME OF DAIRY MARKET SOLD VIA SUPERMARKETS AND HYPERMARKETS, METRIC TONNES, CANADA, 2017 - 2029
- Figure 116:
- VALUE OF DAIRY MARKET SOLD VIA SUPERMARKETS AND HYPERMARKETS, USD MN, CANADA, 2017 - 2029
- Figure 117:
- VALUE SHARE OF DAIRY MARKET, SOLD VIA SUPERMARKETS AND HYPERMARKETS, BY CATEGORY , %, CANADA, 2022 VS 2029
- Figure 118:
- VOLUME OF DAIRY MARKET SOLD VIA OTHERS (WAREHOUSE CLUBS, GAS STATIONS, ETC.), METRIC TONNES, CANADA, 2017 - 2029
- Figure 119:
- VALUE OF DAIRY MARKET SOLD VIA OTHERS (WAREHOUSE CLUBS, GAS STATIONS, ETC.), USD MN, CANADA, 2017 - 2029
- Figure 120:
- VALUE SHARE OF DAIRY MARKET, SOLD VIA OTHERS (WAREHOUSE CLUBS, GAS STATIONS, ETC.), BY CATEGORY , %, CANADA, 2022 VS 2029
- Figure 121:
- VOLUME OF DAIRY MARKET SOLD VIA ON-TRADE, METRIC TONNES, CANADA, 2017 - 2029
- Figure 122:
- VALUE OF DAIRY MARKET SOLD VIA ON-TRADE, USD MN, CANADA, 2017 - 2029
- Figure 123:
- VALUE SHARE OF DAIRY MARKET, SOLD VIA ON-TRADE, BY CATEGORY , %, CANADA, 2022 VS 2029
- Figure 124:
- MOST ACTIVE COMPANIES BY NUMBER OF STRATEGIC MOVES, COUNT, CANADA, 2017 - 2029
- Figure 125:
- MOST ADOPTED STRATEGIES, COUNT, CANADA, 2017 - 2029
- Figure 126:
- VALUE SHARE OF MAJOR PLAYERS, %, CANADA
Canada Dairy Industry Segmentation
Butter, Cheese, Cream, Dairy Desserts, Milk, Sour Milk Drinks, Yogurt are covered as segments by Category. Off-Trade, On-Trade are covered as segments by Distribution Channel.| Category | Butter | By Product Type | Cultured Butter | |
| Uncultured Butter | ||||
| Cheese | By Product Type | Natural Cheese | ||
| Processed Cheese | ||||
| Cream | By Product Type | Double Cream | ||
| Single Cream | ||||
| Whipping Cream | ||||
| Others | ||||
| Dairy Desserts | By Product Type | Cheesecakes | ||
| Frozen Desserts | ||||
| Ice Cream | ||||
| Mousses | ||||
| Others | ||||
| Milk | By Product Type | Condensed milk | ||
| Flavored Milk | ||||
| Fresh Milk | ||||
| Powdered Milk | ||||
| UHT Milk | ||||
| Sour Milk Drinks | ||||
| Yogurt | By Product Type | Flavored Yogurt | ||
| Unflavored Yogurt | ||||
| Distribution Channel | Off-Trade | Convenience Stores | ||
| Online Retail | ||||
| Specialist Retailers | ||||
| Supermarkets and Hypermarkets | ||||
| Others (Warehouse clubs, gas stations, etc.) | ||||
| On-Trade | ||||
Need A Different Region or Segment?
Customize Now
Market Definition
- Butter - Butter is a yellow-to-white solid emulsion of fat globules, water, and inorganic salts produced by churning the cream from cows’ milk
- Dairy - Dairy product include milk and any of the foods made from milk, including butter, cheese, ice cream, yogurt, and condensed and dried milk.
- Frozen Desserts - Frozen dairy dessert means and includes products containing milk or cream and other ingredients which are frozen or semi-frozen prior to consumption, such as ice milk or sherbet, including frozen dairy desserts for special dietary purposes, and sorbet
- Sour Milk Drinks - Sour milk is thick, curdled milk, with a sour taste, obtained from the fermentation of milk. Sour milk drinks such as kefir, laban, buttermilk have been considered in the study
| Keyword | Definition |
|---|---|
| Cultured Butter | Cultured butter is prepared by having the raw butter go through chemical processing and has been added with certain emulsifiers and foreign ingredients. |
| Uncultured Butter | This type of butter is one which has not been processed in any way |
| Natural Cheese | The type of cheese in its most natural form. It is made from natural and simple products and ingredients, including fresh and natural salts, natural colors, enzymes, and high-quality milk. |
| Processed Cheese | Processed cheese undergoes the same processes as natural cheese; however, it requires more steps and many different forms of ingredients. Making processed cheese involves melting natural cheese, emulsifying it, and adding preservatives and other artificial ingredients or colorings. |
| Single Cream | Single cream contains around 18% fat. It’s a single layer of cream that appears over boiled milk. |
| Double Cream | Double cream contains 48% fat, more than double the amount of fat of single cream. It’s heavier and thicker than single cream |
| Whipping Cream | This has a much higher fat percentage than single cream (36%). Used to top cakes, pies, and puddings and as a thickener for sauces, soups, and fillings. |
| Frozen Desserts | Desserts that are meant to be eaten in frozen condition. E.g., sherbets, sorbets, frozen yogurts |
| UHT Milk (Ultra-high temperature milk) | Milk heated at a very high temperature. Ultra-high-temperature processing (UHT) of milk involves heating for 1–8 sec at 135–154°C. which kills the spore-forming pathogenic microorganism, resulting in a product with a shelf-life of several months. |
| Non-dairy butter/Plant-based butter | Butter made from plant-derived oil such as coconut, palm, etc. |
| Non-dairy Yogurt | Yogurt made from typically made from nuts, like almonds, cashews, coconuts, and even other foods like soybeans, plantains, oats, and peas |
| On-trade | It refers to restaurants, QSRs, and bars. |
| Off-trade | It refers to supermarkets, hypermarkets, on-line channels, etc. |
| Neufchatel cheese | One of the oldest kinds of cheese in France. It is a soft, slightly crumbly, mold-ripened, bloomy-rind cheese made in the Neufchâtel-en-Bray region of Normandy. |
| Flexitarian | It refers to a consumer preferring a semi-vegetarian diet, that is centered on plant foods with limited or occasional inclusion of meat. |
| Lactose Intolerance | Lactose intolerance is a reaction in digestive system to lactose, the sugar in milk. It causes uncomfortable symptoms in response to the consumption of dairy products. |
| Cream Cheese | Cream cheese is a soft and creamy fresh cheese with a tangy taste made from milk and cream. |
| Sorbets | Sorbet is a frozen dessert made using ice combined with fruit juice, fruit purée, or other ingredients, such as wine, liqueur, or honey. |
| Sherbet | Sherbet is a sweetened frozen dessert made with fruit and some sort of dairy product such as milk or cream. |
| Shelf stable | Foods that can be safely stored at room temperature, or "on the shelf," for at least one year and do not have to be cooked or refrigerated to eat safely. |
| DSD | Direct Store Delivery is the process in supply chain management wherein the product is delivered from manufacturing plant directly to the retailer. |
| OU Kosher | Orthodox Union Kosher is a kosher certification agency based in New York City. |
| Gelato | Gelato is a frozen creamy dessert made with milk, heavy cream and sugar. |
| Grass-fed Cows | Grass-fed cows are allowed to graze in pastures, where they eat a variety of grasses and clover. |
Need More Details on Market Definition?
Ask a Question
Research Methodology
Mordor Intelligence follows a four-step methodology in all our reports.
- Step-1: Identify Key Variables: In order to build a robust forecasting methodology, the variables and factors identified in Step 1 are tested against available historical market numbers. Through an iterative process, the variables required for market forecast are set, and the model is built on the basis of these variables.
- Step-2: Build a Market Model: Market-size estimations for the forecast years are in nominal terms. Inflation is not a part of the pricing, and the average selling price (ASP) is kept constant throughout the forecast period for each country.
- Step-3: Validate and Finalize: In this important step, all market numbers, variables, and analyst calls are validated through an extensive network of primary research experts from the market studied. The respondents are selected across levels and functions to generate a holistic picture of the market studied.
- Step-4: Research Outputs: Syndicated Reports, Custom Consulting Assignments, Databases & Subscription Platforms

Get More Details On Research Methodology
Download PDF


