
Market Overview
| Study Period | 2020 - 2031 |
|---|---|
| Forecast Data Period | 2026 - 2031 |
| Base Year Market Size (2025) | USD 759.42 Million |
| Market Size (2026) | USD 790.78 Million |
| Market Size (2031) | USD 970.26 Million |
| Growth Rate (2026 - 2031) | 4.18 % |
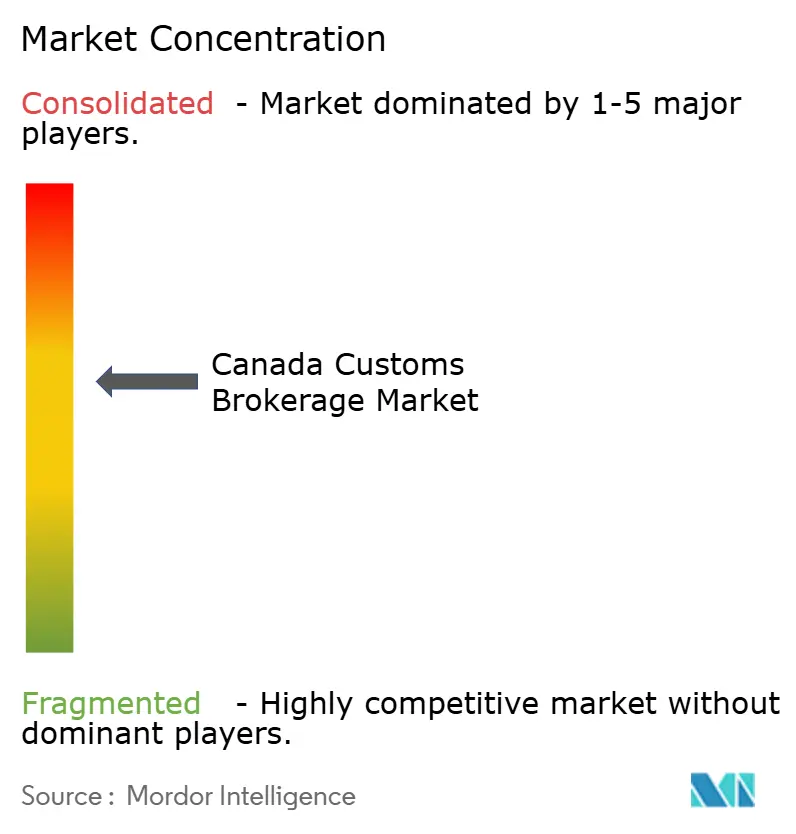
| Market Concentration | Medium |
Major Players *Disclaimer: Major Players sorted in no particular order Image © Mordor Intelligence. Reuse requires attribution under CC BY 4.0. | |
Canada Customs Brokerage Market Analysis by Mordor Intelligence
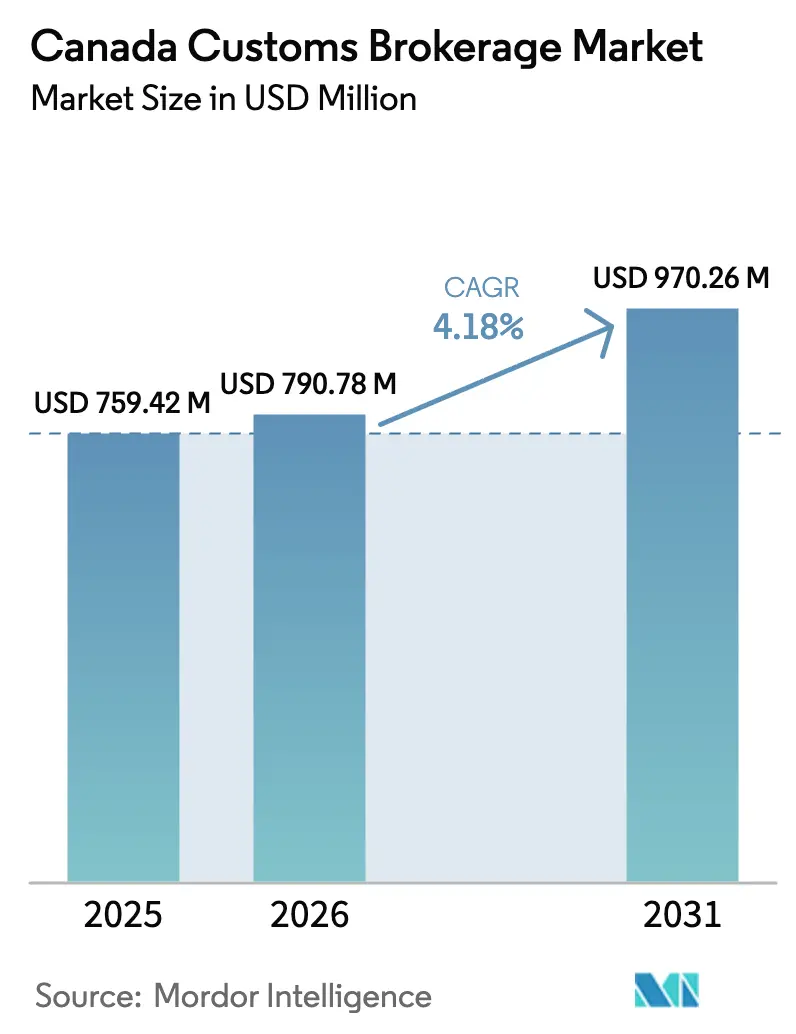
The Canada Customs Brokerage Market size is estimated at USD 790.78 million in 2026, and is expected to reach USD 970.26 million by 2031, at a CAGR of 4.18% during the forecast period (2026-2031).
Parcel-driven complexity sustained cross-border consumer demand, and CUSMA-linked rules-of-origin verification elevate the competitive stakes across this growing field. Provincial gateway investments, technology-enabled service differentiation, and the steady shift of North American supply chains toward near-shoring collectively expand addressable revenue pools for brokers that can master small-package clearance while still supporting bulk freight. Integrated logistics operators pull incremental volume through bundled offerings, yet specialty providers win premium fees where origin validation, sanctions screening, or sector-specific licensing raise compliance risks. As CARM finalization nears, automation, API connectivity, and cybersecurity readiness further distinguish winners inside the Canada customs brokerage market.
Key Report Takeaways
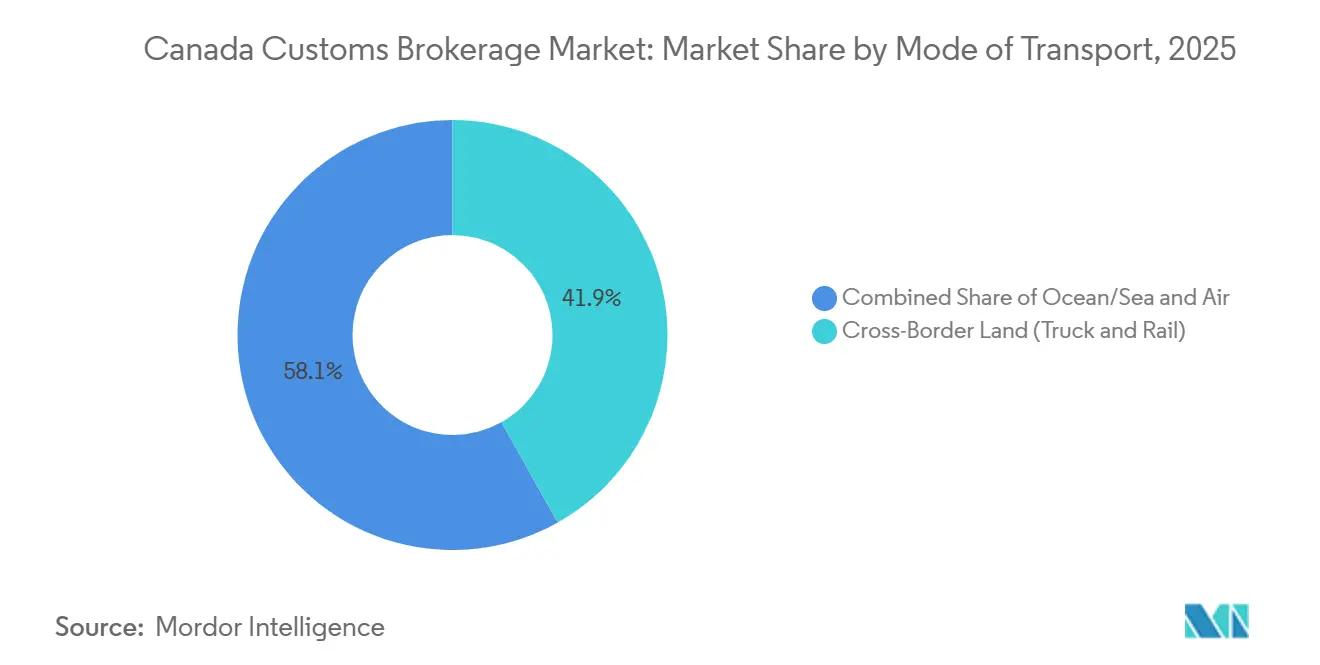
- By mode of transport, cross-border land transport (truck and rail) held 41.86% of the Canada customs brokerage market share in 2025, while air cargo is forecast to register the highest 4.39% CAGR through 2031.
- By broker type, freight-forwarder and 3PL-integrated operators controlled 51.24% of the Canada customs brokerage market size in 2025, whereas pure customs brokers will capture the fastest 4.57% CAGR to 2031.
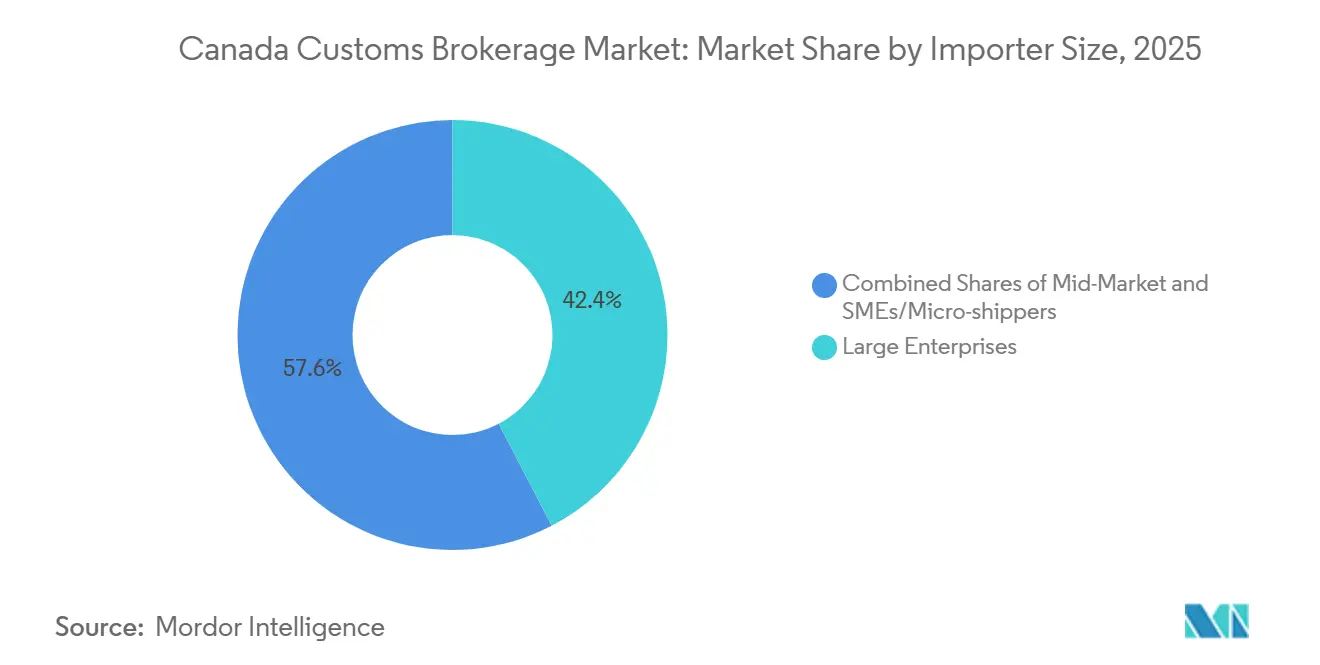
- By importer size, SMEs and micro-shippers advanced at a 4.88% CAGR between 2026-2031; large enterprises retained 42.36% market share in 2025.
- By digital adoption, traditional brokerages accounted for 57.83% of the Canada customs brokerage market size in 2025, yet digital-first providers are expanding at a 4.71% CAGR through 2031.
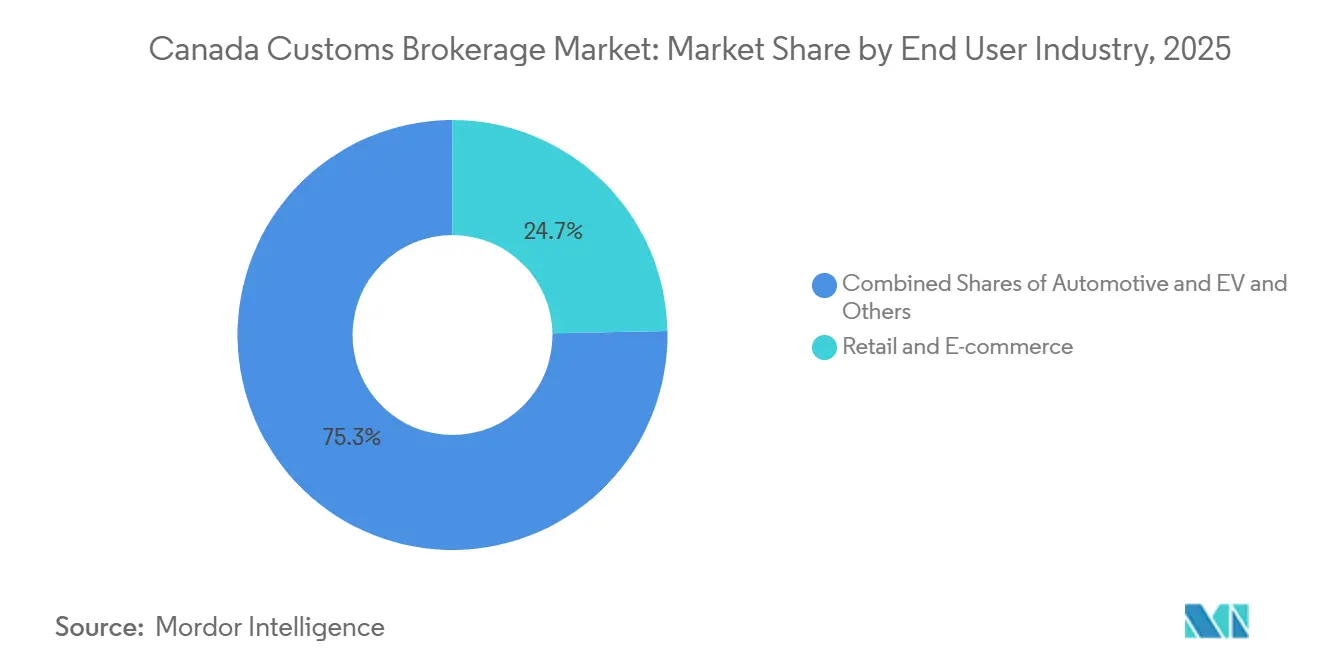
- By end-use industry, retail and e-commerce led with 24.71% share in 2025, while the automotive and EV sector is progressing at a 4.62% CAGR to 2031.
- By province, Ontario commanded 31.24% revenue share in 2025, whereas British Columbia is poised to post a 4.94% CAGR through 2031, the fastest among all provinces.
Note: Market size and forecast figures in this report are generated using Mordor Intelligence’s proprietary estimation framework, updated with the latest available data and insights as of January 2026.
Canada Customs Brokerage Market Trends and Insights
Drivers Impact Analysis*
| Driver | (~) % Impact on CAGR Forecast | Geographic Relevance | Impact Timeline |
|---|---|---|---|
| Surging cross-border e-commerce parcel volumes | +1.1% | National, most intense in urban fulfillment zones | Short term (≤ 2 years) |
| CUSMA-driven bilateral trade expansion | +0.9% | Ontario, Québec, border-adjacent manufacturing corridors | Medium term (2-4 years) |
| Near-shoring of North American supply chains | +0.7% | Ontario, Québec, core industrial gateways | Long term (≥ 4 years) |
| Proliferation of trade agreements and sanctions | +0.5% | National, high impact on Asia-Pacific corridors | Medium term (2-4 years) |
| AI-enabled HS-code prediction tools | +0.3% | National, technology-forward broker operations | Medium term (2-4 years) |
| Indigenous and Northern supply-chain support | +0.2% | Northern territories, remote Indigenous communities | Long term (≥ 4 years) |
| Source: Mordor Intelligence | |||


Surging Cross-Border E-commerce Parcel Volumes
Canada Post processed more than 1 billion parcels during 2025, a record that underscores how direct-to-consumer imports dominate incremental customs declarations[1]Canada Post, “Canada Post Delivers Record Volumes,” canadapost-postescanada.ca. Rapid-fire order cycles and low shipment values force brokers to automate entry generation, harmonized-code allocation, and duty calculation so that parcels clear without jeopardizing promised delivery times. Service portfolios increasingly feature de minimis optimization, allowing retailers to batch shipments below CAD 40 (USD 29) duty thresholds while still meeting regulatory requirements. Distributed gateway routing also gains importance because small packages now arrive simultaneously at Vancouver, Toronto, and Montréal facilities instead of funneling through a single port. Scalability, therefore, turns on cloud-based clearance engines, API connectivity with shopping-cart platforms, and 24/7 remote workforce coverage, all of which become must-have capabilities for contenders inside the Canada customs brokerage market.
CUSMA-Driven Bilateral Trade Growth
Merchandise trade between Canada and the United States totaled USD 745.4 billion in 2025, equal to 75.9% of Canadian exports. CUSMA’s tiered regional-value and labor-value thresholds obligate importers to prove qualifying content across multilayered supplier networks, especially in vehicles, textiles, and agri-foods. Brokers, therefore, pivot from transactional entry filing toward advisory mandates such as supplier document retrieval, costed bill-of-materials tracking, and audit defense preparation. Automotive producers also lean on brokers to certify that 40-45% of vehicle value originates from high-wage facilities, a stipulation that amplifies wage-rate verification complexity. This compliance burden guarantees durable demand, solidifying the Canada customs brokerage market as a strategic partner for manufacturers restructuring under regional sourcing rules.
Boom in Near-Shoring of North American Supply Chains
Manufacturers rebalance production footprints to shorten lead times and hedge geopolitical risk, redirecting component flows from Asia toward Canada and Mexico. Temporary-import permit advice, bonded-warehouse program design, and drawback claim management become lucrative fee generators because near-shored inventories circulate repeatedly across borders. Ontario and Quebec plants now schedule just-in-time deliveries that rely on paper-thin dwell times at ports of entry, necessitating robust broker backstops against classification missteps or system downtime. Brokers that can bundle landed-cost modeling with customs compliance increasingly influence footprint selection decisions, reinforcing their consultancy role within the Canada customs brokerage industry.
Proliferation of Trade Agreements & Sanctions
Canada currently participates in 15 free-trade agreements covering 51 countries, while also enforcing Russia-related sanctions regimes that continue to expand listing scopes[2]Office of the Chief Economist, “Canada’s State of Trade 2024,” international.gc.ca Importers struggle to reconcile divergent origin rules, duty drawback entitlements, and prohibited-party screenings without specialist guidance. Forward-leaning brokers, therefore, license multimarket tariff engines and integrate real-time restricted-party databases to deliver rapid duty-savings insights alongside sanctions compliance assurance. Those dual capabilities differentiate providers and sustain pricing power, particularly for Asia-bound consumer brands and extractive-sector suppliers navigating embargo-sensitive materials.
Restraints Impact Analysis*
| Restraint | (~) % Impact on CAGR Forecast | Geographic Relevance | Impact Timeline |
|---|---|---|---|
| Freight-forwarder vertical integration | -0.7% | National, mid-market client segment | Medium term (2-4 years) |
| CBSA self-assessment bypassing brokers | -0.5% | National, concentrated among large importers | Short term (≤ 2 years) |
| Licensed-broker talent shortage | -0.4% | National, acute in Montréal, Toronto, Vancouver | Long term (≥ 4 years) |
| Cybersecurity and data-privacy compliance cost | -0.3% | National, all brokers | Medium term (2-4 years) |
| Source: Mordor Intelligence | |||
Freight-Forwarder Vertical Integration
Purolator’s CAD 1.2 billion (USD 869 million) purchase of Livingston in 2024 gave the courier giant instant access to Canada’s largest broker workforce, creating an end-to-end platform that smaller specialists cannot match[3]Statistics Canada, “The Daily — Canadian International Merchandise Trade, December 2024,” statcan.gc.ca. Similar acquisitions by Kuehne + Nagel and Atlas Canada intensify scale-driven pricing pressure because bundled logistics contracts often embed customs clearance at marginal cost. Mid-tier brokers counter by highlighting independence from carrier-related service disruptions and by deepening sector-specific regulatory mastery. Nevertheless, integrated competitors siphon routine parcel entries from the Canada customs brokerage market, shrinking the addressable base for pure brokers.
CBSA Self-Assessment Bypassing Brokers
Programs such as Partners in Protection allow low-risk importers to file entries directly, curtailing broker fee opportunities on predictable SKUs. Multinationals with trade-compliance departments embrace self-assessment to trim transaction costs, yet most small and mid-sized importers still outsource liability to brokers rather than maintain in-house classification expertise. The net impact, therefore, lowers growth velocity in the short term but does not erase the need for professional intermediaries across the Canada customs brokerage market.
*Our forecasts treat driver/restraint impacts as directional, not additive. The impact forecasts reflect baseline growth, mix effects, and variable interactions.
Segment Analysis
By Mode of Transport: E-Commerce Elevates Air Cargo Yet Trucking Still Dominates
The air-cargo slice of the Canada customs brokerage market size is slated to post a 4.39% CAGR to 2031, buoyed by pharmaceutical cold-chain consignments and cross-border parcels that prize speed over freight cost. Brokers clearing airfreight deploy 24-hour desks at Toronto Pearson and Vancouver International to prevent storage penalties and service-level failures. Cross-border land transport (truck and rail) continues to account for 41.86% of 2025 revenue, anchored by automotive and industrial supply chains that rely on same-day border crossings to sustain just-in-time production
Ocean gateways, notably Vancouver and Montréal, cultivate containerized consumer-goods flows where customs specialists mitigate demurrage risk by pre-lodging entries before vessel arrival. Rail-intermodal movements tie West Coast arrivals to Prairie and Central Canadian distribution centers, necessitating close broker-carrier collaboration to match customs release windows with train schedules. Each leg demands differentiated clearance competencies, ensuring that modal diversity remains a defining feature of the Canada customs brokerage market.


By Broker Type: Specialist Expertise Reverses Consolidation Patterns
Freight-forwarder and 3PL-integrated players captured 51.24% market share in 2025, leveraging network density and bundled contracts to secure high-volume parcels and palletized freight. Yet pure players are on track for a 4.57% CAGR, proving that granular HS-code mastery, audit defense, and sector-specific advisory commands premium pricing.
Clients handling batteries, biologics, or aerospace components increasingly separate brokerage from transport to safeguard regulatory oversight, choosing boutique firms that embed compliance officers in client ERP workflows. Meanwhile, integrated giants funnel resources into AI tools and customer portals to narrow the expertise gap, sustaining a two-track competitive landscape inside the Canada customs brokerage market.
By Importer Size: Digital Platforms Democratize Clearance for SMEs
SMEs and micro-shippers will outpace other importer tiers at a 4.88% CAGR through 2031 as self-service booking engines simplify access to cross-border trade. Transparent fee tables, instant landed-cost quotes, and chatbot support allow micro-brands to test foreign sourcing with minimal working capital.
Large enterprises still represent 42.36% of 2025 revenue because their high transaction counts and audit exposure require bespoke compliance dashboards, drawback optimization, and dedicated account teams. Mid-market firms gravitate toward hybrid models, routing low-risk SKUs through online portals while engaging full-service brokers whenever regulatory ambiguity emerges, sustaining diversified demand across the Canada customs brokerage market.
By Digital Adoption: Technology Enhances but Does Not Replace Human Judgment
Traditional firms retained 57.83% of 2025 revenue, underscoring the enduring importance of relationship-based service for classification disputes and valuation negotiations. Nevertheless, API-centric brokerages are advancing at a 4.71% CAGR because instant status updates, rules-based entry generation, and integrated payments resonate with e-commerce-weighted clients.
Incumbents respond by layering robotic process automation onto legacy systems, freeing licensed staff to tackle complex rulings while lowering per-entry costs. The convergence points to a future where human expertise and machine efficiency cohabit rather than compete inside the Canada customs brokerage market.
By End-Use Industry: Automotive Electrification Multiplies Compliance Touchpoints
Retail and e-commerce claimed 24.71% of 2025 revenue thanks to diversified SKU catalogs that drive continuous parcel inflows. In contrast, the automotive and EV value chain is primed for a 4.62% CAGR because battery-content origin tracing and critical-mineral sourcing audits require specialized documentation roadmaps.
Pharmaceutical importers lean on brokers licensed for Health Canada drug establishment activities, while aerospace clients demand controlled-goods program knowledge and ITAR vetting. Electronics traders battle anti-dumping exposure on certain semiconductor categories, turning to brokers for early warning and duty mitigation. This breadth of sector needs to cement multidomain expertise as an engine of differentiation across the Canada customs brokerage market.
By Province: British Columbia Accelerates on Trans-Pacific Momentum
Ontario preserved 31.24% of 2025 turnover on the back of manufacturing density and three high-throughput border bridges. Nonetheless, British Columbia is forecast to register a 4.94% CAGR through 2031, propelled by Vancouver’s 4.1 million-TEU container throughput and expanding Asia-Pacific consumer-goods pipelines.
Quebec combines aerospace exports and EU-linked consumer-goods imports to keep Montréal brokers busy, while Alberta leverages energy-equipment demand around Calgary’s freight village. Collectively, these regional dynamics reinforce the geographic breadth that characterizes the Canada customs brokerage market.
Geography Analysis
Ontario’s leadership rests on dense auto, consumer-goods, and industrial corridors that generate around-the-clock clearance volumes, forcing brokers to synchronize shift schedules with Detroit-Windsor and Buffalo-Fort Erie crossing windows. Toronto Pearson’s belly-freight influx adds further workload, especially for pharmaceutical and electronics SKUs requiring temperature-controlled or high-value custodial protocols. Ontario brokers also pilot early CARM integrations because pilot importers cluster inside the province’s corporate headquarters belt.
British Columbia’s growth trajectory hinges on continuous berth expansions and inland-rail capacity upgrades that ferry Asia-sourced merchandise to Prairie provinces. Brokers in Vancouver fine-tune processes for high-volume containers, leveraging pre-arrival entry filing to minimize dwell fees and integrating AES data exchanges for U.S. in-transit shipments. Provincial e-commerce hubs near Richmond and Surrey magnify small-package traffic, making parcel automation investments imperative.
Quebec occupies a strategic midpoint between Europe and North America, with Montréal focusing on aerospace-component imports and aluminum-sector raw materials. Bilingual document services bolster competitiveness, while tightened EU carbon-border-adjustment mechanisms drive new advisory revenue. Alberta, Saskatchewan, and Atlantic provinces jointly represent emerging arenas for project cargo and energy-equipment clearance, encouraging brokers to widen office footprints beyond the core Golden Horseshoe and Pacific Rim gateway cities[4]Source: Vancouver Fraser Port Authority, “Port of Vancouver Statistics,” portvancouver.com.
Regulatory Landscape
The Canada customs brokerage market operates under Canada Border Services Agency (CBSA) oversight, with licensing and operational requirements framed by the Customs Act and the Customs Brokers Licensing Regulations. A customs broker must be incorporated in Canada, maintain a qualified officer, and meet governance requirements, including Canadian citizen or permanent resident majority directors, which set the credentialing and accountability standards that shape entry capacity across the industry.
The CBSA Assessment and Revenue Management (CARM) program has reset the operating baseline for declarations, accounting, and revenue management, with CARM becoming the CBSA system of record for commercial duties and taxes on October 21, 2024. From January 1, 2026, Customs Act amendments defining the importer of record and establishing joint liability for duties and taxes increased the compliance and financial risk-management emphasis for importers and intermediaries. CBSA also updated brokerage licensing administration by removing the pre-licence physical site inspection requirement in favor of an attestation via the CARM portal, while retaining CBSA enforcement and inspection powers, further pushing the sector toward digital-first governance.
Value Chain Analysis
Demand comes from importers, ranging from large enterprises to SMEs and micro-shippers, that need classification, valuation, origin management, and electronic declarations to move goods into Canada by truck or rail, air, and ocean. Licensed customs brokers sit at the center of execution, interfacing with CBSA systems, including the CARM Client Portal, and coordinating with carriers and freight forwarders, surety-supported workflows, and port and airport facilities to align release timing with transport schedules. Surety and financial-security providers also influence the workflow through bonds or other security mechanisms that support Release Prior to Payment (RPP) and related accounting requirements.
The operational flow typically begins with pre-arrival data capture (commercial documents, HS classification, and PGA requirements where applicable), moves to electronic transmission, release and border examination management, and then continues through post-release accounting, adjustments, and audit defense. With CARM consolidating accounting and revenue-management touchpoints into a centralized digital interface for trade chain partners, API connectivity, data quality controls, and exception handling have gained weight for both high-volume parcel processing and truck traffic. Bottlenecks often show up at the system and node level, where border IT disruptions, gateway capacity constraints, and labor availability can drive contingency processes and increase dwell costs, making resiliency planning and multi-gateway operating models a differentiator for brokers and integrated logistics providers.
Competitive Landscape
The Canada customs brokerage market balances concentration at the top with vibrant long-tail specialization. Purolator-Livingston now blends the nation’s biggest courier network with the largest brokerage payroll, granting a uniquely integrated value proposition that scales from parcel to project cargo. C.H. Robinson, Kuehne + Nagel, and DSV follow similar playbooks, expanding Canadian footprints via acquisitions or facility builds to surround clients with multimodal options.
Specialist independents such as Cole International, Argo Customs, and Jori Logistics protect niches via AI-driven classification dashboards, controlled-goods accreditations, and Northern-logistics credentials. API-native entrants like BorderBuddy lure start-ups by advertising all-in USD rates and five-minute account sign-ups, although complex entries frequently revert to human review. Cybersecurity has become a front-line differentiator, with ISO 27001 certification featuring prominently in RFP responses after multiple ransomware events hit mid-sized brokers in 2025.
Technology investment races escalate: Livingston’s predictive HS-code engine, C.H. Robinson’s consolidation algorithm, and FedEx Trade Networks’ penalty-avoidance analytics all illustrate how software budgets now rival brick-and-mortar expansions. Yet relationship equity still matters; seasoned account managers guide clients through CBSA audit remedies, CARM cutovers, and tariff-reclassification appeals, cementing loyalty even as platforms proliferate. This twin focus on high-touch counsel and digitized execution keeps competitive intensity elevated across the Canada customs brokerage market.
Canada Customs Brokerage Industry Leaders
Livingston International
Kuehne + Nagel
UPS Supply Chain Solutions
FedEx Trade Networks
DHL
- *Disclaimer: Major Players sorted in no particular order

Market Opportunities and Future Outlook
CARM-led digitization has created services whitespace around importer onboarding, portal enablement, data governance, and ongoing accounting support, shifting broker differentiation toward technology-assisted compliance and advisory. With CARM processing over 41 million Commercial Accounting Declarations and collecting CAD 47.5 billion in duties and taxes in 2025, brokers that productize CARM-related capabilities, including client portal administration, automated reconciliation, and exception management, have a scale-driven opportunity tied to how commercial imports are accounted for in Canada.
The 2026 enforcement environment also increases demand for risk-based programs and sector specialization rather than transactional entry filing alone. Customs Act changes effective January 1, 2026 that define importer of record and establish joint liability sharpen the need for importer-facing advisory on how liability is assumed and how financial security and post-entry corrections are handled across supply chains. At the same time, trade remedies and compliance complexity create room for higher-value services such as origin validation and documentation readiness in sensitive categories. Trade diversification also keeps demand for sanctions screening and multi-agreement rules navigation steady for brokers serving national routes and Asia-Pacific oriented corridors.
Recent Industry Developments
- March 2026: Canada and the European Union advanced updates to CETA discussions that included digital trade elements and steps aimed at reducing duplicative pharmaceutical inspections. For brokers supporting EU-linked shipments, these changes reinforce the need for robust documentation controls and digital-ready workflows that integrate trade data handling with sector compliance, especially in life sciences supply chains.
- November 2025: UPS completed its acquisition of Andlauer Healthcare Group (AHG) for USD 1.6 billion, expanding its healthcare logistics footprint in Canada. This acquisition strengthens integrated provider offerings that combine specialized cold-chain handling with cross-border logistics and brokerage-adjacent compliance support for higher-margin healthcare flows.
- May 2024: Kuehne+Nagel took over an existing 250,000 sq. ft. fulfillment facility near Toronto, Ontario, to serve a medical device customer. The additional fulfillment capacity near a key air and ground gateway supports more tightly coupled warehousing and customs processes for regulated products, raising competitive pressure on standalone brokers in healthcare-related import programs.


Research Methodology Framework and Report Scope
Market Definition and Coverage
For this report, the Canada customs brokerage market covers fee-based services used to clear commercial import shipments into Canada, where licensed intermediaries prepare declarations, classify goods, and support duty and tax processing with border authorities.
Scope exclusions: This sizing excludes low-value courier shipments cleared directly by express carriers under special simplified programs.
Segmentation Overview
- By Mode of Transport
- Ocean / Sea
- Air (Express and General Cargo)
- Cross-Border Land (Truck and Rail)
- By Broker Type
- Pure Customs Broker
- Freight Forwarder / 3PL-Integrated Brokers
- By Importer Size
- Large Enterprises
- Mid-Market
- SMEs / Micro-shippers
- By Digital Adoption
- Traditional Brokerages
- Digital-first / API-based Brokerages
- By End-User Industry
- Retail and E-commerce
- Automotive and EV
- Electronics and Semiconductors
- Pharmaceuticals and Life Sciences
- Aerospace and Defense
- Chemicals and Industrial Goods
- Others
- By Province
- Ontario
- Quebec
- British Columbia
- Alberta
- Others
Data Sources, Market Sizing, and Validation
Desk Research
Desk research built the base view of how much cross-border trade enters Canada and what the customs clearance workload looks like across modes. We relied on public sources such as Canada Border Services Agency (CBSA) guidance and reporting, Statistics Canada trade indicators, Government of Canada tariff and duty references, and U.S. Census Bureau trade releases for bilateral context.
To convert those signals into a service market view, we also reviewed broker licensing and compliance materials, public transport agencies that comment on port and corridor throughput, and standard disclosures like company filings and investor presentations where service mix is described. A paid subscription for company financials and news helped confirm revenue ranges and major event timing, and an import and export shipment-level database was used selectively to sanity-check lane mix and seasonality. These desk sources are illustrative only, and many other public documents and datasets were also used for data collection, validation, and clarification.
Primary Interviews and Surveys
Primary work was used to fill in the practical details that public data does not show clearly, like typical brokerage fee structures, the share of entries handled under different service models, and the effect of regulatory or technology changes on processing time. We spoke with a mix of brokerage leadership, operations managers, and functional specialists across Canada so the assumptions could be checked across high-volume entry points and smaller border locations.
Distribution of primary research fieldwork respondents
| Company type | Respondent position |
|---|---|
| Top tier: 35% | CXOs: 13% |
| Mid tier: 45% | Functional/Unit leaders: 33% |
| Smaller Players: 20% | Managers: 54% |
Market-Sizing & Forecasting
Sizing was built using top-down and bottom-up checks so the total stays tied to trade reality and also matches what service providers can plausibly earn. From a top-down angle, import activity and customs processing requirements were translated into a demand pool by aligning Canada import values and shipment flows with the portion that typically requires formal broker-assisted entries, and then applying modeled fee intensity by mode and entry type.
Those totals were then corroborated with selective bottom-up approximations, including sampled revenue benchmarks from broker disclosures, channel checks on average fees per entry, and sanity checks against staffing intensity where it was shared in interviews. Inputs that mattered most included Canada import volume and value trends, modal split across truck, ocean, air, and rail, the mix of commodity categories that drive classification effort, duty and tax complexity, and the share of recurring importer accounts versus one-off shipments. When gaps appeared, they were handled with conservative ranges that were re-tested with interview feedback before a single assumption was finalized.
For forecasting, scenario analysis was used because brokerage demand moves with trade cycles and policy shifts, not just a smooth trend line. Growth cases were anchored on expected changes in Canada import growth, border digitization and compliance requirements, and shipper behavior on documentation quality, and then adjusted after we've cross-checked direction and magnitude with practitioners.
Data Validation & Update Cycle
Validation was done in layers so outliers do not slip into the final totals. Model outputs were compared against independent signals such as Canada import indicators, mode-level freight trends, and visible step-changes tied to policy or enforcement updates, and then large variances were investigated before sign-off.
A second analyst review was completed to re-check formulas, unit consistency, and year alignment, followed by a final pass that re-tests key assumptions that can move the market size, such as fee intensity and the broker-assisted share of eligible shipments. Reports are refreshed annually, with interim updates when a material event changes trade flows or clearance rules, and right before delivery we run a last update sweep so clients get the most current view.
Mordor Intelligence's Canada Customs Brokerage Market Sizing Compared With Other Published Estimates
Published market sizes for Canada customs brokerage can look different across sources because the service scope is not always set the same way and the trade indicators used to construct demand can vary. Differences also show up when one publisher leans more on provider revenue roll-ups, while another leans mainly on trade volumes or a fixed fee-per-entry assumption.
The table shows a spread that is largely explained by what gets counted as brokerage revenue and how low-value and bundled services are handled. In Mordor Intelligence's model, only fee-based customs brokerage tied to commercial imports cleared through licensed intermediaries is included, while courier low-value clearance handled directly by express carriers is excluded.
Benchmark comparison
| Source | Market Size | Gaps in Research Methodology |
|---|---|---|
| Mordor Intelligence | USD 759.42 M (2025) | |
| Trade Journal A | USD 680.00 M (2025) | Uses a narrower revenue capture that leans on a limited set of broker financial disclosures and tends to undercount small and mid-sized firms plus ancillary entry handling fees. |
| Industry Association B | USD 850.00 M (2025) | Broadens the scope by combining customs brokerage with adjacent forwarding or compliance services, and applies blended fee assumptions that can overstate pure brokerage value in high-volume lanes. |
Overall, the gap across figures is consistent with how each source treats adjacent services, low-value clearance, and fee intensity by shipment type. By tying the total to observable trade activity and then re-checking it with provider-side economics, the resulting market size stays traceable to clear steps and can be repeated when new trade or policy data becomes available.


Key Questions Answered in the Report
What CAGR is forecast for the Canada customs brokerage market through 2031?
The field is projected to expand at a steady 4.18% CAGR, climbing from USD 790.78 million in 2026 to USD 970.26 million by 2031.
Which transport mode is growing fastest for cross-border customs entries?
Air cargo leads with a 4.39% CAGR because e-commerce parcels and cold-chain pharmaceuticals prioritize speed in clearance decisions.
Why are pure customs brokers regaining share despite freight-forwarder consolidation?
Importers facing complex origin verification and sanctions rules pay premium fees for deep compliance expertise that integrated logistics firms often lack.
How does CUSMA affect customs brokerage demand in Canada?
Rigorous regional-value content rules across automotive, textile, and agri-food sectors compel manufacturers to seek brokers for continuous documentation management and audit defense.
Which province shows the quickest brokerage-revenue growth?
British Columbia is forecast to advance at a 4.94% CAGR on the back of rising Asia-Pacific container volumes moving through the Port of Vancouver.
What technology investments matter most for brokers during the CARM transition?
API-driven duty-payment interfaces, AI-powered HS-code prediction, and ISO-aligned cybersecurity controls are becoming decisive selection criteria for importers.
Page last updated on:


 Your data is secure and never sold or shared.


