
Camping Equipment Market Size and Share
Market Overview
| Study Period | 2021 - 2031 |
|---|---|
| Market Size (2026) | USD 22.08 Billion |
| Market Size (2031) | USD 29.49 Billion |
| Growth Rate (2026 - 2031) | 5.92 % |
| Fastest Growing Market | Asia Pacific |
| Largest Market | North America |
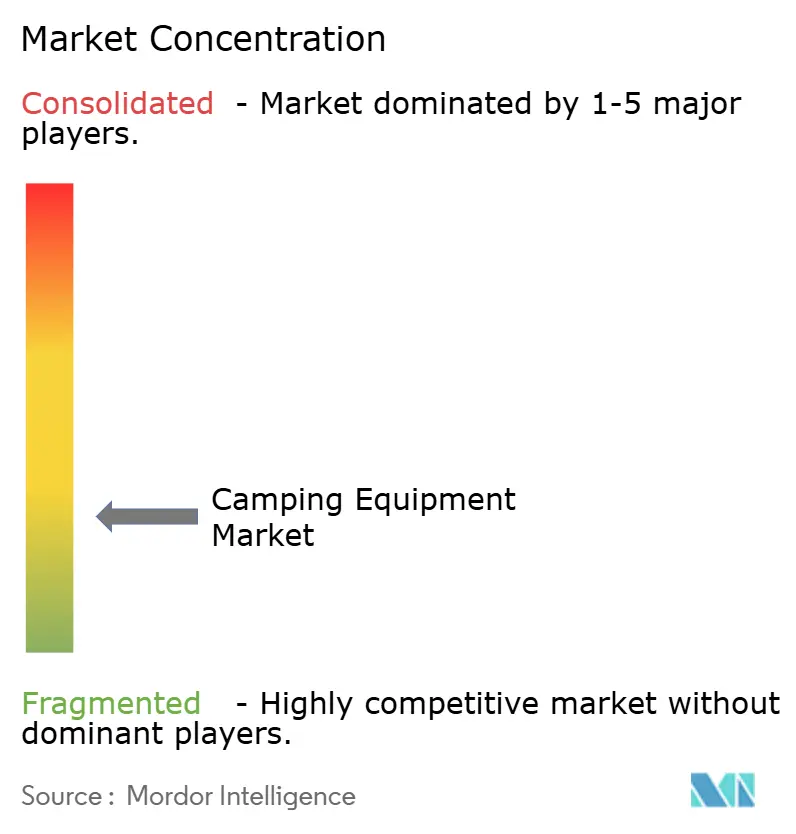
| Market Concentration | Low |
Major Players *Disclaimer: Major Players sorted in no particular order Image © Mordor Intelligence. Reuse requires attribution under CC BY 4.0. | |
Camping Equipment Market Analysis by Mordor Intelligence
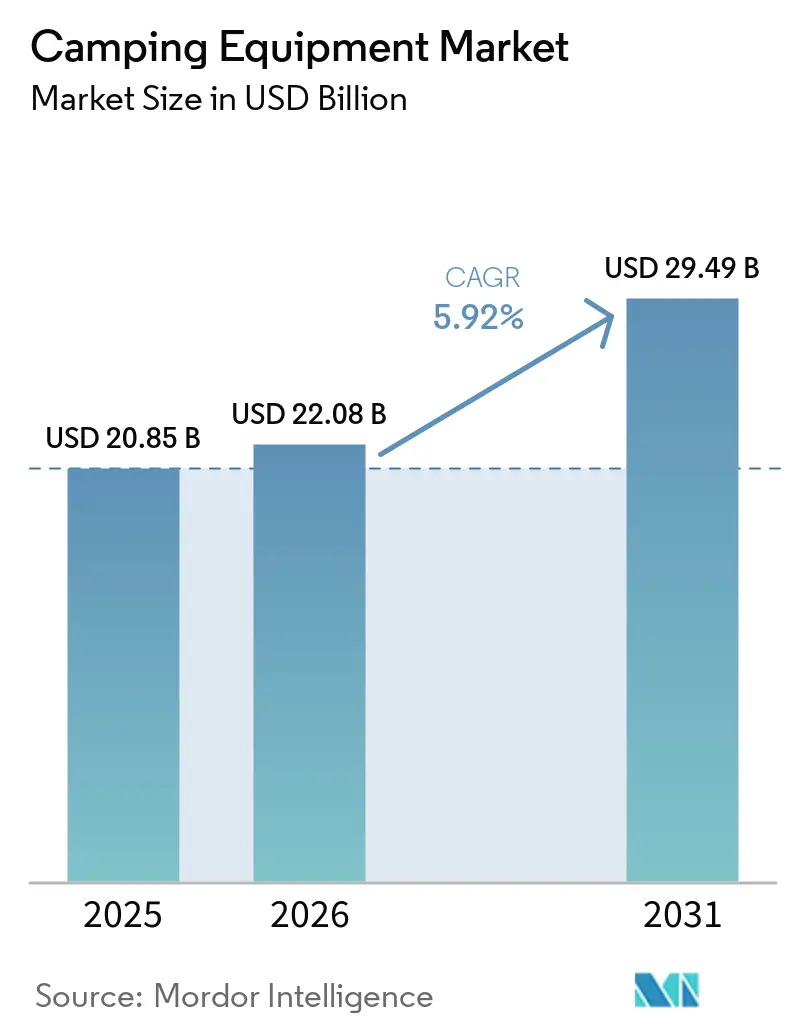
The camping equipment market size in 2026 is estimated at USD 22.08 billion, growing from 2025 value of USD 20.85 billion with 2031 projections showing USD 29.49 billion, growing at 5.92% CAGR over 2026-2031. Product innovation is accelerating, with lightweight materials, solar-enabled gear, and eco-certified fabrics driving premiumization, while digital channels steadily erode brick-and-mortar dominance. Demand is also broadening geographically as the Asia-Pacific region’s rising middle class reshapes a market that has historically been concentrated in North America and Europe. Growing patent activity signals both faster innovation cycles and higher barriers to entry.
Key Report Takeaways
- By product type, backpacks led with a 28.12% market share in the camping equipment segment in 2025, while camping furniture is projected to register a 7.76% CAGR through 2031.
- By application, personal use accounted for 76.05% of the camping equipment market size in 2025 and is projected to expand at an 7.74% CAGR through 2031.
- By distribution channel, offline retail held 67.45% share of the camping equipment market size in 2025, while online retail is set to grow at an 8.16% CAGR through 2031.
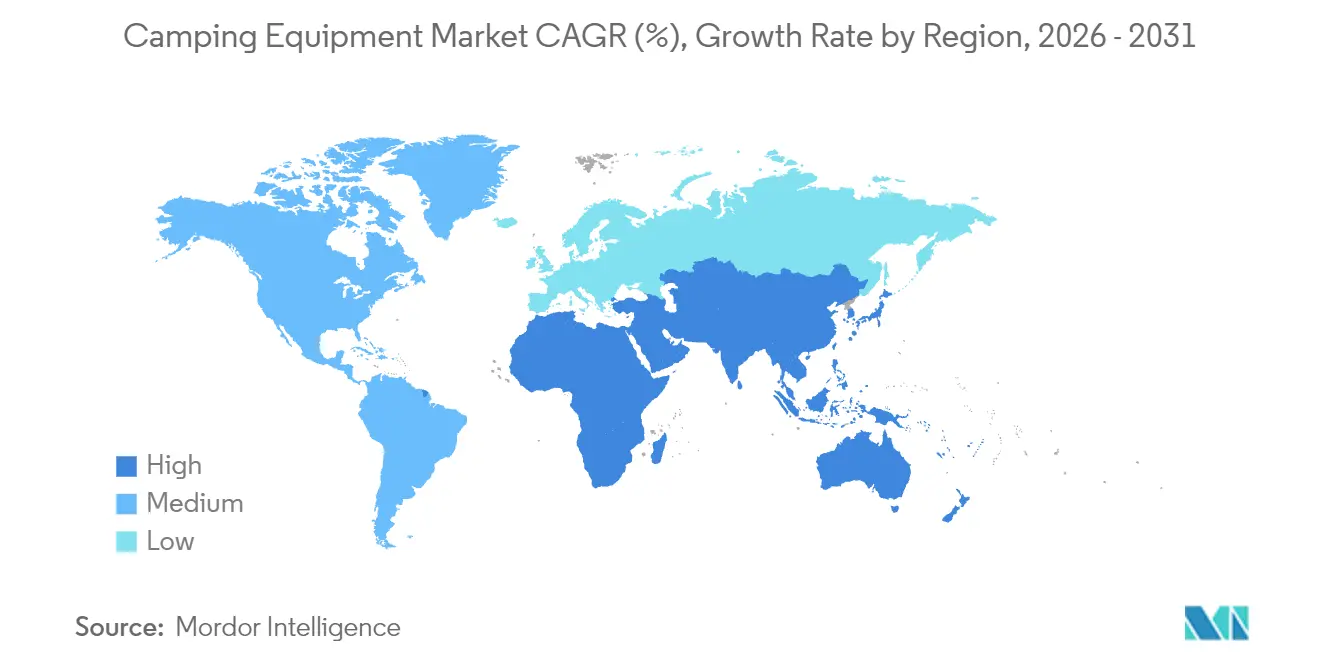
- By geography, North America accounted for 38.52% of the camping equipment market size in 2025, whereas the Asia-Pacific region is forecast to post a 7.34% CAGR by 2031.
Note: Market size and forecast figures in this report are generated using Mordor Intelligence’s proprietary estimation framework, updated with the latest available data and insights as of 2026.
Market Trends and Insights
Drivers Impact Analysis of Camping Equipment Market*
| Driver | (~) % Impact on CAGR Forecast | Geographic Relevance | Impact Timeline |
|---|---|---|---|
| Rising participation in outdoor recreation and wellness tourism | +1.2% | Global, strongest in North America and Asia-Pacific | Medium term (2-4 years) |
| Surge in domestic travel and “staycations” | +1.0% | North America and Europe, spillover to Asia-Pacific | Short term (≤ 2 years) |
| Innovation in lightweight and compact gear | +0.8% | Global, led by North America and Europe | Long term (≥ 4 years) |
| Government support for national parks and outdoor infrastructure | +0.9% | North America, Europe, emerging Asia-Pacific | Long term (≥ 4 years) |
| Expansion of e-commerce and direct-to-consumer brands | +1.3% | Global, highest in North America and Europe | Short term (≤ 2 years) |
| Expansion of eco-friendly and sustainable product lines | +0.7% | Europe and North America, growing in Asia-Pacific | Medium term (2-4 years) |
| Source: Mordor Intelligence | |||
Rising participation in outdoor recreation and wellness tourism
Outdoor recreation participation rose to 175.8 million Americans in 2024, 57.3% of the population, adding 7.7 million first-time campers, according to the Outdoor Industry Association[1]Source: Outdoor Industry Association, “2024 Outdoor Participation Trends Report,” OutdoorIndustry.org. Employers are increasingly subsidizing outdoor activities through wellness stipends, while flexible work schedules enable midweek trips that lengthen stay durations. Gen Z and Millennials are shaping demand with “micro-adventures” that blend fitness, digital detox, and social content creation, prompting brands to foreground sleep quality, recovery, and mindfulness in their messaging. Climbing, hiking, and camping tent generated USD 10.5 billion in U.S. value-added output in 2023 (U.S. BEA), highlighting the significant economic engine behind leisure-focused gear spending[2]Source: Bureau of Economic Analysis, “Outdoor Recreation Satellite Account, U.S. and States, 2023,” BEA.gov. As a result, companies that authentically integrate wellness narratives are gaining traction with urban professionals who frame gear purchases as investments in preventive health rather than discretionary spending.
Surge in domestic travel and "staycations"
Domestic tourism resilience has elevated camping from a budget-friendly alternative to a premium leisure category, as travelers reallocate international airfare budgets toward high-end gear and destination campgrounds. U.S. national park visitation rebounded to near-record levels in 2024, although it remained below 2019 peaks due to capacity limits and reservation systems that restrict peak-period access (National Park Service)[3]Source: National Park Service, “Great American Outdoors Act Report to Congress 2024,” NPS.gov. In Europe, “staycation” momentum, reinforced by Brexit-related travel friction and climate-driven flight avoidance, has fueled double-digit growth in caravan and motorhome sales, led by Germany and the UK. This shift is accelerating demand for premium camping equipment and furniture, modular cooking systems, and durable equipment that delivers multi-trip value rather than single-use utility. Asia-Pacific markets reflect these patterns: China’s domestic camping boom has expanded to more than 200 million participants, prompting investment in “glamping” sites that combine natural settings with hotel-grade amenities (China Tourism Academy). The resulting barbell-shaped market, budget campers trading up and luxury travelers trading down, continues to compress the mid-tier, pressuring brands to commit to either value engineering or premium differentiation to maintain relevance.
Innovation in lightweight and compact gear
Material science breakthroughs are resetting performance standards in camping gear, with ultra-high molecular weight polyethylene (Dyneema) enabling sub-1-kilogram tents that maintain structural integrity in harsh conditions. Jetboil’s MiniMo Cook System, launched in 2024, delivers 100-second boil times in a 400-gram unit, a 30% efficiency gain over prior generations, according to Johnson Outdoors. Graphene-enhanced insulation now offers warmth-to-weight ratios roughly 20% higher than traditional down, resolving a long-standing trade-off for ultralight backpackers who previously had to sacrifice comfort for portability. The push toward compactness is increasingly driven by urban millennials navigating limited storage and multi-modal transport, requiring gear that fits in overhead bins, bike panniers, and lockers. Modular systems that reconfigure for both car-camping weekends and extended backcountry trips are winning share from single-purpose specialists. Innovation velocity is rising accordingly: the USPTO recorded 340 camping-equipment patents in 2024, up 15% from 2023, with roughly half targeting weight reduction and packability.
Government support for national parks and outdoor infrastructure
Public investment is expanding camping demand, as the Great American Outdoors Act’s Legacy Restoration Fund channels up to USD 1.3 billion annually through 2025 to reduce a USD 12 billion backlog in national park maintenance. This funding is financing campground electrification and trailhead upgrades, which are expected to raise daily capacity by roughly 20%, according to the National Park Service. The Land and Water Conservation Fund allocates USD 900 million annually for land acquisition, with proposed FY2025 appropriations of USD 2.8 billion, a 30% increase that underscores bipartisan support for the economic multiplier of outdoor recreation. States are amplifying the trend: California’s Outdoors for All program deployed USD 255 million in 2024 to build 150 campgrounds in underserved regions, improving access and proximity to health-linked green spaces, according to California State Parks. Europe’s Green Deal is directing EUR 500 million toward sustainable tourism infrastructure, including solar-powered campgrounds and EV charging aligned with ISO 14001 standards, creating regulatory tailwinds for eco-certified equipment makers, according to the European Commission.
Restraints Impact Analysis of Camping Equipment Market*
| Restraint | (~) % Impact on CAGR Forecast | Geographic Relevance | Impact Timeline |
|---|---|---|---|
| Seasonality and weather dependency of demand | -0.6% | Global, most acute in temperate climates | Short term (≤ 2 years) |
| Counterfeit/low-quality imports eroding brand equity | -0.4% | Global, concentrated in e-commerce channels | Medium term (2-4 years) |
| Complex setup for technical tents and systems | -0.3% | North America and Europe | Short term (≤ 2 years) |
| Lack of standardization in quality | -0.4% | Global, particularly Asia-Pacific and South America | Long term (≥ 4 years) |
| Source: Mordor Intelligence | |||
Seasonality and weather dependency of demand
Camping equipment sales are highly seasonal, with Q2-Q3 generating over half of annual revenue as consumers prepare for summer trips, while Q4-Q1 demand collapses, forcing retailers into promotional cycles that can erode margins by 15-20%. This seasonality strains working capital, as manufacturers finance inventory buildup in Q1 for Q2 delivery and absorb the risk of obsolescence when weather disruptions suppress demand. Climate volatility is intensifying these effects: 2024 saw wildfire closures in the western U.S. and extreme heat exceeding 110°F, which shortened the season by 3-4 weeks and delayed replacement purchases, according to the National Interagency Fire Center[4]Source: National Interagency Fire Center, “Fire Information Statistics 2024,” NIFC.gov. Brands are attempting to extend the season through winter camping and “cold-weather glamping” campaigns, yet structural challenges remain, including declining participation among aging Baby Boomers and the scarcity of all-weather infrastructure, such as heated shelters or climate-controlled facilities, that would support year-round operations.
Counterfeit/low-quality imports eroding brand equity
Counterfeit camping equipment, particularly tents and sleeping bags from unregulated manufacturers, is proliferating on e-commerce platforms, with listings that mimic premium brands while failing to meet basic safety standards. These products undercut authentic gear by 40-60%, attracting price-sensitive consumers who often discover quality deficiencies, collapsed poles, failed waterproofing, or inadequate insulation, only after critical failures. The problem is especially pronounced in markets with weak enforcement. For instance, U.S. Customs and Border Protection seized USD 30 million in counterfeit outdoor gear in 2024, although industry estimates suggest this represents under 10% of total flows[5]Source: U.S. Customs and Border Protection, “Trade Statistics 2024,” CBP.gov. Beyond lost sales, counterfeit failures damage a brand's reputation and increase customer acquisition costs. While ISO 10966 (tents) and ISO 23537 (sleeping bags) provide safety and performance benchmarks, verification is largely voluntary, allowing low-quality imports to proliferate. Brands are responding with blockchain-based authentication and QR-coded traceability, though these measures add USD 2-5 per unit, compressing margins in price-sensitive segments.
*Our forecasts treat driver/restraint impacts as directional, not additive. The impact forecasts reflect baseline growth, mix effects, and variable interactions.
Camping Equipment Market Segment Analysis
By Product Type:
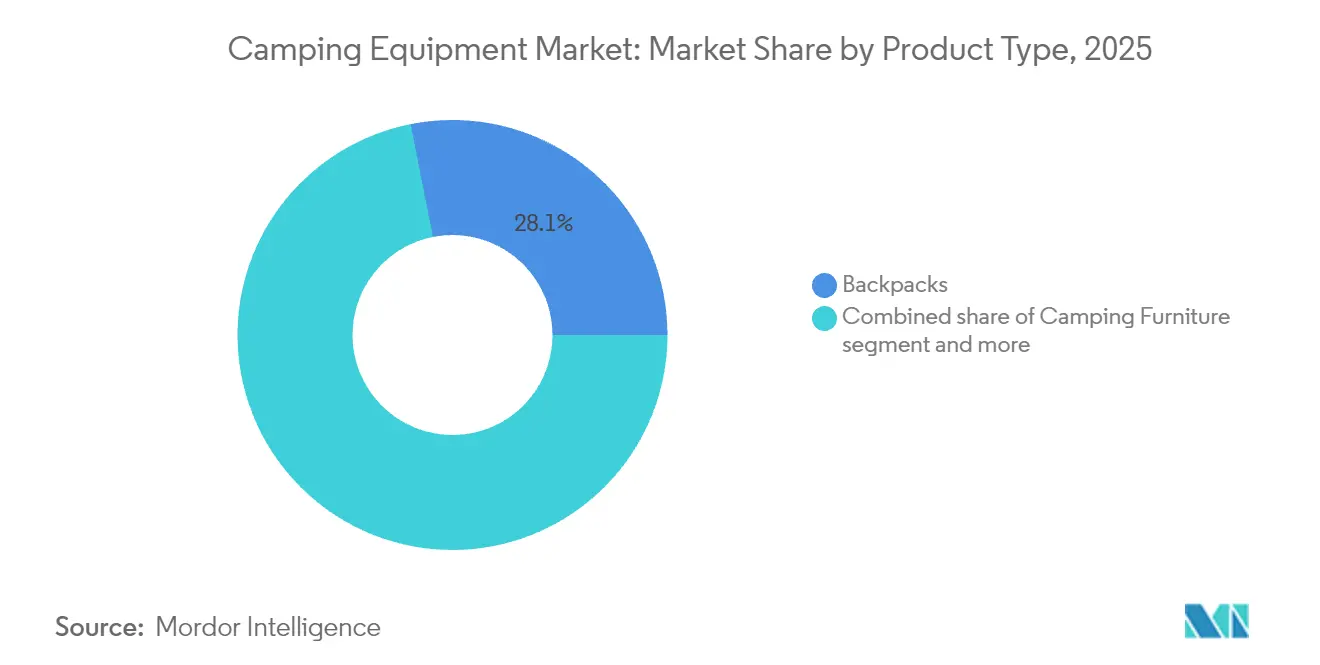
Backpacks Lead, Furniture SurgesBackpacks accounted for 28.12% of the camping equipment market in 2025, reflecting their role as foundational purchases for day hikers and multi-day backpackers, while camping furniture is projected to grow at a 7.76% CAGR through 2031, the fastest among categories, highlighting a bifurcation in camping styles: ultralight enthusiasts prioritize weight reduction and invest in premium backpacks with advanced suspension systems, whereas “glamping” consumers allocate budgets toward collapsible chairs, cots, and tables that transform campsites into outdoor living spaces. Tents, the second-largest segment, are advancing through innovations in Dyneema fabrics, enabling sub-1-kilogram shelters from brands like Big Agnes and NEMO Equipment (2024) without compromising structural integrity. Sleeping bags and pads are differentiated via integrated systems that improve thermal efficiency by 15%, eliminating gaps that previously required ad hoc solutions.
Cooking systems benefit from dual trends: solo campers adopt compact, fuel-efficient stoves such as Jetboil’s 100-second boil system, while group campers prefer modular cookware sets that nest for transport but expand to serve 6-8 people. Lighting and power solutions are increasingly solar-enabled, with portable power stations from Goal Zero and Jackery supporting multi-day trips for environmental purists and digital nomads. Coolers and hydration products face commoditization, though premium brands like YETI sustain pricing power through brand loyalty and lifetime warranties. Accessories, including navigation devices, safety kits, and repair tools, represent the smallest segment but maintain stable demand due to European regulatory requirements for backcountry first-aid and emergency equipment.


By Application:
Personal Use Dominates, Commercial GainsPersonal use accounted for 76.05% of the camping equipment market in 2025 and is projected to grow at an 7.74% CAGR through 2031, driven by 175.8 million Americans participating in outdoor recreation, a 4.1% increase, which is expected to add 7.7 million first-time campers, according to the Outdoor Industry Association. Growth reflects structural shifts in leisure behavior, as remote work enables extended trips and wellness trends position camping as a preventive healthcare measure rather than a discretionary recreation. The commercial segment, including rental operators, tour companies, and campground concessions, is expanding by addressing barriers to ownership such as urban storage constraints, maintenance requirements, and capital outlays that can exceed USD 2,000 for a family of four. Digital platforms are enhancing rental economics through lower acquisition costs and dynamic pricing, although high damage rates (15%+ per rental) and logistics costs (≈approximately 25% of revenue) remain significant challenges.
Tour operators are adopting inclusive pricing models that bundle equipment with guide services, simplifying the experience for novices. Meanwhile, campground concessions are increasingly offering premium rentals and “glamping” packages with pre-pitched tents, cots, and cooking systems. Geographic adoption is uneven: North America and Europe feature mature rental markets, whereas Asia-Pacific remains nascent due to ownership preferences and limited infrastructure. Segment growth is sensitive to regulatory clarity on liability, with insurance costs reaching 8–10% of revenue in jurisdictions with ambiguous tort frameworks, constraining capital investment.
By Distribution Channel:
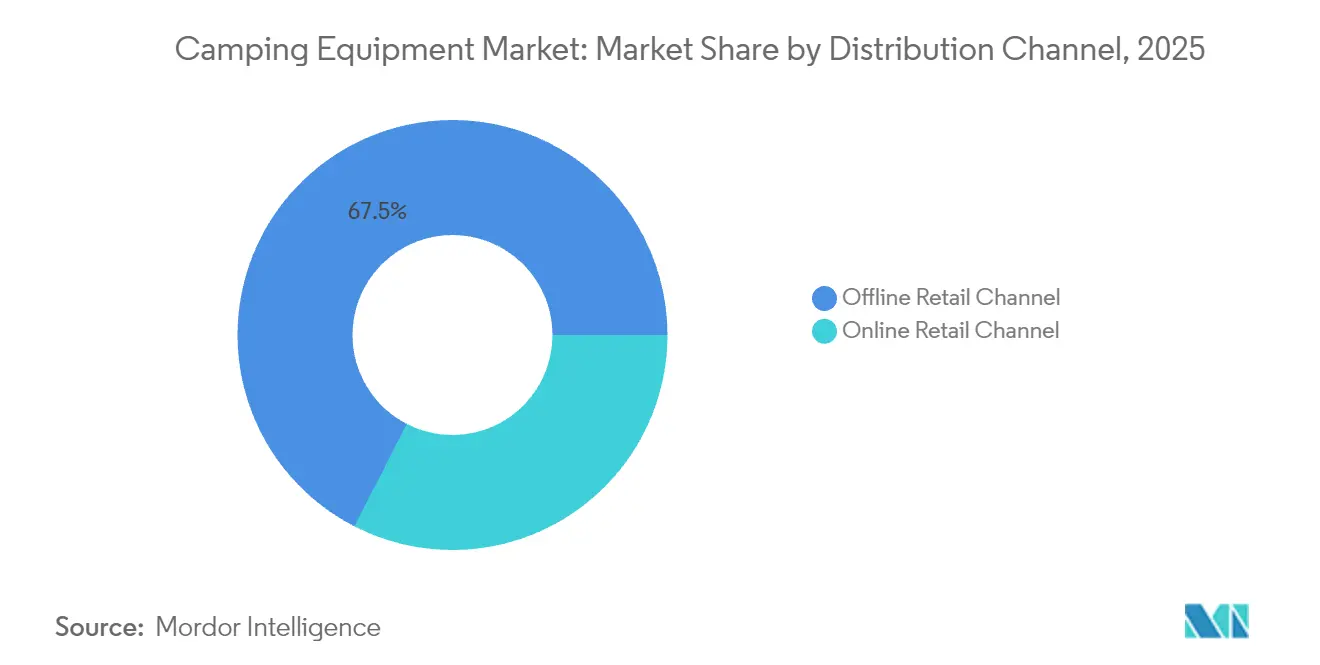
Online Accelerates, Offline AdaptsOffline retail channels accounted for 67.45% of the camping equipment market in 2025, while online retail is projected to grow at an 8.16% CAGR through 2031, outpacing overall market growth as direct-to-consumer brands bypass wholesale markups and leverage customer data for personalized marketing. Retail trade contributed USD 156.3 billion, or 24.4% of outdoor recreation’s total value-added output in 2023. However, e-commerce penetration remains below 35%, indicating a substantial runway for digital expansion (Bureau of Economic Analysis). The channel shift compresses margins for legacy retailers such as REI and Bass Pro Shops, which are countering with omnichannel strategies that integrate online inventory visibility, curbside pickup, and in-store “try before you buy” programs to reduce returns and convert digital browsers into in-store shoppers.
Amazon’s entry into premium outdoor gear, including private-label tents and sleeping bags, is driving incumbents to differentiate through service and expertise rather than product alone. Specialty retailers are responding with expert staff, gear rentals, and community events, such as group hikes, skills clinics, and film screenings, that build loyalty beyond transactions. E-commerce growth is geographically uneven: penetration exceeds 40% in North America and Europe but lags at 25% in Asia-Pacific, constrained by rural logistics and preference for tactile evaluation of technical gear. Payment flexibility, including buy-now-pay-later options, is increasingly a differentiator, boosting conversion rates by 15-20% among Millennials and Gen Z who prioritize cash flow over total cost of ownership.
Geography Analysis
North America Camping Equipment Market
North America accounted for 38.52% of camping equipment revenue in 2025, supported by a strong camping culture, extensive public lands, and robust park funding. The Great American Outdoors Act allocates up to USD 1.3 billion annually through 2025 to reduce deferred maintenance, including electrification of 500 campsites that increase capacity by 20% (National Park Service), while outdoor recreation contributed USD 639.5 billion to U.S. GDP in 2023, or 2.3% of economic output (Bureau of Economic Analysis). Canada sustains high per-capita demand, and Mexico is promoting regional eco-tourism in Baja California and Yucatán. Climate volatility, including wildfires and extreme heat, shortens Western seasons, reducing utilization and delaying replacement cycles.
APAC Camping Equipment Market
The Asia-Pacific region is projected to grow at a 7.34% CAGR through 2031, the fastest globally, driven by China’s 200 million-strong camping population and USD 5 billion in 2024 government investment for 1,000 new campgrounds (China Tourism Academy). India’s Himalayan states are developing adventure-tourism corridors, though infrastructure lags demand, while Japan’s “solo camping” trend favors ultralight kits, tempered by an aging population. Australia’s caravan market remains strong, yet bushfire risks increase capital outlays for fire-resistant designs.
Europe Camping Equipment Market
Europe is mature but innovation-driven, with Germany hosting 3,000+ campgrounds and 8% caravan ownership, while the European Green Deal directs EUR 500 million toward low-carbon tourism infrastructure, favoring ISO 14001-certified suppliers (European Commission). The UK’s post-Brexit “staycation” trend boosts discretionary spending on premium gear, whereas France’s large campground network sees growth mainly in luxury “glamping” upgrades.
South America and Middle East Camping Equipment Market
South America and the Middle East remain smaller markets, led by Brazil, Argentina, and Saudi Arabia, which has committed USD 800 million to desert-camp facilities under Vision 2030, though political and climatic uncertainties constrain forecasts.

Regulatory Landscape
Regulation for camping equipment is anchored in a mix of voluntary performance standards and mandatory consumer product safety rules that vary by region. For tents, ISO 5912:2020 is a widely referenced global benchmark for requirements and test methods, while the United States commonly uses ASTM F3431-20 for tent material flammability and related warning and labeling provisions. In Canada, the Tents Regulations (SOR/2024-217) require flammability and labeling compliance aligned to CAN/CGSB-182.1-2020, creating a formal compliance pathway for products sold nationally.
In the European Union, Regulation (EU) 2023/988 (General Product Safety Regulation, GPSR) strengthens general safety obligations for consumer products where no specific harmonized rules apply, which is particularly relevant for multi-category camping assortments sold through specialty retail and online marketplaces. Product safety oversight is also reinforced by hazard communications from agencies such as the U.S. Consumer Product Safety Commission (CPSC), including safety alerts on carbon monoxide poisoning risks associated with camping equipment and portable heaters. These notices affect design choices, labeling, and retailer listing requirements for higher-risk product types.
Competitive Landscape
The camping equipment market is fragmented, with the top five players, Johnson Outdoors, VF Corporation, Decathlon, Big Agnes, and Solo Brands, dominating technical segments, while basic products such as budget tents and sleeping bags face low barriers to entry. Specialist brands in ultralight backpacking and integrated cooking systems leverage material science expertise and patent portfolios, creating concentration in high-performance categories. Strategic approaches diverge between vertical integration, exemplified by Johnson Outdoors and VF Corporation, which involves owned manufacturing and supply-chain control, and asset-light or hybrid models, such as Decathlon, which combines in-house design with contract manufacturing to enable rapid iteration at lower capital intensity.
White-space opportunities exist in smart camping equipment, solar-integrated tents, IoT-enabled coolers, and app-connected stoves, although adoption remains under 5%, limited by 40–60% price premiums and consumer skepticism regarding the reliability of electronics in harsh environments. Emerging direct-to-consumer disruptors such as Cotopaxi and Hyperlite Mountain Gear have scaled to nine-figure revenues by bypassing wholesale channels, leveraging social media influencers, and building community-driven engagement.
Technology adoption is accelerating as brands deploy AI-driven recommendation engines to suggest gear configurations based on purchase history, location, and social activity, increasing average order values. Innovation intensity is reflected in USPTO data: 340 camping-equipment patents were filed in 2024, a 15% increase over 2023, with roughly half targeting weight reduction and packability. ISO 23537 (sleeping bags) and ISO 10966 (tents) establish quality benchmarks, yet voluntary compliance allows low-quality imports to compete on price while authentic brands incur certification costs of USD 10,000–50,000 per product line.
Camping Equipment Industry Leaders
Johnson Outdoor Inc.
Big Agnes, Inc.
Solo Brands Inc.
Decathlon S.A.
VF Corp. (The North Face)
- *Disclaimer: Major Players sorted in no particular order
Camping Equipment Market Companies Covered in this Report
- Johnson Outdoors Inc.
- Newell Brands
- VF Corporation
- Oase Outdoors ApS
- Big Agnes, Inc.
- Exxel Outdoors LLC
- NEMO Equipment, Inc.
- Dometic Group AB
- Snow Peak Inc.
- Hilleberg AB
- Nordisk Company AS
- Montbell Co., Ltd.
- Cascade Designs, Inc.
- Decathlon S.A.
- Sea to Summit Pty Ltd
- Black Diamond Equipment, Ltd.
- Marmot Mountain, LLC
- Eureka! Camping
- Vango
- Sierra Designs

Market Opportunities and Future Outlook
The most actionable opportunity is the overlap between sustainability-led material changes and performance-driven innovation in core shelter and sleep categories. Brands are commercializing PFAS-avoiding or PFAS-free design choices and recycled fabrics, including Big Agnes launching the VST tent series in March 2026 using recycled 20D HyperBead solution-dyed ripstop fabric designed without intentionally added PFAS. This tracks tightening scrutiny of chemical profiles and safety expectations across major markets, and it creates room for suppliers to scale compliant coatings, fabrics, and seam technologies while maintaining waterproof ratings and durability.
Differentiation is also moving into space-saving hard goods and more domesticated manufacturing that can reduce logistics friction and improve responsiveness. Coleman (Newell Brands) unveiled the Snap N Go collapsible hard cooler in March 2026, targeting consumers who want hard-cooler performance with improved storage convenience, a design brief that fits urban households and smaller vehicles. On the manufacturing side, NEMO disclosed in July 2026 that production of its Switchback closed-cell foam sleeping pad moved to the United States as part of its upcoming collection updates, pointing to resilience and lead-time control in high-volume sleep essentials. Participation depth also supports assortment expansion: the Outdoor Industry Association reported US outdoor participation reaching 183.2 million people in 2025 (59% of the population aged 6+), which supports entry kits for casual campers and later trade-up into higher-margin ultralight, comfort, and gear-maintenance segments.
Recent Industry Developments in Camping Equipment Market
- July 2026: NEMO unveiled its 2027 collection updates, including a shift of Switchback closed-cell foam sleeping pad production to the United States. The move highlights supply-chain localization as a lever for lead-time control and inventory availability in high-volume sleep essentials, supporting retailers and direct channels that depend on in-season fulfillment.
- May 2026: Solo Brands, Inc. communicated a transformation program alongside its fiscal 2026 first-quarter update, emphasizing leaner cost structures, cash discipline, and channel-level profitability. The shift signals tighter assortment and distribution decisions around key outdoor categories, influencing promotional intensity and partner mix for camping-focused brands and retailers.
- March 2026: Big Agnes introduced the VST tent series built with recycled 20D HyperBead solution-dyed ripstop fabric and designed without intentionally added PFAS. This launch strengthens competitive positioning in premium shelters where material credentials and chemical-profile scrutiny increasingly affect consumer choice and retail placement.


Camping Equipment Market Report Scope and Research Methodology
Market Definition and Coverage
For this study, the camping equipment market is defined as the value of products bought for overnight and extended outdoor stays, covering core gear that supports shelter, sleep, cooking, carrying, comfort, lighting, and hydration.
Scope exclusions: We exclude camping travel services, RV and vehicle purchases, and non-camping apparel and footwear, even when they are used outdoors.
Segments Covered in This Report
- By Product Type
- Tents
- Sleeping Bags and Pads
- Cooking Systems and Cookware
- Backpacks
- Furniture
- Lighting and Power
- Coolers and Hydration
- Accessories (Navigation, Safety, and Repair kits)
- By Application
- Personal Use
- Commercial (Rental,Tour Operators, and Campgrounds)
- By Distribution Channel
- Online Retail Channel
- Offline Retail Channel
- By Geography
- North America
- United States
- Canada
- Mexico
- Rest of North America
- Europe
- Germany
- United Kingdom
- Italy
- France
- Spain
- Netherlands
- Poland
- Belgium
- Sweden
- Rest of Europe
- Asia-Pacific
- China
- India
- Japan
- Australia
- Indonesia
- South Korea
- Thailand
- Singapore
- Rest of Asia-Pacific
- South America
- Brazil
- Argentina
- Colombia
- Chile
- Peru
- Rest of South America
- Middle East and Africa
- South Africa
- Saudi Arabia
- United Arab Emirates
- Nigeria
- Egypt
- Morocco
- Turkey
- Rest of Middle East and Africa
- North America
Data Sources, Market Sizing, and Validation
Desk Research
Desk research was used to map the demand pool and set practical ranges for volumes, pricing, and seasonality before interviews started. We referenced public sources such as US Census retail trade releases, US Bureau of Labor Statistics consumer spending and price series, Eurostat household consumption indicators, UN Comtrade trade flows, and selected customs tariff schedules used to tag relevant product families.
To cross-check supplier scale and channel trends, we also reviewed company annual reports, investor presentations, press releases, and outdoor recreation association websites, followed by credible press coverage on participation and travel patterns. Where needed, paid subscriptions for company financials and news, import and export shipment-level records, and patent databases helped confirm product innovation themes and reduce missed player risk. These examples are not exhaustive, and many other sources were used for collection, validation, and clarification.
Primary Interviews and Surveys
Primary work focused on interviews and structured surveys with manufacturers, brand teams, distributors, retailers, and rental and campground operators, so that sell-in and sell-through signals could be compared. Inputs were validated across APAC, EMEA, and the Americas, with follow-ups used to close gaps on price bands, mix shifts across gear categories, and online versus offline channel splits.
Distribution of primary research fieldwork respondents
| Company type | Respondent position | Region |
|---|---|---|
| Top tier: 39% | CXOs: 13% | APAC: 39% |
| Mid tier: 42% | Functional/Unit leaders: 29% | EMEA: 37% |
| Smaller Players: 19% | Managers: 58% | Americas: 24% |
Market-Sizing & Forecasting
The core model uses a top-down build where outdoor participation and camping trip frequency are translated into a gear demand pool, then adjusted by replacement cycles and average spend per trip. To keep the totals realistic, we corroborate results with selective bottom-up checks, such as sampled average selling price (ASP) ranges by category times implied unit demand, plus channel checks on online share and seasonal stocking patterns.
Key inputs that shaped the model included camping participation rates, household discretionary spend trends, import and export movements for major gear families, online retail penetration, and ASP progression by category as materials and features change (for example, lightweight fabrics and power-enabled lighting). When data was thin for smaller countries, proxy indicators like trade intensity and income bands were used first, then refined through interviews.
For forecasting, scenario analysis was applied around participation growth, pricing inflation, and channel shift, and the chosen path was further filtered through expert consensus from primary discussions. Forecast assumptions were carried forward year by year so that mix shifts across tents, sleep systems, cooking gear, and carry systems could be tracked without overfitting the data.
Data Validation & Update Cycle
Outputs are checked against independent signals such as trade values, retail activity indicators, and category-level price direction, and then variances are investigated before sign-off. When a swing is driven by a one-off effect, the assumption is isolated and tested again with fresh calls so the impact does not get mistakenly annualized.
A multi-step review is used, where another analyst challenges scope, conversions, and growth logic, followed by a final consistency scan across regions and categories. Reports are refreshed annually, with interim updates when material events occur, and a final pre-delivery pass is done so clients receive the latest view available.
Mordor Intelligence's Camping Equipment Market Size Compared With Other Published Estimates
Published market sizes for camping equipment often vary because groups define what counts as equipment differently, and they do not always value the market at the same point in the channel. Differences also show up when one estimate is built from demand signals and another is anchored on trade or producer revenue, which can shift the number even if growth trends look similar.
In this study, the spread is mainly explained by whether camping furniture, coolers and hydration, and lighting and power are counted consistently, plus whether commercial use like rentals and tour operators is included alongside personal purchases, a scope choice applied by Mordor Intelligence.
Benchmark comparison
| Source | Market Size | Gaps in Research Methodology |
|---|---|---|
| Mordor Intelligence | USD 22.08 B (2026) | |
| Industry Publisher A | USD 18.42 B (2025) | Uses a different base year and a tighter product basket that groups tents and accessories more heavily, with fewer adjacent categories explicitly counted. The lower value can also reflect a more conservative ASP curve across premium features when shifting from 2025 to later years. |
| Trade Analytics Firm B | USD 15.00 B (2024) | Values the market at nominal wholesale prices and excludes retail margins and several downstream costs, which typically produces a smaller number than consumer-spend style estimates. Its trade and production lens can also understate locally produced and locally sold volumes where customs visibility is limited. |
Taken together, the table shows that the biggest drivers are channel level used for valuation and how fully adjacent gear categories are captured. By keeping the scope explicit and tying assumptions to participation, replacement, pricing, and channel indicators, we get a number that can be traced back to simple inputs and repeated in future updates.


Key Questions Answered in the Report
How large is the camping equipment market in 2026 and what growth is expected?
The market is valued at USD 22.08 billion in 2026 and is projected to reach USD 29.49 billion by 2031, growing at a 5.92% CAGR.
Which product type holds the biggest share?
Backpacks led in 2025 with 28.12% camping equipment market share.
What is driving faster growth in Asia-Pacific?
Rising middle-class incomes, government campground investments, and social-media exposure are pushing the region toward a 7.34% CAGR through 2031.
Why is online retail gaining traction?
Direct-to-consumer brands, flexible payment solutions, and omnichannel services are propelling online sales at an 8.16% CAGR to 2031.
How are brands addressing sustainability concerns?
They are eliminating PFAS, expanding recycled-material use, seeking third-party eco-certifications, and piloting resale programs that extend product lifecycles.
Page last updated on:


 Your data is secure and never sold or shared.


