
Market Overview
| Study Period | 2020 - 2031 |
|---|---|
| Forecast Data Period | 2026 - 2031 |
| Base Year Market Size (2025) | USD 681.20 Million |
| Market Size (2026) | USD 723.70 Million |
| Market Size (2031) | USD 894.60 Million |
| Growth Rate (2026 - 2031) | 4.33 % |
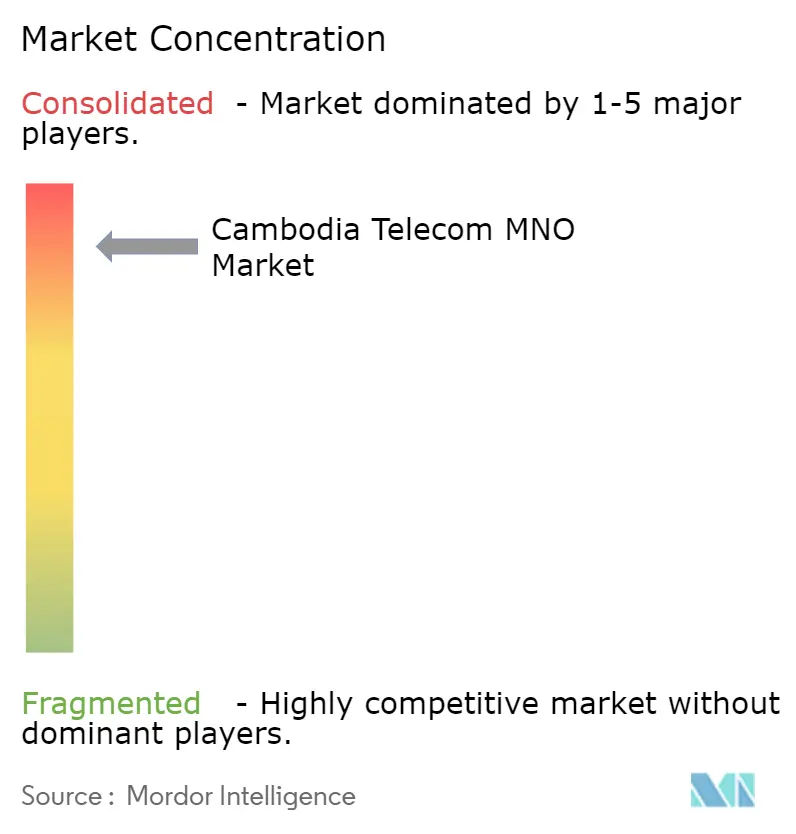
| Market Concentration | High |
Major Players *Disclaimer: Major Players sorted in no particular order Image © Mordor Intelligence. Reuse requires attribution under CC BY 4.0. | |
Cambodia Telecom MNO Market Analysis by Mordor Intelligence
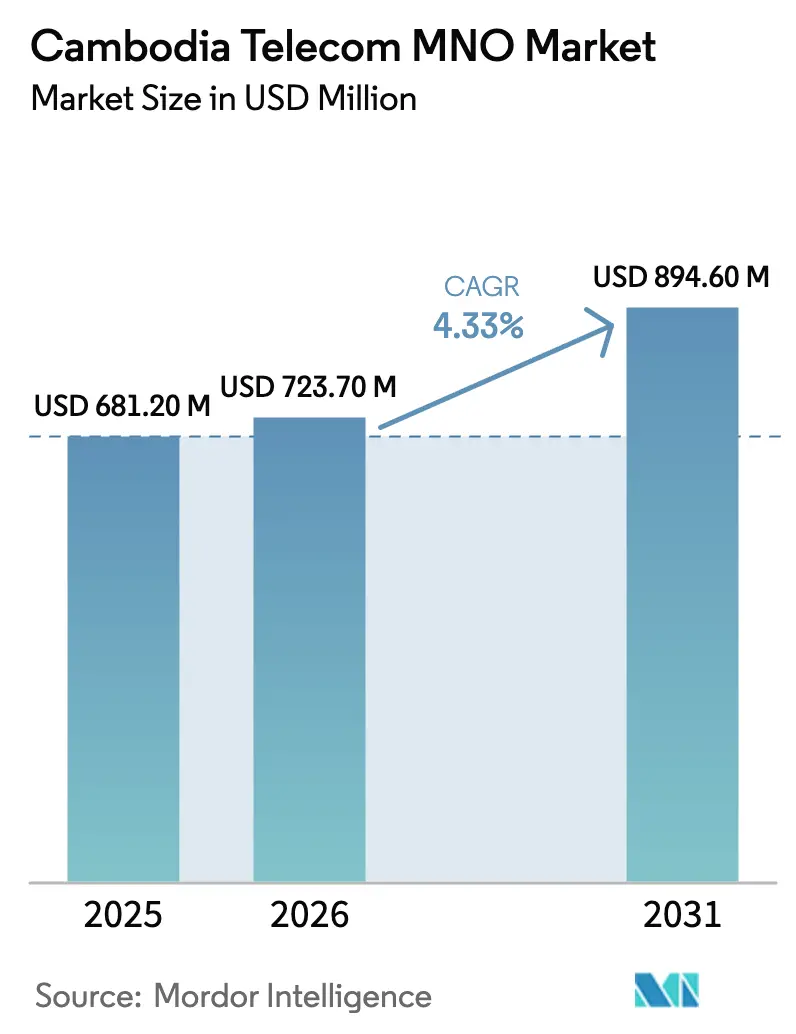
The Cambodia Telecom MNO market size is projected to be USD 681.20 million in 2025, USD 723.70 million in 2026, and reach USD 894.60 million by 2031, growing at a CAGR of 4.33% from 2026 to 2031. Healthy revenue expansion hides a strategic transformation as operators push commercial 5G, broaden rural coverage, and chase enterprise digitalization. Network investments now center on the 3.5 GHz C-band, 700 MHz refarming, and dense fiber backhaul that can absorb monthly mobile data usage already averaging 7.6 GB. At the same time, regulatory changes such as the 5-SIM-per-ID cap compel operators to pivot from volume-driven subscriber adds toward higher-value data, fintech, and B2B solutions. The three-player concentration, relentless price promotions, and rising power costs mean profitability will hinge on how quickly each operator turns early 5G adoption into differentiated service tiers and cross-selling opportunities in the Cambodia Telecom MNO market.
Key Report Takeaways
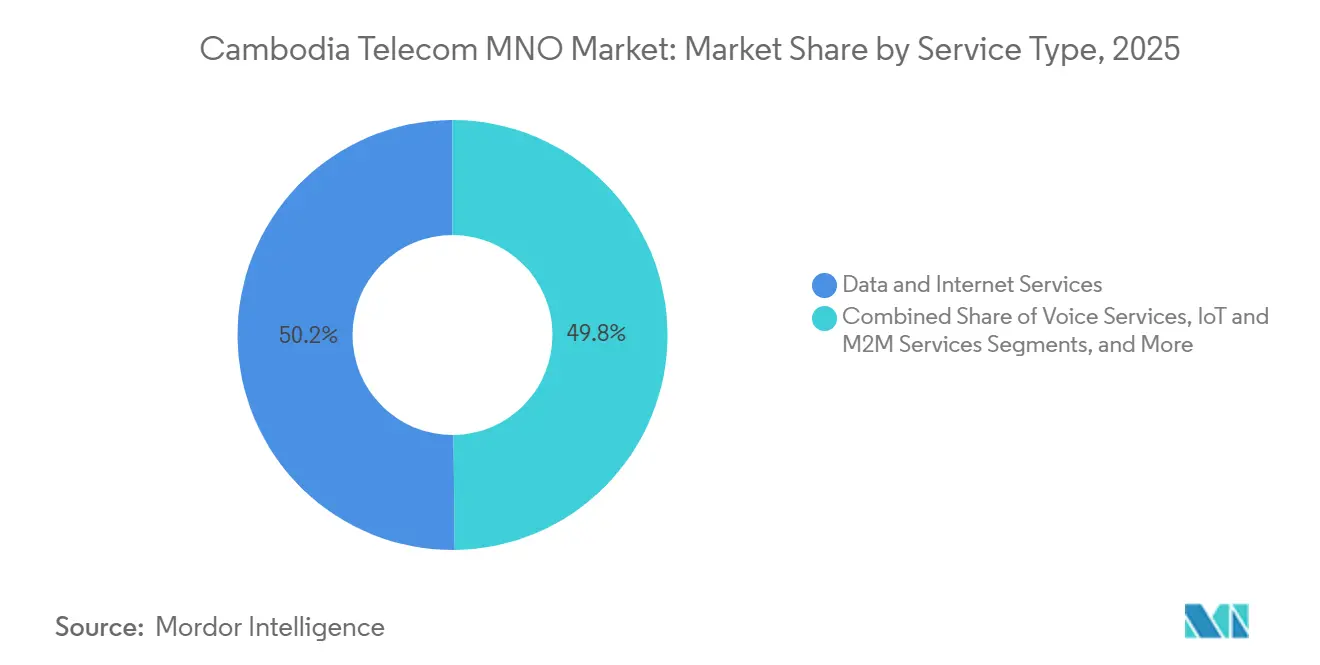
- By service type, Data and Internet Services led with 50.17% of Cambodia Telecom MNO market share in 2025, while IoT and M2M Services are projected to expand at a 4.64% CAGR through 2031.
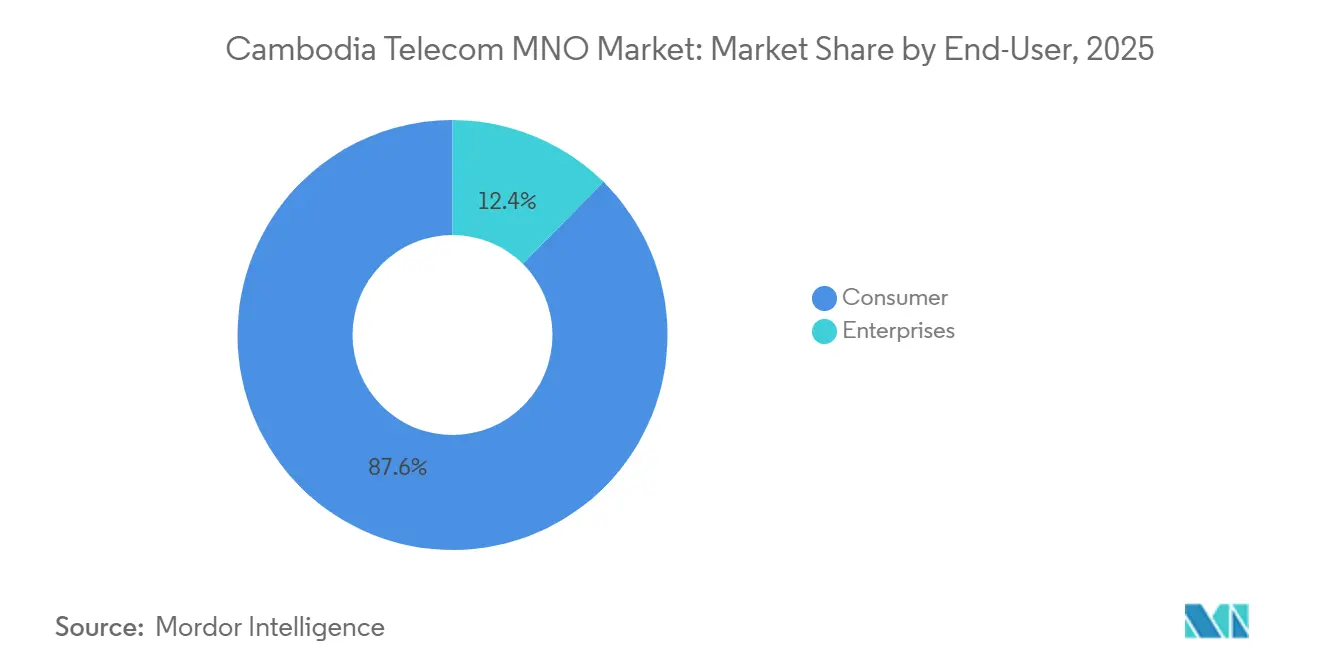
- By end-user, Consumer subscribers accounted for 87.62% of revenue in 2025; Enterprise connectivity is on track for the fastest growth, advancing at a 5.02% CAGR to 2031.
Note: Market size and forecast figures in this report are generated using Mordor Intelligence’s proprietary estimation framework, updated with the latest available data and insights as of 2026.
Cambodia Telecom MNO Market Trends and Insights
Drivers Impact Analysis*
| Driver | (~) % Impact on CAGR Forecast | Geographic Relevance | Impact Timeline |
|---|---|---|---|
| Rapid Mobile Data Consumption Fueled by Affordable Smartphones | +1.2% | National, Concentrated in Phnom Penh, Kandal, Siem Reap | Short Term (≤ 2 Years) |
| Expansion of 4G LTE Coverage and Pending 5G Licensing Auctions | +0.9% | National, With Urban-First 5G Rollout in Phnom Penh, Sihanoukville, Siem Reap | Medium Term (2–4 Years) |
| Government Digital Economy Roadmap 2021–2035 Accelerating Connectivity | +0.7% | National, With Emphasis on Rural and Border Provinces | Long Term (≥ 4 Years) |
| Growing Adoption of Cloud Gaming and Short-Form Video Driving High-Bandwidth Demand | +0.6% | Urban Centers (Phnom Penh, Siem Reap, Battambang) | Short Term (≤ 2 Years) |
| International Submarine Cable Landings Enhancing Backhaul Capacity | +0.5% | Nationwide Benefit via Lower Gateway Costs | Medium Term (2–4 Years) |
| Rise of Mobile-Wallet Micro-Insurance Bundles Boosting ARPU | +0.4% | Higher Penetration in Banked Urban Populations | Medium Term (2–4 Years) |
| Source: Mordor Intelligence | |||
Rapid Mobile Data Consumption Fueled by Affordable Smartphones
Entry-level 4G handsets priced between USD 50 and USD 100 from Chinese brands have pushed smartphone penetration above 94%, turning video streaming and social media into habitual uses that now average 7.6 GB of data per month. Popularity of YouTube, Facebook, and TikTok keeps traffic growth on a steep curve, forcing operators to add 4.5G carrier aggregation, expand small cells, and prepare spectrum re-farming ahead of full-scale 5G rolloutL. Smart Axiata’s 600 Mbps LTE-Advanced Pro network illustrates the performance race that is meant to lock in high-usage subscribers before rivals match capacity.[1]The Fast Mode, “Smart Axiata to Launch 600 Mbps 4.5G Network,” thefastmode.com Yet unlimited-data packs compress margins, so operators bundle e-wallets, video subscriptions, and loyalty apps to capture additional spend, a tactic that underpins sustained revenue in the Cambodia Telecom MNO market.
Expansion of 4G LTE Coverage and Pending 5G Licensing Auctions
Nationwide 4G now reaches more than 92% of Cambodians, but the official commercial 5G launch on 31 December 2025 signals an accelerated policy push to leapfrog neighbors. The Ministry of Posts and Telecommunications has already distributed 100 MHz of 3.5 GHz spectrum and plans to auction 700 MHz in early 2026, giving operators both capacity and coverage bands. Smart Axiata activated over 600 5G sites across 21 provinces in under a month, while Metfone finished hardware deployment across all 25 provinces, underscoring the speed of competition.[2]Smart Axiata, “Rapid 5G Expansion Across Cambodia,” smart.com.kh Early nationwide availability should enable fixed-wireless access for SMEs and IoT field devices, creating immediate monetization pathways that anchor long-term growth for the Cambodia Telecom MNO market.
Government Digital Economy Roadmap 2021-2035 Accelerating Connectivity
National policy now mandates universal broadband, digital government portals, and electronic payments, directly raising baseline demand for reliable mobile networks. Projects such as Metfone’s School Information System, due for mandatory use across all public schools, embed operators inside the education infrastructure and guarantee traffic that is immune to consumer churn. Wide adoption of the National Bank of Cambodia’s Bakong payment rail, which processed transactions worth triple national GDP in 2024, creates large-scale e-wallet traffic that operators can tap through integrated mobile money.[3]National Bank of Cambodia, “Bakong Payment System Statistics,” nbc.gov.kh These programs combine to provide stable, policy-backed revenue that cushions price pressure in the Cambodia Telecom MNO market.
Growing Adoption of Cloud Gaming and Short-Form Video Driving High-Bandwidth Demand
Forty-five percent of internet users now play video games, and TikTok penetrates nearly half the online population, creating symmetrical traffic spikes that legacy download-biased networks cannot handle. Smart Axiata’s 5G tests already deliver 100-200 Mbps, enough for real-time multiplayer and 4K video, enabling the operator to launch tiered latency-guaranteed plans aimed at gamers and content creators. Cellcard is matching the shift by promoting 5G-to-home fixed-wireless, which offers steadier throughput for binge streaming and cloud gaming sessions. Latency-sensitive entertainment therefore becomes both a quality differentiator and a new revenue layer for the Cambodia Telecom MNO market.
Restraints Impact Analysis*
| Restraint | (~) % Impact on CAGR Forecast | Geographic Relevance | Impact Timeline |
|---|---|---|---|
| Intensifying Price Competition Among MNOs Compressing Margins | -0.8% | National, Most Acute in Phnom Penh and Other Urban Centers | Short Term (≤ 2 Years) |
| High Rural Deployment Costs Versus Low Income Base | -0.6% | Remote Provinces (Ratanakiri, Mondulkiri, Preah Vihear, Stung Treng) | Medium Term (2–4 Years) |
| Limited Fiber Backhaul Causing Capacity Bottlenecks | -0.4% | Semi-Urban and Deep Rural Districts | Short Term (≤ 2 Years) |
| Regulatory Uncertainty on Active Sharing Delaying 5G Small Cells | -0.3% | Dense Urban Zones That Need Indoor Micro-Sites | Medium Term (2–4 Years) |
| Source: Mordor Intelligence | |||
Intensifying Price Competition Among MNOs Compressing Margins
With active SIMs exceeding the national population by 30%, subscriber growth has stalled, pushing operators to slash tariffs and issue promotional unlimited-data offers. Average revenue per user is therefore falling even as total data volume climbs, a mismatch that erodes EBITDA in the Cambodia Telecom MNO market. Cellcard’s 7% year-over-year revenue decline in Q4 2024 and resulting strategic turn toward fixed-wireless highlight the squeeze.[4]Khmer Times, “Cellcard Home WiFi Growth in Q4 2024,” khmertimeskh.com The 5-SIM-per-ID rule introduced in 2025 removed multi-SIM hoarding, forcing players to chase genuine engagement through experience and digital bundles instead of discounts, but it also amplified the fight for each retained user.
High Rural Deployment Costs Versus Low Income Base
A single tower in sparsely populated provinces can cost up to USD 150,000 even before power and backhaul, yet revenue per rural user rarely exceeds USD 3 per month, stretching payback beyond a decade.[5]Phnom Penh Post, “Rural Tower Economics Troubles Operators,” phnompenhpost.com Smart Axiata’s use of solar-powered eNodeBs lowers opex but drives higher capex, and only operators with deep balance sheets or state backing can subsidize broad coverage. Absence of a well-funded universal service fund means private capital must shoulder most obligations. As a result, rural builds remain a reluctant regulatory requirement rather than a profit engine in the Cambodia Telecom MNO market.
*Our forecasts treat driver/restraint impacts as directional, not additive. The impact forecasts reflect baseline growth, mix effects, and variable interactions.
Segment Analysis
By Service Type: Data Leadership with Emerging IoT Upside
Data and Internet Services captured 50.17% of Cambodia Telecom MNO market share in 2025, a dominance built on mobile-first browsing, OTT video, and social media. The Cambodia Telecom MNO market size attached to data services widened further once 5G went live, as early adopters consumed high-definition streams and cloud applications that demand consistent 100-plus Mbps downlink. Voice and SMS revenue continues to shrink because 93.9% of users rely on internet messaging platforms. In response, operators package unlimited on-net VoIP within data bundles to preserve engagement while steering customers toward premium video or gaming passes. PayTV apps such as Metfone’s TV360 and Smart Axiata’s SmartNas TV add stickiness by tying entertainment to the mobile bill, locking households into the wider Cambodia Telecom MNO market ecosystem.
IoT and M2M lines are still a low-single-digit contributor but are forecast to outgrow the headline market by nearly 0.3 percentage points each year. Agricultural sensor pilots in Battambang and Preah Vihear show how NB-IoT overlays piggyback on existing 4G footprints to monitor soil moisture and pest conditions. Urban authorities in Phnom Penh are trialing cellular-linked traffic cameras and smart lighting, while electric utilities test prepaid smart meters that automatically top up via mobile wallets. Success will hinge on operators bundling cloud dashboards, field support, and predictive analytics, converting simple connectivity into a full managed-service stack. As these bundled offers scale, they broaden the Cambodia Telecom MNO market size attached to enterprise revenue streams.


By End-User: Enterprise Momentum Amid Consumer Saturation
Consumers still supplied 87.62% of Cambodia Telecom MNO market revenue in 2025, yet price wars and saturated penetration cap upside. Operators therefore upsell premium 5G postpaid that guarantees higher speeds, bundles music and video, and rewards loyalty points convertible to retail vouchers, maintaining differentiation inside the Cambodia Telecom MNO market. The fixed-wireless access surge, typified by Cellcard Home WiFi’s 48% revenue jump in Q4 2024, shows operators crossing into household broadband to capture incremental spend previously directed to ISPs.
Enterprise clients, though only 12.38% of the base, are projected to deliver the fastest value expansion at a 5.02% CAGR. Memoranda signed by Smart Axiata and Huawei cover 5G private networks, SD-WAN, and cloud, giving Cambodian manufacturers and banks a turnkey path to Industry 4.0. Metfone’s government learning platform further embeds mobile lines inside public-sector IT budgets. Because enterprises sign multi-year contracts that include service-level agreements and managed cybersecurity, EBITDA margins trend higher than on mass consumer traffic, balancing the Cambodia Telecom MNO market size that may otherwise struggle to keep pace with capex.
Geography Analysis
Phnom Penh anchors operator economics, hosting over 400 of Smart Axiata’s first 600 commercial 5G sites and generating the highest ARPU thanks to affluent households, corporate headquarters, and government agencies . Kandal province benefits from industrial estates spilling out of the capital, so operators deploy contiguous 5G cells to serve factories demanding real-time production data links. Siem Reap, while smaller, justifies dense coverage because tourism businesses require high-bandwidth Wi-Fi for booking, payments, and live video promotions. Sihanoukville’s seaport and surrounding special economic zone attract Chinese investment, driving enterprise fiber links, while Battambang’s agriculture-driven economy is adopting precision-farming IoT that needs reliable mid-band LTE backhaul.
Beyond the five main provinces, coverage becomes patchy. Metfone leads rural deployment, claiming 98% population reach after constructing 500-plus towers in border and island areas, a strategy enabled by Viettel’s military heritage and long investment horizon. Cellcard and Smart Axiata, though expanding rural footprints, focus capex on densifying urban 4G and rolling out urban 5G first, citing superior return profiles. The Digital Economy Roadmap nevertheless obliges all operators to submit rollout schedules for underserved districts, keeping rural coverage a compliance item even when not immediately profitable.
Cross-border corridors represent an untapped extension of the Cambodia Telecom MNO market. Metfone’s Indochina zero-roaming proposition with Vietnam and Laos gives migrant workers seamless voice and data, and Smart Axiata’s roaming hubs with Thailand’s AIS target similar travelers. Sea-cable landings at Sihanoukville add international bandwidth that reduces transit prices, improving retail margins nationwide. Collectively, these geographic vectors suggest operators will deepen an urban-to-rural, domestic-to-cross-border hierarchy, aligning network spend with incremental ARPU throughout the forecast period.
Regulatory Landscape
Cambodia’s telecom sector is overseen by the Ministry of Posts and Telecommunications (MPTC) for policy and the Telecommunication Regulator of Cambodia (TRC) for regulation and market supervision. Policy direction is linked to national digital programs such as the Cambodia Digital Economy and Society Policy Framework 2021-2035 and the Cambodia Digital Government Policy 2022-2035, and the commercial 5G launch around the start of 2026 reinforced the state’s emphasis on next-generation mobile networks.
In 2026, regulators moved toward tighter, more standardized compliance for devices and customer protection. On April 23, 2026, MPTC and TRC opened a public consultation on draft Prakas covering technical standards for telecom equipment and a type approval and conformity assessment framework, with submissions requested by May 25, 2026. The drafts introduce risk-based equipment classification and require foreign manufacturers to work through a TRC-certified local qualified agent. MPTC and TRC also ran a July 6-7, 2026 workshop (with the EU-German GATE project) to develop a draft consumer protection Prakas, indicating a stronger focus on service transparency and user safeguards as 5G and digital services expand.
Competitive Landscape
Metfone, Smart Axiata, and Cellcard together hold more than 95% of subscribers, yet rivalry remains intense as each tries to out-invest in spectrum, backhaul, and service ecosystems. Metfone leverages close to 40,000 km of fiber and 6,000 towers to pitch 98% population coverage, reinforcing a nationwide presence unrivaled by peers. Smart Axiata responds with speed, adding 475 LTE sites in 2024, securing a USD 50 million bank facility in 2025, and switching on 600 5G cells in under 30 days, making rapid deployment its point of differenc. Cellcard plays the profitability card, doubling profit in early 2025 via tight cost controls, pushing XGS-PON fiber with Nokia, and scaling its 5G-to-home package, positioning itself as a convergence challenger.
Supplier dynamics are also shifting. Huawei equips much of Smart Axiata’s 5G network, but Japanese incumbents NTT Docomo and NEC have started test networks to offer alternative RAN solutions that could balance geopolitical exposure. Independent towerco EDOTCO signed a plan with Metfone to roll out 500 shared sites, a move that could lower duplication costs. All three majors joined the GSMA Open Gateway API program, opening network functions such as carrier billing and device verification to developers, a step meant to create third-party service revenue even as core connectivity margins tighten. Together, these strategies define a Cambodia Telecom MNO market where capital intensity stays high but new monetization models are emerging.
Cambodia Telecom MNO Industry Leaders
Metfone (Viettel (Cambodia) Pte. Ltd.)
Smart Axiata Co., Ltd.
Cellcard (CamGSM Co., Ltd.)
Cootel (Xinwei (Cambodia) Telecom Co. Ltd.)
- *Disclaimer: Major Players sorted in no particular order

Market Opportunities and Future Outlook
Commercial 5G availability in early 2026 created near-term whitespace for monetization beyond price-led mobile broadband, particularly in fixed wireless access (FWA) and enterprise connectivity. The pace of site rollout provides a basis for new tiers and use cases, with Smart Axiata reporting 750 deployed 5G sites across 21 provinces by April 2026 and Cellcard stating in May 2026 that it had expanded to over 500 5G sites, along with a near-term scale-up target. With monthly mobile data usage already averaging 7.6 GB, operators have room to shift away from unlimited-data discounting toward differentiated experiences, including gaming and video, and multi-product bundles tied to content and fintech.
Enterprise and public-sector digitization programs also widen demand for managed services, private networking, and IoT. The government’s Digital Economy Roadmap and digital government agenda support offerings where mobile operators package connectivity with platforms such as education, e-payments, and field IoT, rather than selling standalone SIMs. At the same time, GSMA Open Gateway initiatives and CAMARA APIs, including identity verification and fraud detection, provide a pathway to developer-facing network capabilities that operators can bundle into B2B offerings, which is relevant in a market constrained by the 5-SIM-per-ID rule and shaped by intense competition.
Recent Industry Developments
- May 2026: Cellcard (CamGSM Co., Ltd.) Deployment of over 500 5G base transceiver stations (BTS), with a target of exceeding 1,000 sites by end-July 2026. The deployment of over 500 5G BTS expands Cambodia's 5G footprint and strengthens competitive positioning in rural and enterprise segments. The rapid rollout supports enhanced network capacity and service differentiation for 5G enabled offerings across key customer groups.
- May 2026: Smart Axiata Co., Ltd. Memorandum of Understanding with Canadia Group to advance digital transformation across Canadia’s business portfolio. The memorandum advances enterprise ICT ecosystem development by integrating Canadia’s clients with Smart Axiata's digital services. The collaboration could lift B2B revenue through cross selling of 5G and digital services across Canadia’s client base.
- March 2026: Smart Axiata Co., Ltd. Memorandum of Understanding with Grab to explore digital services and mobility solutions. The collaboration expands monetization avenues beyond traditional connectivity through ecosystem partnerships. The alliance broadens Smart Axiata’s reach into mobility and digital services, creating potential new revenue streams and enhanced customer value.


Research Methodology Framework and Report Scope
Market Definition and Coverage
For this report, the market covers telecom service revenues generated in Cambodia by mobile network operators, spanning voice, messaging, mobile data and internet access, and related operator-led digital services tied to connectivity.
Scope exclusions: Adjacent ICT spending that is not an operator service revenue line item (such as standalone IT services and hardware sales) is excluded.
Segmentation Overview
- Overall Telecom Revenue and ARPU
- Service Type
- Voice Services
- Data and Internet Services
- Messaging Services
- IoT and M2M Services
- OTT and PayTV Services
- Other Services (VAS, Roaming and International Services, Enterprise and Wholesale Services, Rest of Service Type)
- End-User
- Enterprises
- Consumer
Data Sources, Market Sizing, and Validation
Desk Research
Desk research starts with building the Cambodia telecom baseline using official statistics and policy disclosures, because these provide repeatable demand signals. We referenced public sources such as the Telecommunication Regulator of Cambodia releases, Ministry of Posts and Telecommunications publications, ITU indicators, World Bank data series, and operator licensing and spectrum updates where available.
From these sources, we pull inputs like subscriber counts, internet penetration, network rollout milestones, and sector fees or regulatory contributions to sanity-check the direction of service revenue. We also review operator announcements and local business press for changes in tariff posture, tower additions, and 4G to 5G rollout timing. Where a company financial line was not directly published, a paid subscription covering company financials and a separate patent database were used selectively to fill ownership structure context and to track technology themes. The desk source list above is illustrative, and additional public documents were used to cross-check data and clarify assumptions.
Primary Interviews and Surveys
We use interviews and surveys with telecom executives, functional leaders, and managers in Cambodia to test pricing, subscriber activity, data demand, enterprise use, and investment assumptions. Responses help fill gaps in public revenue data, validate secondary indicators, and triangulate the final market estimate.
Distribution of primary research fieldwork respondents
| Company type | Respondent position |
|---|---|
| Top tier: 28% | CXOs: 16% |
| Mid tier: 47% | Functional/Unit leaders: 29% |
| Smaller Players: 25% | Managers: 55% |
Market-Sizing & Forecasting
Sizing is built with a top-down approach where the service revenue pool is reconstructed from operator activity signals, subscriber bases, and typical revenue-per-user patterns that are validated through interviews. After that, selective bottom-up checks are used, including sampled bundle pricing, estimated active users by plan type, and channel feedback on recharge and data pack mix, which helps adjust totals when a single indicator looks overstated.
Key inputs used in the model include the mobile subscriber base and multi-SIM intensity, mobile internet user growth, smartphone and data usage trends, the share of revenue shifting from voice to data, and the pace of 4G upgrades and early 5G launches that influence premium pack adoption. For forecasting, scenario analysis is applied around pricing pressure and data demand growth, and each scenario is tied back to interview consensus on ARPU direction, network investment cycles, and enterprise connectivity uptake. If a bottom-up cross-check cannot cover smaller provinces with the same confidence, we handle the gap by applying conservative ranges and then re-testing the implied ARPU against independent penetration and usage indicators.
Data Validation & Update Cycle
Outputs are checked through triangulation across multiple signals, not just one dataset, so the final numbers stay consistent with how the market behaves on the ground. We run variance checks across year-on-year growth, implied ARPU, and implied revenue mix splits, and any outliers are reviewed again with source notes and follow-up questions.
Before sign-off, the model and assumptions go through multi-step analyst review so calculation logic, units, and currency conversion timing are consistent. Reports are refreshed annually, and interim updates are made when material events occur, such as major tariff changes, new spectrum awards, or regulatory shifts that affect SIM counts and usage. Right before delivery, an analyst performs a fresh pass on key indicators so clients receive the latest updated view.
Mordor Intelligence's Cambodia Telecom Market Size Compared Against Other Published Estimates
Published market sizes for Cambodia telecom can look different because each publisher defines what counts as telecom revenue and then uses different inputs to project pricing and usage. The gaps usually come from whether the study is measuring operator service revenues only, or whether it also mixes in broader digital services, devices, and non-operator connectivity providers.
Handset and device sales sit outside Mordor Intelligence's scope, which is one reason our number can be lower than estimates that blend telecom operator revenues with smartphone retail value and unrelated ICT lines. Differences also show up when sources assume aggressive ARPU expansion from 5G, or when multi-SIM behavior is not normalized and the subscriber base is treated as unique users. Finally, timing matters, because currency conversion windows and refresh cadence can shift the reported USD value even when local currency trends are similar.
Benchmark comparison
| Source | Market Size | Gaps in Research Methodology |
|---|---|---|
| Mordor Intelligence | USD 0.72 B (2026) | |
| Industry Association A | USD 0.95 B (2026) | Often blends operator service revenues with broader ICT and device value, and may apply higher assumed ARPU uplift from rapid 5G monetization without consistent plan-level cross-checks. |
| Regional Consultancy B | USD 0.61 B (2026) | Can undercount informal multi-SIM usage and data add-on purchases by leaning heavily on reported subscriber totals and conservative pricing, which reduces implied service revenue per connection. |
Looking at the spread, most of the difference is explained by what gets counted and how ARPU is projected, rather than by disagreement on subscriber growth direction. Our approach stays traceable to a clear service-revenue pool, and it is then pressure-tested with pricing and usage checks so the final figure remains practical to replicate and update year to year.


Key Questions Answered in the Report
How large is the Cambodia Telecom MNO market in monetary terms today?
It stands at USD 0.72 billion in 2026 and is forecast to reach USD 0.89 billion by 2031.
What is the projected growth rate for Cambodian mobile operators?
Aggregate revenue is expected to rise at a 4.33% CAGR between 2026 and 2031.
Which service category generates most operator revenue?
Data and Internet Services contribute just over 50% of total mobile network operator turnover.
How quickly will enterprise connectivity grow?
Enterprise revenue streams are projected to expand at a 5.02% CAGR as businesses adopt 5G, SD-WAN, and IoT.
Who are the leading players?
Metfone, Smart Axiata, and Cellcard command more than 95% of subscribers nationwide.
What challenges limit rural network expansion?
High capex per tower, low user incomes, and limited fiber backhaul extend payback periods beyond ten yea
Page last updated on:


 Your data is secure and never sold or shared.


