Market Overview
| Study Period | 2020 - 2031 |
|---|---|
| Forecast Data Period | 2026 - 2031 |
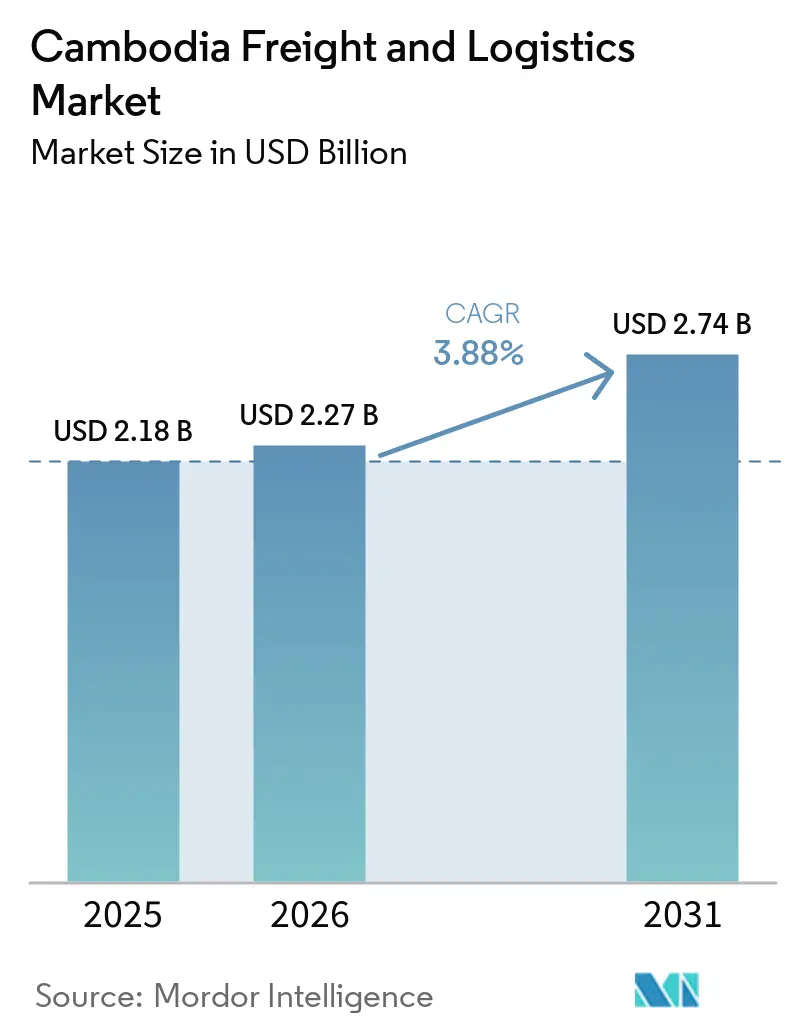
| Base Year Market Size (2025) | USD 2.18 Billion |
| Market Size (2026) | USD 2.27 Billion |
| Market Size (2031) | USD 2.74 Billion |
| Growth Rate (2026 - 2031) | 3.88% CAGR |
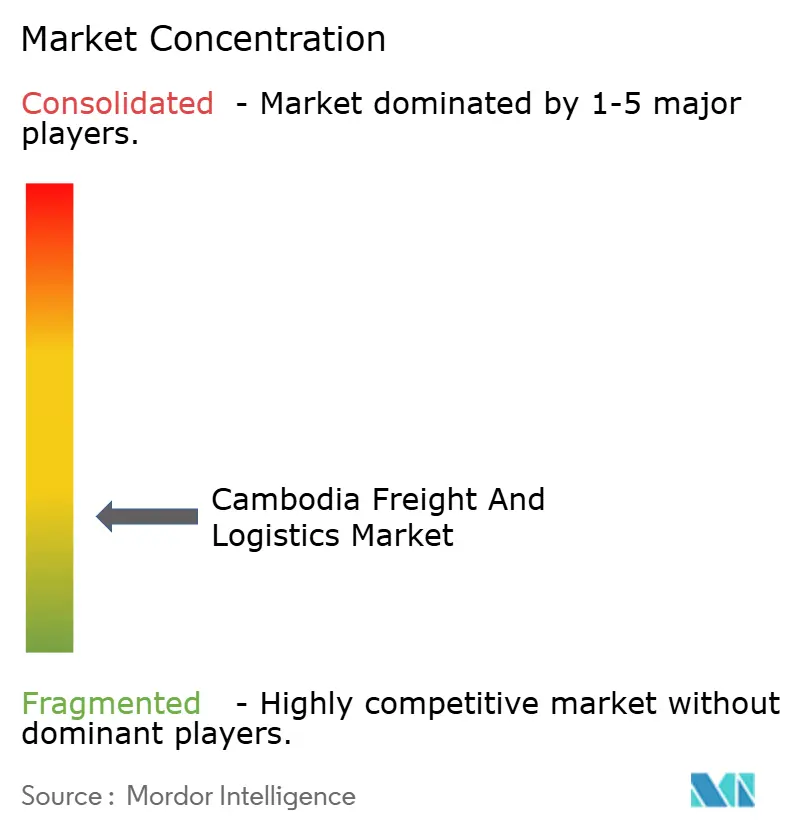
| Market Concentration | Low |
Major Players *Disclaimer: Major Players sorted in no particular order Image © Mordor Intelligence. Reuse requires attribution under CC BY 4.0. | |
Cambodia Freight And Logistics Market Analysis by Mordor Intelligence
The Cambodia Freight And Logistics Market size is projected to be USD 2.18 billion in 2025, USD 2.27 billion in 2026, and reach USD 2.74 billion by 2031, growing at a CAGR of 3.88% from 2026 to 2031.
Expansion reflects deeper regional supply-chain integration as tariff-free trade under the Regional Comprehensive Economic Partnership (RCEP) lifts throughput at Sihanoukville port, while China-plus-one manufacturing migration injects fresh export volumes, particularly from Special Economic Zones surrounding Phnom Penh and Bavet. Upgrades to the Phnom Penh–Sihanoukville expressway and commercial 5G rollouts are allowing third-party providers to integrate telematics, cut fuel use, and deliver real-time shipment visibility. Bonded logistics zone incentives contained in the National Logistics Master Plan 2025 are lowering warehousing costs for export-oriented manufacturers, while Techo International Airport’s July 2025 opening gives the Cambodia freight and logistics market a long-term air-cargo growth engine focused on EU-bound sustainable aviation fuel (SAF) corridors.
Key Report Takeaways
- By logistics function, freight transport held 60.66% of the Cambodia freight and logistics market share in 2025, whereas courier, express, and parcel services are forecast to advance at a 4.85% CAGR to 2031.
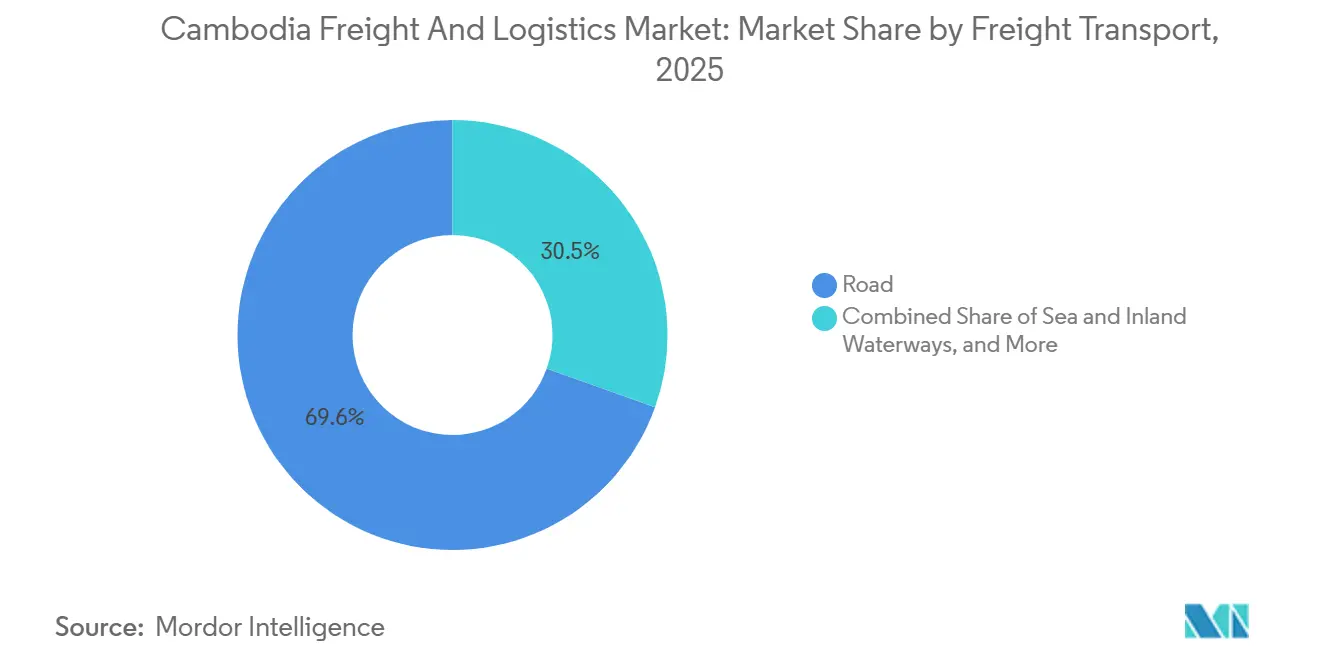
- By mode of transport, road captured 69.55% of the market share in 2025; air freight is projected to climb at a 4.94% CAGR between 2026 and 2031.
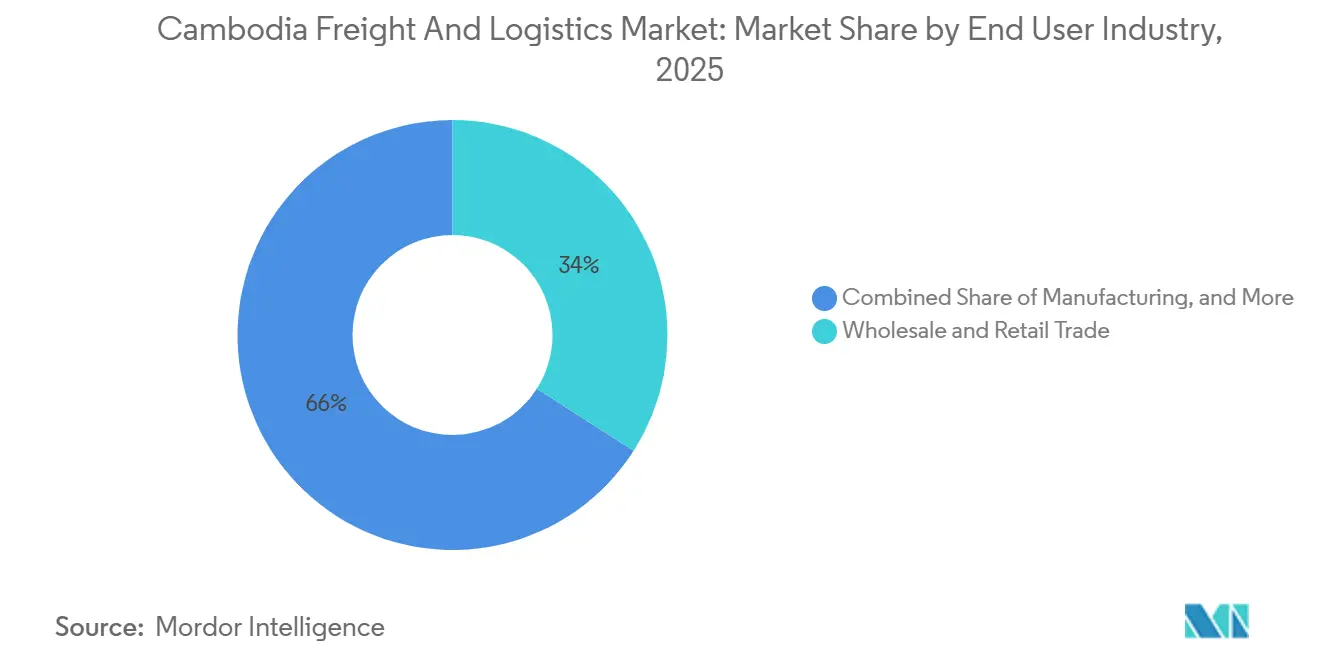
- By end user industry, wholesale and retail trade led with 34.04% of the Cambodia freight and logistics market size in 2025, yet manufacturing is set to expand at a 4.19% CAGR through 2031.
- By temperature control, non-temperature-controlled facilities accounted for 91.52% of the market share in 2025, while temperature-controlled warehousing grew the fastest at 3.96% CAGR from 2026 to 2031.
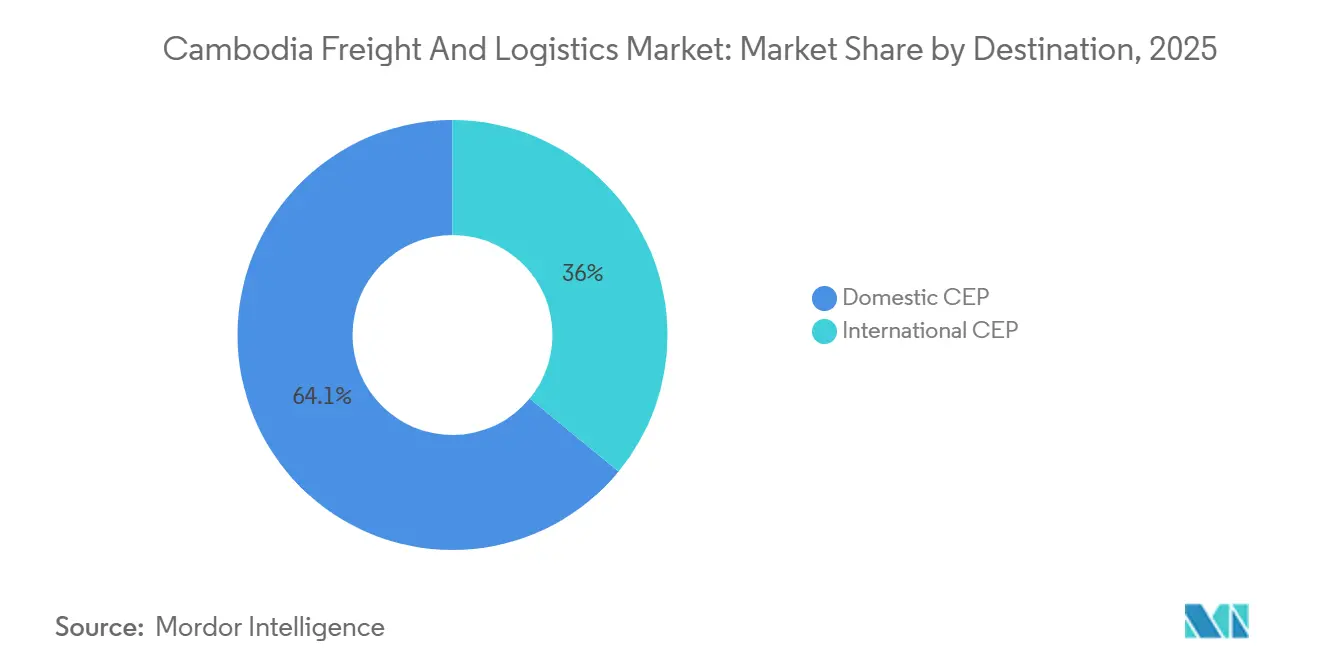
- By destination, domestic CEP commanded 64.05% market share in 2025, whereas international CEP registers the highest projected 5.02% CAGR to 2031.
- By freight forwarding, sea and inland waterways freight forwarding held 73.14% market share in 2025; air freight forwarding is set to grow at 4.43% CAGR between 2026-2031.
Note: Market size and forecast figures in this report are generated using Mordor Intelligence’s proprietary estimation framework, updated with the latest available data and insights as of 2026.
Cambodia Freight And Logistics Market Trends and Insights
Drivers Impact Analysis*
| Driver | (~) % Impact on CAGR Forecast | Geographic Relevance | Impact Timeline |
|---|---|---|---|
| RCEP trade facilitation measures raising cross-border freight volumes | +0.9% | ASEAN corridors | Medium term (2-4 years) |
| China+1 manufacturing shift to Cambodia accelerating container throughput | +1.1% | Phnom Penh, Bavet, Sihanoukville SEZs | Medium term (2-4 years) |
| 5G-enabled telematics adoption optimizing 3PL route productivity | +0.5% | Phnom Penh-Sihanoukville axis | Short term (≤ 2 years) |
| EU-Cambodia SAF export corridor catalyzing time-critical air freight | +0.4% | EU trade lanes | Long term (≥ 4 years) |
| Bonded logistics zone incentives under National Logistics Master Plan 2025 | +0.6% | Designated SEZs | Medium term (2-4 years) |
| Mekong agro-aquatic corridor with Vietnam driving barge cold-chain demand | +0.3% | Mekong River basin | Medium term (2-4 years) |
| Source: Mordor Intelligence | |||
RCEP Trade Facilitation Measures Raising Cross-Border Freight Volumes
Elimination of duties on more than 90% of goods traded among 15 member economies is accelerating Cambodia’s container flows, with Sihanoukville’s throughput up 29% in 2024 as RCEP-destined cargo reached 42% of volumes. Preferential rules of origin lower input costs for textile and electronics exporters, while digital trade clauses mandate electronic documentation that sharpens demand for compliant freight platforms. Although advance rulings and expedited clearance are available for authorized operators, uneven land-border enforcement still forces shippers to pad lead times. Logistics providers offering integrated customs solutions are capturing customers who pivot toward RCEP markets[1]“Regional Comprehensive Economic Partnership Agreement,” ASEAN Secretariat, asean.org.
China+1 Manufacturing Shift to Cambodia Accelerating Container Throughput
Fixed-asset approvals totaling USD 3.2 billion in H1 2024, with 42.64% sourced from China, with finance electronics and EV component factories clustered in SEZs. As seven Taiwanese assemblers came online by mid-2025, they triggered a step-change in demand for humidity-controlled warehousing, temperature-managed air freight, and bonded zone storage. Container lines report fuller northbound sailings, while 3PL contracts signed in 2024 jumped 12% as newcomers outsourced logistics to focus on production[2]“Cambodia Investment Boom: USD 3.2 Billion Approved in H1 2024,” Yuanta Securities, yuantacambodia.com.kh.
5G-Enabled Telematics Adoption Optimizing 3PL Route Productivity
Commercial 5G services introduced in Phnom Penh and Sihanoukville let trucking fleets stream sensor data that cuts fuel burn 10-15% and elevates on-time performance on the Phnom Penh–Sihanoukville highway. Early adopters gained 12-18% productivity through dynamic rerouting, but fragmented owner-operator fleets struggle with hardware costs and digital skills. Government vouchers under the master plan aim to close the gap and spread benefits across the Cambodia freight and logistics market.
EU-Cambodia SAF Export Corridor Catalyzing Time-Critical Air Freight
Techo International Airport’s cargo terminal supports 200,000 tons a year, enabling 24- to 48-hour seafood and tropical fruit deliveries to European buyers subject to ReFuelEU’s 2% SAF blend mandate. Partnerships with carriers operating SAF-blended flights allow exporters to badge shipments as carbon neutral. Cambodia's aquaculture, bolstered by USD 41 million in 2024 financing, is installing traceability systems to unlock price premiums in sustainability-minded EU grocery chains.
Restraints Impact Analysis*
| Restraint | (~) % Impact on CAGR Forecast | Geographic Relevance | Impact Timeline |
|---|---|---|---|
| Shortage of licensed heavy-truck drivers escalating wage costs | –0.6% | Phnom Penh–Sihanoukville | Short term (≤ 2 years) |
| Fragmented ASYCUDA-CAMCONTROL customs systems extending dwell times | –0.7% | National gateways | Short term (≤ 2 years) |
| Seasonal Mekong & Tonle Sap water-level volatility hindering inland waterway reliability | –0.4% | Mekong River routes | Medium term (2-4 years) |
| Rising cyber-security risks in digital freight platforms discouraging SME on-boarding | –0.3% | Nationwide | Medium term (2-4 years) |
| Source: Mordor Intelligence | |||
Shortage of Licensed Heavy-Truck Drivers Escalating Wage Costs
An estimated 3,000-5,000 driver gap pushed monthly salaries to USD 600-800 in 2025, up from USD 400-500 two years earlier. Idle trucks and 25-30% turnover undermine fleet utilization, especially during harvest peaks. Cambodia's road-freight sector faces a shortage of licensed heavy-truck drivers, forcing transport firms to increase wages and benefits to retain workers, which raises supply chain costs. Additionally, long hours, daily-pay practices, heavy traffic, safety concerns, and corruption risks make the job less appealing[3]“Competition Assessment Reviews: Logistics Sector in Cambodia,” OECD, oecd.org.
Fragmented ASYCUDA-CAMCONTROL Customs Systems Extending Dwell Times
Parallel IT platforms require duplicate data entry and lengthen clearance to 4-5 days, versus 2-3 days at peer ports, adding USD 50-100 per-day storage charges. National single-window integration is delayed by funding and inter-agency rivalries. The ASYCUDA World system has reduced clearance times, but inefficiencies remain due to fragmented integration with CAMCONTROL. Traders and officials must often re-enter data, switch between workflows, and wait for one agency to process information already available to another[4]“Mekong River Water Level Monitoring,” Mekong River Commission, mrcmekong.org .
*Our forecasts treat driver/restraint impacts as directional, not additive. The impact forecasts reflect baseline growth, mix effects, and variable interactions.
Segment Analysis
By End User Industry: Manufacturing Logistics Requirements Intensify
Wholesale and retail trade anchored 34.04% of the Cambodia freight and logistics market size in 2025, but stabilizes as online shopping penetration plateaus. Manufacturing accelerates at 4.19% CAGR as electronics and EV parts require humidity-controlled stores and sub-1-day inventory cycles. Cambodia freight and logistics market operators must supply ISO-certified, ESD-safe facilities to win these accounts.
Agriculture, fishing, and forestry command only 2.2% yet capture disproportionate cold-chain investment tied to EU-bound seafood exports with stringent traceability mandates. Construction and extractives remain cyclical and project-driven.


By Logistics Function: CEP Momentum Outpaces Freight Transport
Freight transport contributed USD 0.86 billion, equal to 60.66% of the Cambodia freight and logistics market share in 2025, as garment and electronics exports moved chiefly by truck and container vessel. Yet growth moderates while shippers pivot to third-party orchestrators, driving a 12% jump in outsourced contracts. Courier, express, and parcel operators, ride e-commerce expansion and promise sub-48-hour delivery to Vietnam and Thailand, propelling a 4.85% CAGR to 2031. Warehousing splits between oversupplied ambient sheds and premium cold-chain capacity that fetches 30-50% higher rents. Freight forwarding benefits from RCEP paperwork complexity, while other value-added services enjoy a 4.76% CAGR as electronics assemblers seek kitting and postponement options within bonded zones.
Technology adoption remains uneven. International 3PLs deploy WMS and TMS platforms that synchronize with ASYCUDA World, but a long tail of domestic carriers still uses spreadsheets, limiting visibility. National Logistics Master Plan subsidies for telematics and warehouse automation are expected to spur consolidation as capitalized players scale.
By Destination Type: Cross-Border CEP Gains Momentum
Domestic CEP managed 64.05% market share in 2025, thanks to 78% smartphone penetration and urban e-commerce. International CEP posts a faster 5.02% CAGR as RCEP rules cut duties on mid-value parcels to Japan, Korea, and China. Express lanes at land borders and bonded airside warehouses will be crucial to sustain service-level agreements. International CEP is driven by Cambodia's role as an export manufacturing base, with electronics assemblers and garment manufacturers requiring express delivery of components, samples, and finished goods to customers and partners across ASEAN, East Asia, and beyond.
RCEP tariff eliminations and simplified customs procedures are reducing cross-border delivery times and costs, making international CEP more economically viable for mid-value shipments that previously moved via slower freight forwarding channels. However, the segment faces challenges from fragmented customs systems and inconsistent enforcement of cross-border e-commerce regulations, which create delays and unpredictability.
By Temperature Control: Cold-Chain Expands Beyond Seafood
Non-temperature-controlled storage retains 91.52% market share, yet commoditization erodes yields. The temperature-controlled slice is expected to grow at 3.96% CAGR (2026-2031) in seafood, pharma, and electronics, with humidity needs. A typical 5,000 m² cold store costs USD 2-3 million; international specialists are entering via JVs to meet demand in Kampong Chhnang and Pursat.
The segment's growth is also fueled by pharmaceutical cold-chain requirements, as Cambodia's healthcare sector expands and regulatory authorities enforce stricter temperature monitoring and documentation standards for vaccine and biologic storage. Electronics manufacturers, particularly those assembling moisture-sensitive components, require humidity-controlled warehousing at 40-60% relative humidity and 20-25°C, creating demand for specialized facilities that command premium rates 30-50% above ambient storage.
By Mode of Transport: Road Dominance Meets Rising Air Cargo
Road held 69.55% of market share in 2025, but driver shortages and fuel costs pressured margins. Telematics-enabled fleets slash empty-mile ratios, yet small owner-operators lag on adoption. Air freight’s 2.4% share is expected to climb at 4.94% CAGR, leveraging Techo Airport’s 200 kt capacity and SAF-linked green corridors. Sea and inland waterways account for 25.6%, though seasonal depth swings require dual-mode strategies. Rail revival remains long-term; pipelines serve niche fuel trades.
The road freight segment is undergoing a technology-driven transformation as 5G-enabled telematics systems optimize route planning, reduce fuel consumption by 10-15%, and improve asset utilization through dynamic load matching and backhaul optimization, Phnom Penh Post. However, adoption remains concentrated among larger 3PL operators, while the fragmented base of small family-run trucking firms which account for an estimated 60-70% of Cambodia's road freight capacity lacks capital and technical expertise to invest in telematics hardware and software subscriptions.
By Freight Forwarding: Compliance Platforms Drive Competitive Shifts
Sea and inland waterways comprised 73.14% of forwarding revenue in 2025, channeled through Sihanoukville’s expanding terminal and Mekong barges. The Cambodia freight and logistics market share of air forwarding is small yet growing 4.43% annually as Techo Airport enables cold-chain lanes to Europe. Forwarders with integrated customs APIs shave clearance times 20-30% and win bids from multinational factories that demand predictable lead times.
Carbon-reporting dashboards help electronics exporters satisfy ESG audits, though SAF price premiums confine uptake to high-margin produce. Others rail and pipeline remain negligible. Planned rail links to Thailand and Vietnam could seed multimodal contracts once interoperability issues and insurance standards are resolved.
Geography Analysis
Logistics activity concentrates within the Phnom Penh metropolitan cluster that captures 45-50% of the Cambodia freight and logistics market value. Sihanoukville follows at 25-30%, leveraging deep-water port upgrades targeting 1.4 million TEU by 2027. The new USD 1.9 billion expressway linking both cities drops transit to roughly two hours, spurring just-in-time inventory models and higher road-haulage frequency.
Bavet on the Vietnam border accounts for 10-15% as cross-border SEZs and electronics factories receive parts via road and re-export finished goods through Ho Chi Minh’s ports. Mekong River barges move 8.2 million tons of inland freight, anchoring river-port towns that support seafood flows into Vietnam.
Western nodes Battambang and Poipet capture 8-10% of trade volume, revitalised by the 2024 Thailand rail reconnection that promises modal diversity once customs sealing standards unify. Coastal provinces pursuing aquaculture expansion command roughly 5-7% and are the focus of Asian Development Bank cold-chain grants. The National Logistics Master Plan channels road, rail, and port spending toward secondary cities to de-risk Phnom Penh congestion and widen the Cambodia freight and logistics market footprint.
Competitive Landscape
Roughly 200-300 licensed operators compete, but digital capability sets tiers. Global 3PLs such as DSV, DHL, and Kuehne+Nagel integrate WMS, TMS, and IoT tracking, winning contracts requiring shipment visibility and ESG compliance. DSV’s USD 15.78 billion DB Schenker acquisition in April 2025 delivers global scale and resources to deploy advanced systems inside Cambodian bonded zones. Maersk–Hapag-Lloyd’s Gemini Cooperation pushes 90% schedule reliability that attracts apparel exporters seeking consistent cut-off times.
Domestic carriers remain asset-heavy and relationship-driven; most lack cybersecurity frameworks, discouraging multinational shippers. Digital freight marketplaces attempt to pool capacity, yet ransomware fears slow onboardings.
Cold-chain is an emerging battlefield as seafood exporters require -25 °C capability and HACCP certification. Consolidation is likely as telematics subsidies and bonded-zone incentives reward scale economies.
Cambodia Freight And Logistics Industry Leaders
DHL Group
DSV A/S (incl. DB Schenker)
A.P. Moller - Maersk
Cambodia Post (CP)
J&T Express
- *Disclaimer: Major Players sorted in no particular order

Recent Industry Developments
- January 2026: Cellcard and Smart Axiata commercially launched 5G services in Phnom Penh and Sihanoukville, unlocking low-latency telematics for fleet optimization.
- October 2025: Techo International Airport opened cargo facilities designed for 200 kt annual throughput, anchoring EU–Cambodia SAF export lanes.
- April 2025: DSV closed its USD 15.78 billion purchase of DB Schenker, creating a USD 44.47 billion-revenue logistics group poised to scale advanced WMS in Cambodia.
- February 2025: Maersk and Hapag-Lloyd formed the Gemini Cooperation, promising over 90% schedule reliability on East-West strings serving Cambodian exporters.


Research Methodology Framework and Report Scope
Market Definitions and Key Coverage
Our study defines the Cambodia freight and logistics market as every paid domestic or cross-border movement of goods, covering freight transport by road, rail, inland waterway, sea, and air, plus freight forwarding, courier-express-parcel, warehousing, and contract logistics services whose origin, transit point, or destination lies inside Cambodian territory.
Exclusion: passenger transport activities fall outside this scope.
Segmentation Overview
- End User Industry
- Agriculture, Fishing, and Forestry
- Construction
- Manufacturing
- Oil and Gas, Mining and Quarrying
- Wholesale and Retail Trade
- Others
- Logistics Function
- Courier, Express, and Parcel (CEP)
- By Destination Type
- Domestic
- International
- By Destination Type
- Freight Forwarding
- By Mode of Transport
- Air
- Sea and Inland Waterways
- Others
- By Mode of Transport
- Freight Transport
- By Mode of Transport
- Air
- Pipelines
- Rail
- Road
- Sea and Inland Waterways
- By Mode of Transport
- Warehousing and Storage
- By Temperature Control
- Non-Temperature Controlled
- Temperature Controlled
- By Temperature Control
- Other Services
- Courier, Express, and Parcel (CEP)
Detailed Research Methodology and Data Validation
Primary Research
Mordor analysts supplemented desk findings through in-depth calls with Cambodian trucking fleets, third-party logistics providers, garment exporters, and warehouse developers operating in Phnom Penh, Sihanoukville, Poipet, and Bavet. These conversations verified prevailing rate cards, seasonality patterns, and utilization thresholds, and they highlighted emerging demand pockets such as SEZ-linked cross-docking solutions.
Desk Research
We began with publicly available macro and sector data from the National Institute of Statistics, the Ministry of Public Works and Transport, the General Department of Customs and Excise, World Bank trade dashboards, the ASEAN Freight Transport Working Group, and UNCTAD maritime statistics. Company filings, port authority annual reports, reputable news captured via Dow Jones Factiva, and financial snapshots from D&B Hoovers added micro-level context. These sources establish historical volumes, tariff benchmarks, fleet additions, and policy milestones that anchor the model. The list above is illustrative; many additional documents were consulted for clarification and data validation.
Market-Sizing and Forecasting
A top-down demand-pool build starts with Cambodia's freight expenditure share of GDP, adjusted by detailed merchandise trade, manufacturing output, and e-commerce parcel counts. Results are then cross-checked through selective bottom-up roll-ups that multiply sampled average selling prices by road tonnage, TEU throughput, and CEP parcel volumes gathered during interviews. Key variables include garment export growth, fuel price trends, logistics-cost-to-GDP ratio shifts, port capacity additions, and warehouse absorption rates. Forecasts to 2030 deploy multivariate regression supported by ARIMA smoothing to capture cyclical trade swings while honoring expert consensus on infrastructure delivery timelines. Where primary data gaps appear, regional proxies are scaled using per-capita income and modal share differentials.
Data Validation and Update Cycle
Iterative cross-checks compare model outputs with independent indicators such as container calls, diesel sales, and customs duty receipts. Variances trigger peer review among analysts before sign-off. The report is refreshed every twelve months, with interim updates when material policy or capacity events occur, ensuring clients receive the latest calibrated view.
Why Mordor's Cambodia Freight and Logistics Baseline Earns Decision-Maker Trust
Published estimates often diverge because firms pick different service mixes, currency bases, and refresh cadences.
Key Gap Drivers include whether postal services are folded into freight, how unofficial fees are treated, and if figures are converted to constant or current dollars before inflation adjustments.
Benchmark comparison
| Market Size | Anonymized source | Primary gap driver |
|---|---|---|
| USD 1.41 B (2025) | Mordor Intelligence | - |
| USD 1.82 B (2024) | Global Consultancy A | Broader scope bundles postal and last-mile retail delivery, limited cross-checks on tariff declines |
| USD 1.91 B (2025) | Industry Association B | Relies on announced project values and assumes full spend realization without operator interviews |
| USD 2.78 B (2022) | Trade Journal C | Includes downstream distribution costs and quotes in constant 2020 dollars with no inflation conversion |
The comparison shows that when service boundaries, inflation treatment, and verification depth vary, headline values swing widely. By aligning scope tightly to paid freight activities and employing transparent variable tracking that is revisited every year, Mordor Intelligence provides a balanced, repeatable baseline that decision-makers can rely on.


Key Questions Answered in the Report
How fast will Cambodia’s freight and logistics grow through 2031?
Value is projected to rise from USD 2.27 billion in 2026 to USD 2.74 billion by 2031 at a 3.88% CAGR.
Which logistics function leads demand today?
Freight transport holds the largest 60.66% revenue share, driven by containerized garment and electronics exports.
What is driving air-cargo expansion?
Techo International Airport’s new 200 kt facility and EU-focused SAF corridors underpin a 4.94% CAGR for air freight.
Where are cold-chain investments concentrated?
Phnom Penh, Sihanoukville, Kampong Chhnang, and Pursat host most temperature-controlled projects linked to aquaculture and pharma.
How does RCEP reshape Cambodia’s trade flows?
Zero-tariff access to 14 partner markets boosts container throughput and pushes forwarders to upgrade digital customs compliance.
Page last updated on:


