
Market Overview
| Study Period | 2021 - 2031 |
|---|---|
| Forecast Data Period | 2026 - 2031 |
| Base Year Market Size (2025) | USD 2.91 Billion |
| Market Size (2026) | USD 3.17 Billion |
| Market Size (2031) | USD 4.86 Billion |
| Growth Rate (2026 - 2031) | 8.92 % |
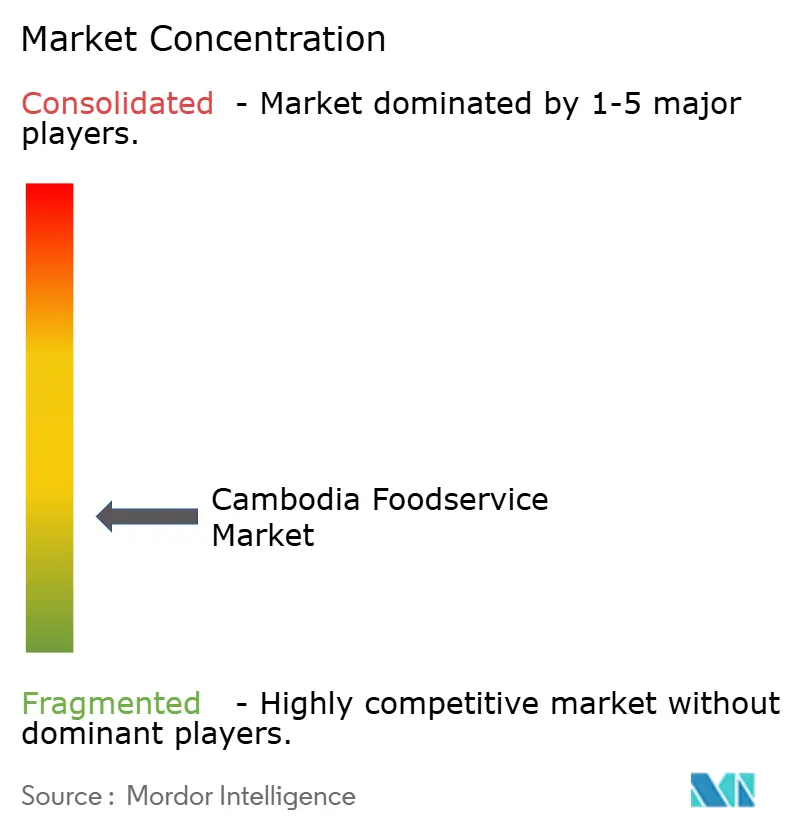
| Market Concentration | Low |
Major Players *Disclaimer: Major Players sorted in no particular order Image © Mordor Intelligence. Reuse requires attribution under CC BY 4.0. | |
Cambodia Foodservice Market Analysis by Mordor Intelligence
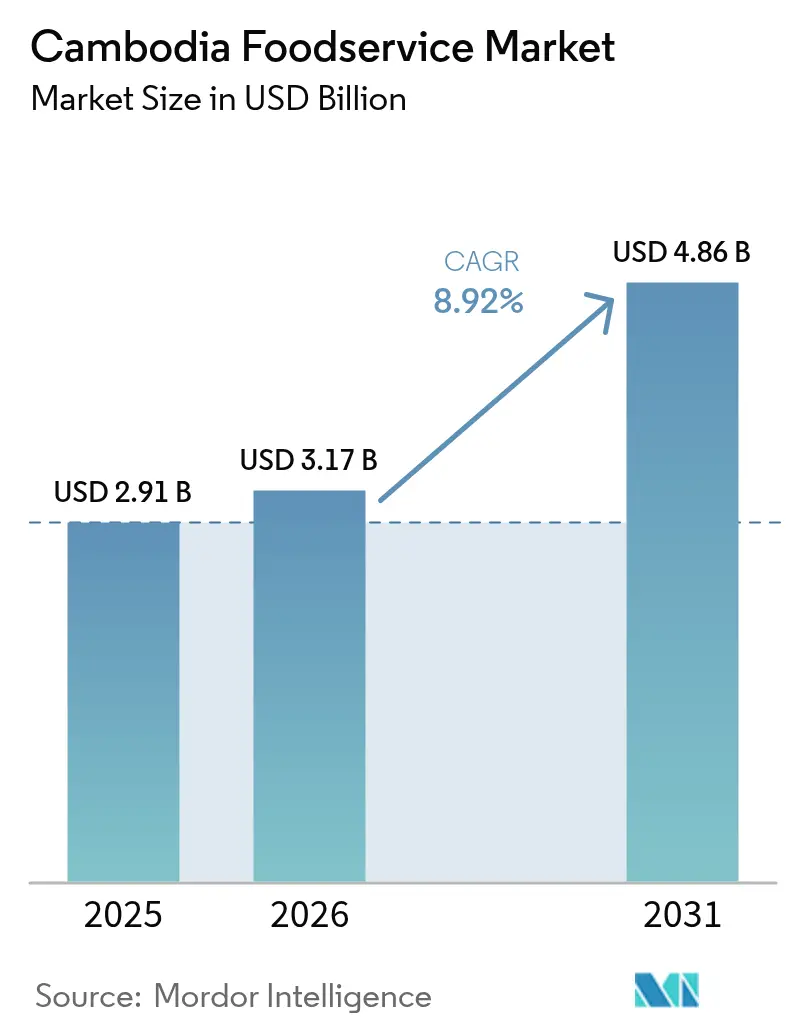
The Cambodia foodservice market size is projected to be USD 2.91 billion in 2025, USD 3.17 billion in 2026, and reach USD 4.86 billion by 2031, growing at a CAGR of 8.92% from 2026 to 2031. The expansion is tied to a rebound in domestic travel that offset a 17% fall in international arrivals after the mid-2025 border incident; operators responded by pivoting menus toward local preferences and adjusting price points for subdued GDP growth of 4.8% in 2025 and 4.0% in 2026. Technology adoption advanced as the Bakong real-time payment network reached 1.325 billion transactions in 2025, cutting cash-handling costs and enabling data-driven inventory control. Meanwhile, master franchisees accelerated rollouts in secondary cities using capital-light, co-location models that reduce rental exposure, and malls such as AEON Mall 3 Mean Chey created climate-controlled hubs that shield tenants from Cambodia’s unreliable grid power.
Key Report Takeaways
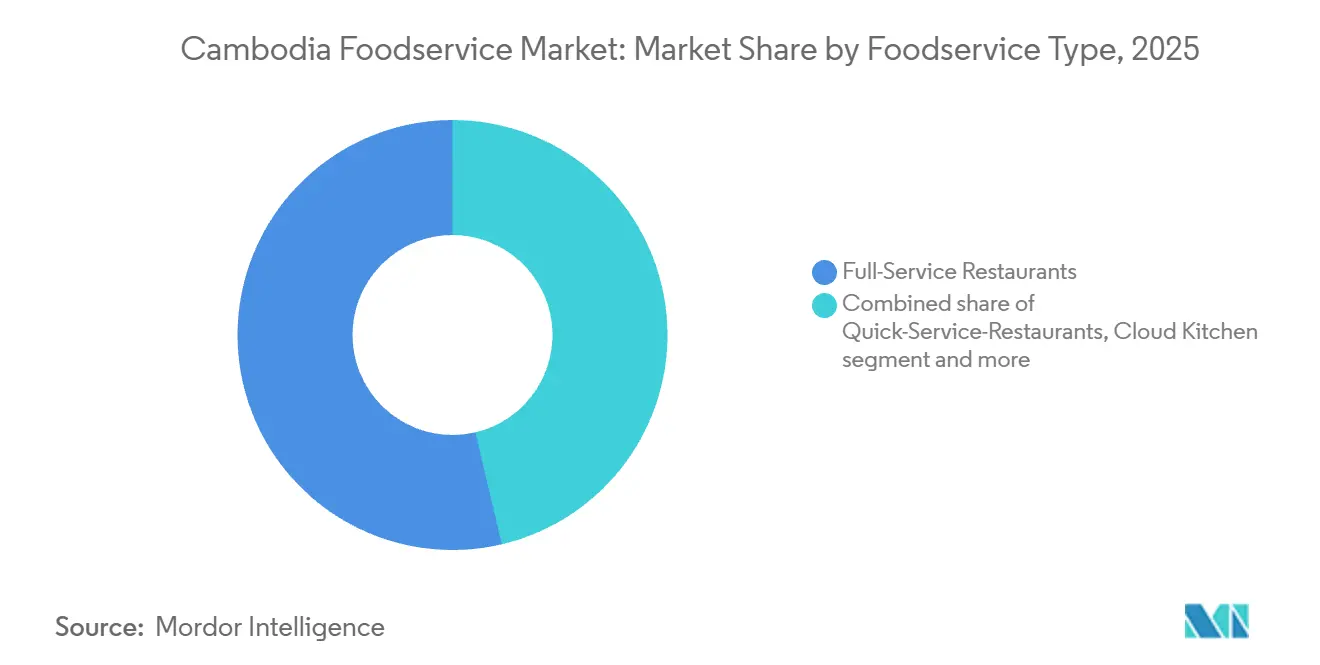
- By food service type, full-service restaurants held 53.68% of the Cambodia food service market share in 2025, while cloud kitchens are set to post a 9.07% CAGR through 2031.
- By outlet, independents controlled 75.62% of value in 2025; chained outlets are projected to compound at 10.45% annually to 2031.
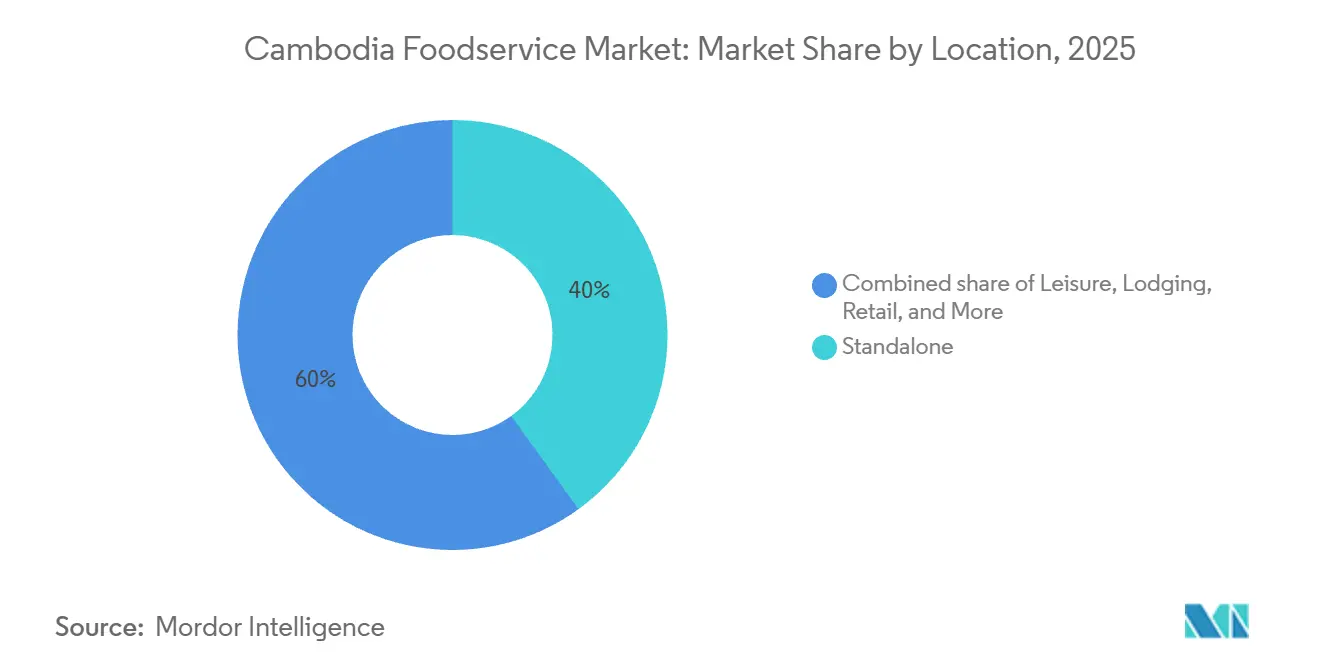
- By location, standalone controlled 40.03% of value in 2025; retail is projected to compound at 10.02% annually to 2031.
- By service type, dine-in accounted for 56.88% of revenue in 2025, whereas delivery is forecast to accelerate at 11.23% CAGR during the outlook period.
Note: Market size and forecast figures in this report are generated using Mordor Intelligence’s proprietary estimation framework, updated with the latest available data and insights as of 2026.
Market Trends and Insights
Drivers Impact Analysis of Cambodia Foodservice Market*
| Drivers | (~) % Impact on CAGR Forecast | Geographic Relevance | Impact Timeline |
|---|---|---|---|
| Tourism and hospitality growth | +2.0% | National, with concentration in Phnom Penh, Siem Reap, Sihanoukville | Medium term (2-4 years) |
| Rise of international chains | +1.5% | National, with early gains in Phnom Penh, expanding to Battambang, Kampot | Medium term (2-4 years) |
| Growing use of online food delivery apps and platforms | +1.8% | National, with dominance in Phnom Penh, Siem Reap | Short term (≤ 2 years) |
| Proliferation of cafes and specialty shops as social hubs | +0.8% | Urban centers: Phnom Penh, Siem Reap | Medium term (2-4 years) |
| Technology integration in restaurants | +1.0% | National, led by Phnom Penh adoption | Short term (≤ 2 years) |
| Rising interest in healthy, organic, vegan, and functional foods | +0.9% | Urban affluent segments in Phnom Penh, Siem Reap | Long term (≥ 4 years) |
| Source: Mordor Intelligence | |||
Tourism and Hospitality Growth
In 2024, Cambodia attracted 6.7 million international tourists, a 22.9% increase compared to 2023 [1]. This growth generated USD 3.63 billion in revenue and contributed 9.4% to the country’s GDP. However, a border conflict with Thailand in July 2025 caused a 17% drop in tourist arrivals, reducing the number to 5.5 million. To adapt, operators shifted their focus to domestic travelers, whose numbers rose by 64.7% between May and October 2025. This shift highlights the importance of balancing international standards with affordable options for local tourists. Siem Reap, which relies heavily on Angkor Wat tourism, showed mixed results in a June 2024 survey. About 31.4% of operators reported positive impacts, another 31.4% noted negative effects, and 37.3% observed no change, indicating uneven visitor spending. The opening of Techo International Airport on September 9, 2025, with Malis Restaurant as a tenant and Lagardère Travel Retail securing a 12-year concession on June 27, 2024, positions Phnom Penh as a secondary gateway. This development could shift some tourist traffic away from Siem Reap. In 2024, the top source markets were Thailand, Vietnam, China, Laos, and the United States. This suggests that strategies like menu localization and halal certification could help attract more tourists from ASEAN and Middle Eastern countries.
Rise of International Chains
Master franchisees are using capital-light expansion strategies to grow their presence. For example, Express Food Group signed a 10-year agreement in March 2022 to combine Swensen's and The Pizza Company formats. They opened outlets at Kampuchea Krom on March 8, 2022, and a premium Swensen's at AEON Mean Chey Mall in December 2022. EFG plans to more than double the number of Swensen's stores in the next few years across Cambodia, Laos, and Myanmar. Little Caesars announced its entry into the market on November 2, 2024, through World Bridge Group, with plans to open 20 to 25 locations. Similarly, Marrybrown, a Malaysian halal QSR, signed a memorandum of understanding in June 2024 with SP QSR and Food Services Co. Ltd. to open over 30 outlets in Cambodia and Uzbekistan within five years, prioritizing the first location in Phnom Penh. McDonald's held exploratory meetings in November 2025, indicating potential entry into one of Asia's last untapped markets. Jollibee Foods Corporation plans to open 700 to 800 new stores globally in 2025, though it has not disclosed specific plans for Cambodia. CJ Foodville's Tous les Jours signed a master franchise agreement with Express Food Group on April 29, 2024. By mid-2024, they opened two stores near Royal University and a traditional market, with a goal of reaching five stores by the end of the year. This highlights the growing popularity of bakery-café hybrids in high-traffic areas.
Growing Use of Online Food Delivery Apps and Platforms
Grab's acquisition of Nham24, approved by regulators in January 2025 after its announcement in December 2024, integrated over 950 merchants and more than 200 delivery partners primarily based in Phnom Penh and Siem Reap. This acquisition introduced batching technology and AI-driven route optimization, which reduced commission rates and enhanced order density. In a regional context, Grab held the majority share of Southeast Asia's food delivery market in 2025, followed by ShopeeFood, indicating that Cambodia's market penetration remains less developed compared to Thailand or Vietnam. In August 2024, Nham24 had entered into a memorandum of understanding with Express Food Group to expand merchant onboarding, a partnership now incorporated into Grab's broader aggregator strategy. Additionally, the Bakong Tourists App, launched in November 2024 with Mastercard and Visa integration, allows foreign visitors to make transactions via KHQR without requiring local bank accounts[2]. This reduces barriers for international tourists placing delivery orders while staying in serviced apartments or hotels. Cloud kitchens have particularly benefited from the growth in delivery services, as their setup costs range from 50,000 to 150,000 Malaysian ringgit, significantly lower than the 500,000 to 1 million ringgit required for traditional restaurants in comparable Southeast Asian markets. This cost advantage enables operators to experiment with multiple virtual brands while minimizing capital expenditure.
Rising Interest in Healthy, Organic, Vegan, and Functional Foods
In 2024, Phnom Penh became a popular destination for vegan dining, with an increasing number of vegetarian and vegan restaurants. Key establishments include Vibe Cafe, the city's first fully vegan restaurant, which offers superfood-based dishes and donates 10% of its profits to the Good Vibe Foundation. Another notable venue is Sacred Lotus Cafe, which combines a vegan menu with hostel accommodations and offers USD 1 plant-based coffees on Tuesdays. Traditional Khmer dishes are being adapted to suit wellness trends, such as Amok made with tofu, Lok Lak with mushrooms, and Nom Banh Chok served with plant-based toppings. These adaptations maintain the essence of Khmer cuisine while appealing to modern dietary preferences. Fine-dining restaurants like Topaz (French), Le Malis, Siena (Italian), Khéma, and Raffles now clearly mark vegan options on their menus. Prices range from USD 5 to USD 12 for casual dining, USD 10 to USD 18 for mid-range options, and USD 25 to USD 30 or more for luxury dining, showing that expatriates and affluent Cambodians are willing to pay for these offerings.
Restraints Impact Analysis of Cambodia Foodservice Market*
| Restraints | (~) % Impact on CAGR Forecast | Geographic Relevance | Impact Timeline |
|---|---|---|---|
| Stringent regulatory compliance | -0.5% | National, with enforcement concentrated in Phnom Penh, Siem Reap | Medium term (2-4 years) |
| Weak cold chain and logistics infrastructure | -1.2% | National, with 60% capacity in Phnom Penh, Sihanoukville | Long term (≥ 4 years) |
| Skilled labor shortage | -0.8% | National, acute in hospitality hubs | Medium term (2-4 years) |
| Food-commodity price volatility and shrink-flation risk | -1.0% | National, with rural impact on purchasing power | Short term (≤ 2 years) |
| Source: Mordor Intelligence | |||
Food-Commodity Price Volatility and Shrink-Flation Risk
Fluctuating food prices and the risk of shrinkflation are significant challenges for Cambodia's food service market, impacting cost control and customer satisfaction. The National Institute of Statistics reported that from April 2023 to March 2024, pork and beef prices rose by 0.4%, while chicken prices increased by 0.3%, resulting in a 0.3% overall rise in the meat category[3]. These price changes directly affect foodservice providers who depend on these essential ingredients. Small independent operators with limited profit margins often face difficult decisions, such as raising menu prices or accepting reduced profits. Some try to manage costs by reducing portion sizes while keeping prices the same, a practice known as shrinkflation, but this can harm customer trust and damage their brand reputation. In Cambodia's competitive market, where customers have many dining options and expect high quality, any drop in perceived value can discourage repeat visits. Additionally, operators face the challenge of maintaining food quality and service standards while managing rising costs.
Weak Cold Chain and Logistics Infrastructure
Cambodia's cold-chain market is primarily concentrated in Phnom Penh and Sihanoukville, accounting for over 60% of its capacity. This leaves operators in other provinces dependent on ambient storage or expensive long-distance refrigerated transport, with only about 40 refrigerated transport units available nationwide. Energy costs make up 38% of cold-storage operational budgets, as diesel generators are often used to compensate for unreliable electricity supply. Additionally, 45% of companies face difficulties in finding skilled technicians to maintain compressor systems and monitor temperature logs. As a result, businesses relying on perishable goods, such as sushi bars or gelato shops, are mostly limited to the capital or face higher spoilage rates. The Global Cold Chain Alliance has highlighted major gaps in Cambodia's cold-chain infrastructure, including inadequate pre-cooling, blast freezing, and last-mile refrigerated delivery. These issues are particularly challenging for seafood and dairy imports, which must clear customs in Sihanoukville and travel 230 kilometers to Phnom Penh. This weak infrastructure benefits shelf-stable and ambient-temperature foods, like stir-fries and grilled meats, over Western-style dishes that depend on chilled proteins and frozen desserts. Food safety enforcement is managed by the Ministry of Commerce in coordination with five other ministries. However, cold-chain compliance receives less attention compared to labeling and hygiene standards, creating a regulatory gap. This lack of oversight increases the risk of foodborne illnesses, which could harm consumer trust in the market.
*Our forecasts treat driver/restraint impacts as directional, not additive. The impact forecasts reflect baseline growth, mix effects, and variable interactions.
Cambodia Foodservice Market Segment Analysis
By Foodservice Type:
Cloud Kitchens Accelerate Digital ShiftFull-Service Restaurants accounted for 53.68% of the market share in 2025, reflecting Cambodia's family-oriented dining culture. This culture is characterized by hierarchical seating arrangements, communal condiment trays, and multi-course shared meals. Casual dining and fine dining each represented 33.1% of operator types, according to a June 2024 survey of 118 companies managing over 400 restaurants. Western cuisine dominated 51.7% of menus, followed by Asian at 28.8%, fusion at 13.6%, and Cambodian at 8.5%. This highlights a potential opportunity for heritage-focused concepts that utilize local ingredients such as prahok (fermented fish paste) and Kampot pepper. Fine-dining establishments like Embassy, led by Chef Kimsan Pol, offer set dinners priced between USD 54 and USD 100. Cuts features a price range from USD 10 to USD 800, while Malis spans USD 8 to USD 35, showcasing price stratification that appeals to both expatriate expense accounts and affluent Cambodian celebrations.
Cloud Kitchens are projected to grow at a compound annual growth rate (CAGR) of 9.07% during 2026-2031, making them the fastest-growing segment among all foodservice types. This growth is driven by the delivery segment's 11.23% CAGR and Grab's integration of Nham24's network of over 950 merchants into a single AI-driven logistics platform. In comparable Southeast Asian markets, cloud kitchen setup costs range from 50,000 to 150,000 Malaysian ringgit, significantly lower than the 500,000 to 1 million ringgit required for traditional restaurants. This cost efficiency enables operators to experiment with multiple virtual brands and adapt menus based on real-time order data. The COVID-19 pandemic accelerated the adoption of cloud kitchens across Southeast Asia, with platforms like Grab, Foodpanda, and Gojek introducing cloud-kitchen enablement services. In Cambodia, the relatively low penetration of cloud kitchens suggests significant growth potential as smartphone ownership and digital payment infrastructure continue to develop.

By Outlet:
Chains Pursue Franchise ExpansionIndependent outlets account for 75.62% of Cambodia's food service market as of 2025. Their dominance is attributed to their alignment with local tastes and cultural preferences. These establishments emphasize traditional Cambodian cuisine, sourcing local ingredients, and offering competitive pricing that appeals to domestic consumers. Their adaptability in menu offerings and strong community ties enable them to respond effectively to evolving consumer demands, including the rising interest in healthy and sustainable food options. Additionally, independent food service businesses have expanded their reach by partnering with local delivery platforms, moving beyond traditional dine-in services.
Chained outlets, while holding a smaller market share, exhibit significant growth with a CAGR of 10.45%. These outlets attract customers by offering standardized food quality, strict hygiene protocols, and consistent service, which particularly appeal to urban and tech-savvy consumers seeking reliability. Global and regional brands are expanding their presence through franchise and partnership models. For example, in June 2024, Malaysian halal-certified QSR chain Marrybrown entered Cambodia via a Memorandum of Understanding with SP QSR and Food Services Co. Ltd, targeting the growing halal food and fast food segments in the country. Similarly, CJ Foodville's Tous les Jours signed a master franchise agreement with Express Food Group on April 29, 2024. By mid-2024, the brand opened two stores near the Royal University and a traditional market, with plans to establish five stores by the end of the year, showcasing the potential of bakery-café hybrids in high-traffic areas.
By Location:
Malls Anchor Retail GrowthIn 2025, standalone locations accounted for 40.03% of outlets in Cambodia, reflecting the country's preference for street-facing restaurants. These locations rely on visibility, pedestrian traffic, and proximity to residential areas to attract customers. Standalone outlets benefit from flexible hours, direct street access for takeout and delivery, and the ability to modify facades and signage without landlord approval. These features are especially useful for late-night operations and motorbike-focused concepts. Leisure locations, such as entertainment complexes, and travel hubs, like airports, serve captive audiences but face higher rents and revenue-sharing agreements. Lodging locations, including hotel restaurants and in-room dining, attract business travelers and tourists but depend heavily on occupancy rates and see low repeat visits.
Retail locations are expected to grow at a 10.02% CAGR from 2026 to 2031, the fastest among location types. This growth is driven by AEON Mall's three properties, which offer a combined gross leasable area of 251,000 square meters. AEON Mall 1, opened in 2014, spans 68,000 square meters with 1,850 parking spaces. AEON Mall 2 Sen Sok, launched in 2018, provides 85,000 square meters and 2,300 parking spaces. AEON Mall 3 Mean Chey, which opened in December 2022, features 98,000 square meters, 4,000 parking spaces, and a USD 289.6 million investment. Phnom Penh has 21 shopping malls covering 337,400 square meters, with rents ranging from USD 20 to USD 27 per square meter monthly. AEON Mall 1 attracts 6 to 10 million visitors annually, offering food-court and inline restaurant tenants guaranteed foot traffic and climate-controlled environments.
By Service Type:
Delivery Surges Post-PandemicIn 2025, dine-in services led with a 56.88% market share, reflecting Cambodia's strong social dining culture. Meals are often shared family-style, with the eldest eating first and communal condiment trays featuring items like chili jam and prahok with peanuts. Free tea is common, and toothpicks are used at the table. Spoons and forks are the main utensils, while chopsticks are used for soups and noodles. Cultural norms like slurping and lip-smacking make dining informal, reducing the appeal of takeaway. Fish Amok, the national dish, and high rice consumption of 250 kilograms per capita annually highlight the preference for fresh, staple-heavy meals. A June 2024 survey showed casual and fine dining each accounted for 33.1% of operators. Fine-dining venues like Embassy and Malis, offering set dinners priced at USD 54–100, emphasize experiences unsuitable for delivery.
Delivery services are projected to grow at an 11.23% CAGR from 2026 to 2031, driven by Grab's acquisition of Nham24 in December 2024. This move integrated over 950 merchants and 200 delivery partners in Phnom Penh and Siem Reap under an AI-driven platform, reducing costs and improving efficiency. Grab held 55% of Southeast Asia's food delivery market in 2025, while the region's gross merchandise value rose 18% year-over-year to USD 22.7 billion. Cambodia's delivery market remains underdeveloped compared to Thailand and Vietnam. The Bakong payment system processed 1.325 billion transactions in 2025, easing cash-on-delivery issues and enabling seamless tracking. The Bakong Tourists App, launched in November 2024, allows foreign visitors to pay via KHQR codes, expanding the delivery market. Takeaway services, while faster and cheaper, lack the convenience of delivery and the ambiance of dine-in, making them vulnerable as delivery infrastructure improves.
Geography Analysis
Phnom Penh and Siem Reap, Cambodia's bustling urban centers, dominate the country's food service market. These cities, bolstered by dense populations, thriving tourism industries, and robust infrastructure, cater to a diverse range of foodservice formats. From full-service restaurants and cloud kitchens to international chains, the culinary scene is vibrant. The blend of local residents, expatriates, and tourists fuels a robust demand for both local and global cuisines, positioning these cities as pivotal players in the market's growth.
In Siem Reap, a June 2024 survey highlighted the mixed effects of tourism: 31.4% of operators felt positive impacts, another 31.4% faced negatives, and 37.3% remained neutral. This underscores the sector's sensitivity to the ebb and flow of visitor spending. In 2024, Cambodia rolled out the red carpet for 6.7 million international tourists, marking a 22.9% surge from 2023. This influx not only generated a hefty USD 3.63 billion but also accounted for a notable 9.4% of the nation's GDP. Yet, a border spat with Thailand in July 2025 saw arrivals dip by 17%, settling at 5.5 million. On a brighter note, domestic tourism surged by 64.7% from May to October 2025, showcasing the industry's resilience. Key international markets in 2024 spanned Thailand, Vietnam, China, Laos, and the U.S. To further entice ASEAN and Middle Eastern tourists, operators are eyeing localized menus and halal certifications. While Kampot and Kep, celebrated for their crab and pepper, beckon heritage-focused ventures, Sihanoukville's casino surge has lured Chinese investments, stirring concerns for traditional hospitality.
AEON Mall's trio of Phnom Penh locations, boasting a combined 251,000 square meters of leasable space, are pivotal in propelling the retail foodservice sector. AEON Mall 1, a crowd favorite, draws between 6 to 10 million visitors each year. Meanwhile, the newly inaugurated AEON Mall 3 Mean Chey, which opened its doors in December 2022 with a hefty USD 289.6 million investment, spans 98,000 square meters and boasts 4,000 parking slots. Monthly rental rates hover between USD 20 to USD 27 per square meter. Notably, KFC stands out as a primary tenant, and at the recently launched PH Eco Mall (July 2022), Express Food Group showcases brands like Swensen’s, The Pizza Company, and Krispy Kreme. The Ministry of Commerce, under the 2022 Law on Food Safety, mandates Khmer labeling and inspections to uphold food safety standards. Yet, challenges loom: cold-chain compliance remains tenuous, heightening the risk of foodborne ailments.
Regulatory Landscape
Cambodia’s foodservice operators and suppliers work within the 2022 Law on Food Safety (promulgated June 8, 2022), which sets the national framework for food safety, quality, and hygiene across the chain. The Ministry of Commerce (MoC), through the Consumer Protection, Competition and Fraud Repression Directorate-General (CCF), coordinates food quality and safety management, with enforcement extending into day-to-day restaurant procurement through requirements on labeling, inspection, and fraud prevention.
For packaged and imported inputs used by restaurants (processed foods, beverages, and specialty ingredients), pre-packaged goods require Khmer-language labeling, with the general rules anchored in Industrial Standards of Cambodia (CS 001-2000) and additional nutritional labeling requirements formalized via Prakas 0059 and 0064. Importers typically face multi-agency procedures, including pre-arrival assessment authorization from the CCF and health certificates from the Ministry of Health’s Department of Food and Drugs, while tariff and origin certainty can be pursued via binding advance rulings from the General Department of Customs and Excise (GDCE). Imported food and beverage items commonly face MFN tariffs (often 7-35%) plus a 10% VAT, with additional specific taxes applying to alcoholic beverages.
Competitive Landscape
The Cambodia foodservice market exhibits a fragmented competitive structure, characterized by the presence of numerous small and independent operators alongside a limited number of regional and international chains. Independent operators dominate the market share, primarily offering traditional cuisine and authentic dining experiences. These establishments maintain strong customer relationships through cultural authenticity and localized service delivery mechanisms.
International franchise establishments are systematically expanding their market presence through structured expansion strategies. These operators implement standardized operational protocols and global menu offerings, specifically targeting urban populations, younger demographics, and expatriate communities. Key market participants include Yum! Brands Inc., Restaurant Brands International Inc., and Starbucks Corporation each maintain distinct market positioning strategies.
The market structure facilitates multiple operational models, enabling various business formats to establish viable market positions. This diversity manifests through differentiated service offerings, pricing strategies, and target market approaches. The competitive environment supports both large-scale standardized operations and specialized niche market participants.
Cambodia Foodservice Industry Leaders
-
Yum! Brands Inc.
-
Restaurant Brands International Inc.
-
Starbucks Corporation
-
Minor International PLC (The Pizza Company)
-
Domino’s Pizza Inc.
- *Disclaimer: Major Players sorted in no particular order
Cambodia Foodservice Market Companies Covered in this Report
- Yum! Brands Inc.
- Restaurant Brands International Inc.
- Starbucks Corporation
- Minor International PLC (The Pizza Company)
- Thalias Co. Ltd
- Domino's Pizza Inc.
- Berkshire Hathaway Inc. (Dairy Queen)
- Alsea SAB de CV
- CKE Restaurants Holdings Inc. (Carl's Jr.)
- Papa John's International Inc.
- Jollibee Foods Corporation
- Lotteria Co. Ltd
- Foodpanda (Delivery Hero SE)
- Texas Chicken (Church's)
- Krispy Kreme Doughnut Corp.
- Subway IP LLC
- Gong Cha Group
- KOI The
- Brown Coffee & Bakery Co. Ltd
- GrabFood (Grab Holdings Ltd)
Market Opportunities and Future Outlook
Payment rails, delivery logistics, and POS connectivity are creating operational whitespace for both chains and independents looking to scale beyond Phnom Penh and Siem Reap. Cambodia’s Bakong real-time payment network processed 1.325 billion transactions in 2025, and the Bakong Tourists App (launched November 2024 with Mastercard and Visa integration) reduces friction for tourists paying via KHQR, supporting higher conversion across delivery, takeaway, and quick-service use cases. In March 2026, Grab and T.O Group announced a partnership to integrate GrabFood orders with T.O Group’s POS platform, which supports automation of order injection, menu syncing, and store-level reporting, making multi-outlet operations and standardized execution more feasible for emerging chains and franchisees.
Upstream capacity and licensing reforms also tie back to supply consistency and menu localization. In April 2026, Guanshen Shengda Agriculture Industry Co., Ltd. broke ground on a USD 20 million cassava starch processing plant in Kampong Speu, and in June 2026 Royal Group Phnom Penh SEZ Plc. and Kampong Thom Provincial Administration signed a joint venture to develop the Kampong Thom Agro-Processing Special Economic Zone, reinforcing a shift toward domestic processing that can broaden locally available ingredients for operators. At the same time, the Ministry of Economy and Finance has launched a study on business permitting and licensing, prioritizing food and beverage processing alongside agriculture and tourism, while its May 2026 decision to prohibit prize promotions on sugary drinks, energy drinks, and alcoholic products (effective October 1, 2026) points to tighter oversight of beverage marketing that brands and restaurant partners need to incorporate into campaign planning and channel strategy.
Recent Industry Developments in Cambodia Foodservice Market
- May 2026: TPC Pizza (The Pizza Cambodia) launched on May 15, 2026 and opened 11 initial locations in Phnom Penh, replacing The Pizza Company franchise branding amid consumer pressure on Thai-linked brands. The move shifted a major pizza footprint toward a locally positioned identity, with menu and branding control used to defend traffic and rebuild loyalty. It also reset competitive dynamics for QSR pizza by demonstrating a rapid, multi-site rebrand playbook.
- April 2026: Express Food Group (EFG) Cambodia moved under Singapore-based Palms Food International Pte. Ltd., aligning the business for regional investment and expansion. The ownership change supported a transition toward stronger local operating control and the development of in-house concepts alongside franchised formats. For the market, it raises the bar on execution capabilities among master franchisees competing for mall and high-footfall sites.
- January 2025: Regulators approved Grab’s acquisition of Nham24 after the deal was announced in December 2024, integrating more than 950 merchants and over 200 delivery partners concentrated in Phnom Penh and Siem Reap. The consolidation strengthened platform scale and enabled wider deployment of batching and AI-driven route optimization to improve unit economics. This increased the importance of aggregator relationships for restaurants, particularly cloud kitchens and delivery-forward brands.
Cambodia Foodservice Market Report Scope and Research Methodology
Market Definition and Coverage
This market is defined as the value of prepared food and beverages sold for immediate consumption in Cambodia through foodservice outlets, including dine-in, takeaway, and home delivery where it is an outlet-led foodservice sale.
Scope exclusions: Excludes at-home cooking and grocery retail food sales that are not prepared and sold as a foodservice occasion.
Segments Covered in This Report
- Foodservice Type
- Cafes and Bars
- By Cuisine
- Bars and Pubs
- Cafes
- Juice/Smoothie/Desserts Bars
- Specialist Coffee and Tea Shops
- By Cuisine
- Cloud Kitchen
- Full Service Restaurants
- By Cuisine
- Asian
- European
- Latin American
- Middle Eastern
- North American
- Other FSR Cuisines
- By Cuisine
- Quick Service Restaurants
- By Cuisine
- Bakeries
- Burger
- Ice Cream
- Meat-based Cuisines
- Pizza
- Other QSR Cuisines
- By Cuisine
- Cafes and Bars
- Outlet
- Chained Outlets
- Independent Outlets
- Location
- Leisure
- Lodging
- Retail
- Standalone
- Travel
- Service Type
- Dine-in
- Takeaway
- Delivery
Data Sources, Market Sizing, and Validation
Desk Research
Desk work started with building a clean fact base for Cambodia, where public data can be uneven across provinces and outlet types. We used sources such as the Cambodia Ministry of Tourism visitor statistics, the National Institute of Statistics (CSES and price series), and the National Bank of Cambodia releases to understand spending capacity and currency conditions.
To anchor outlet activity, we also checked sources such as UN Comtrade trade flows for food inputs and packaging proxies, World Bank macro indicators, and FAO food balance style statistics for demand direction. These were supported with company annual reports and investor decks for operators and suppliers active in restaurant and delivery ecosystems, along with credible local and regional press for store openings and format shifts. For hard-to-find company signals and patent-related inputs, a paid subscription for company financials and a patent database were used only as supporting inputs. This list is illustrative, and many other public sources were also reviewed for cross-checking and clarification.
Primary Interviews and Surveys
Interviews and surveys with Cambodian restaurant operators, outlet managers, suppliers, delivery specialists, and tourism-facing foodservice experts test outlet counts, sales ranges, price changes, and recovery timing. We compare responses with desk evidence, re-contact respondents when a material gap appears, and use the findings to adjust assumptions and triangulate the final estimate.
Distribution of primary research fieldwork respondents
| Company type | Respondent position |
|---|---|
| Top tier: 28% | CXOs: 16% |
| Mid tier: 50% | Functional/Unit leaders: 32% |
| Smaller Players: 22% | Managers: 52% |
Market-Sizing & Forecasting
Sizing used a top-down build where national eating-out spend was reconstructed using income and inflation direction, tourism and domestic travel signals, and the observed shift between dine-in and delivery occasions. The total was then allocated into foodservice activity types using indicator splits such as outlet count growth in key cities, average check movement, order frequency trends, and the mix shift toward fast food and street stall formats.
To keep totals realistic, we corroborated results with selective bottom-up approximations, including sampled average selling price ranges by format, estimated transactions per outlet per day, and channel checks on delivery-led order baskets. When the bottom-up view had gaps, for example informal kiosks with limited reporting, the model used conservative productivity bands that were validated through interviews, and the bands were adjusted only when multiple respondents confirmed the direction.
Forecasts were developed using scenario analysis supported by a simple multivariate regression view. Variables such as tourist arrivals, CPI food inflation, real wage trend, urban population growth, and outlet expansion pace were tested for their impact on foodservice value. Assumptions were then finalized after re-checking whether the implied ticket size and transaction growth looked consistent with on-ground operating constraints.
Data Validation & Update Cycle
Validation was done through repeated variance checks across independent signals, so the model did not rely on a single dataset that could be incomplete. Outputs were compared against macro spend capacity, tourism seasonality, and observed format trends, and then exceptions were reviewed by another analyst before sign-off.
If a major mismatch appeared, respondents were re-contacted to confirm whether it was caused by one-time events, pricing shocks, or a change in outlet mix. The report is refreshed each year, and it is also revisited when material events occur, such as policy shifts, sharp inflation moves, or demand shocks tied to tourism. Before delivery, a final pass is completed so clients receive the most current view available.
Mordor Intelligence's Cambodia Foodservice Market Growth Market Size Versus Other Published Estimates
Published market values for Cambodia foodservice can look far apart because the included channels are not always the same, and the base year and currency timing can differ. Differences also show up when some sources use aggressive ticket-size growth, or when informal sales are assumed without a clear check.
Institutional catering and canteen revenue sits outside Mordor Intelligence's scope for this Cambodia foodservice estimate, which is one reason our 2025 number does not line up with figures that bundle schools, hospitals, and corporate sites into the same total. Another common gap is how home delivery is treated, since some estimates count platform-led delivery as a separate market and others keep it inside foodservice, and then the totals are not comparable.
Benchmark comparison
| Source | Market Size | Gaps in Research Methodology |
|---|---|---|
| Mordor Intelligence | USD 2.91 B (2025) | |
| Global Consultancy A | USD 3.32 B (2026) | Uses a later base year and a wider channel net that can include institutional foodservice and broader delivery-first models, which inflates the starting point versus an outlet-led foodservice definition. |
| Trade Journal B | USD 2.51 B (2024) | Provides limited scope detail and appears to rely on a short window with rapid growth assumptions, so the figure can understate or overstate value depending on what is included and how prices are converted. |
The table shows that timing, channel inclusions, and the way delivery and non-commercial eating occasions are handled can quickly change the total up or down. By keeping the demand pool tied to observable foodservice occasions and checking implied ticket sizes against primary feedback, the final value remains traceable to clear inputs and repeatable steps.
Key Questions Answered in the Report
How large is the Cambodia food service market in 2026?
It is valued at USD 3.17 billion and is projected to grow to USD 4.86 billion by 2031.
Which segment is expanding fastest?
Cloud kitchens lead growth with a 9.07% CAGR to 2031.
How large is the full-service restaurant segment today?
Full-service formats accounted for 53.68% of 2025 spending, the largest share among foodservice types.
Why are chains expanding aggressively now?
Master franchisees use capital-light, co-location models in malls, allowing chained outlets to grow at a 10.45% CAGR.