
Market Overview
| Study Period | 2021 - 2031 |
|---|---|
| Market Size (2026) | USD 13.90 Billion |
| Market Size (2031) | USD 17.01 Billion |
| Growth Rate (2026 - 2031) | 4.12 % |
| Fastest Growing Market | Asia Pacific |
| Largest Market | Asia Pacific |
| Market Concentration | Medium |
Major Players *Disclaimer: Major Players sorted in no particular order Image © Mordor Intelligence. Reuse requires attribution under CC BY 4.0. | |
Calcium Nitrate Market Analysis by Mordor Intelligence
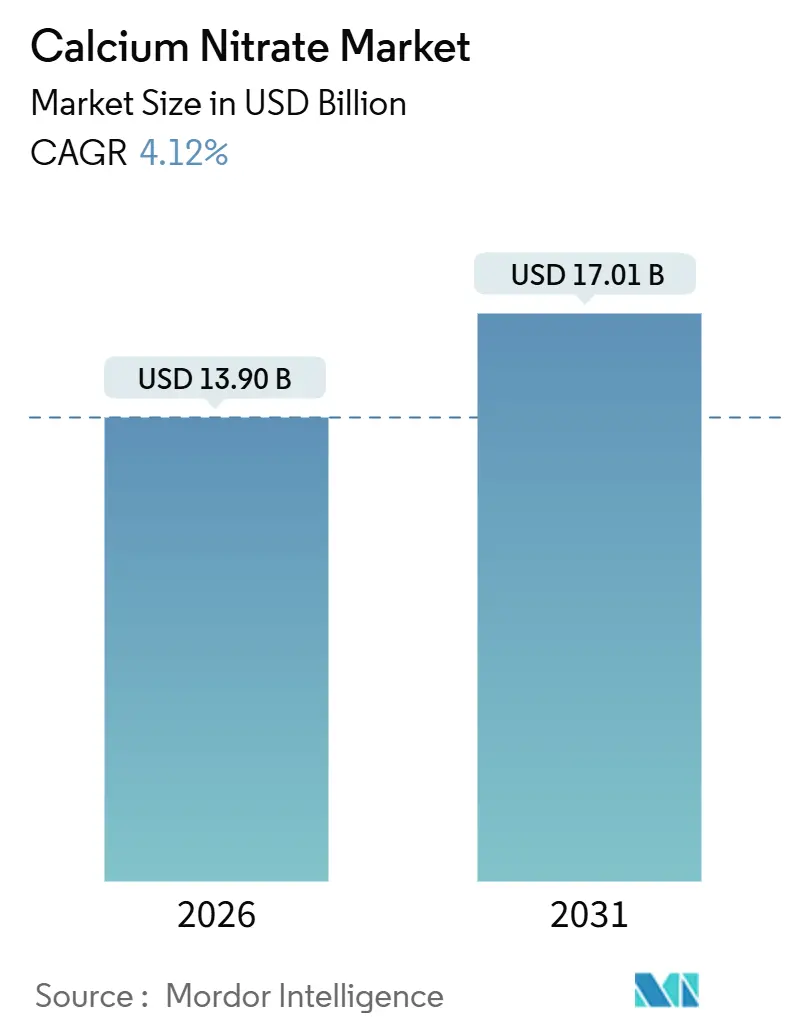
The Calcium Nitrate Market size is estimated at USD 13.90 billion in 2026, and is expected to reach USD 17.01 billion by 2031, at a CAGR of 4.12% during the forecast period (2026-2031). Widespread adoption of drip, micro-sprinkler, and pivot systems is steering growers toward fully water-soluble nitrate sources that integrate smoothly with fertigation equipment. The European Union’s carbon-adjustment levy on high-emission nitrogen fertilizers is widening the price gap between conventional and low-carbon options, rewarding producers that have invested in renewable-ammonia or carbon-capture routes. Urban vertical-farm operators and greenhouse vegetable producers in Asia-Pacific and North America prefer chloride-free calcium nitrate solutions to avert blossom-end rot and tip burn in premium produce. Meanwhile, wastewater utilities worldwide are scaling up nitrate dosing to curb hydrogen-sulfide generation, creating a complementary industrial demand stream.
Key Report Takeaways
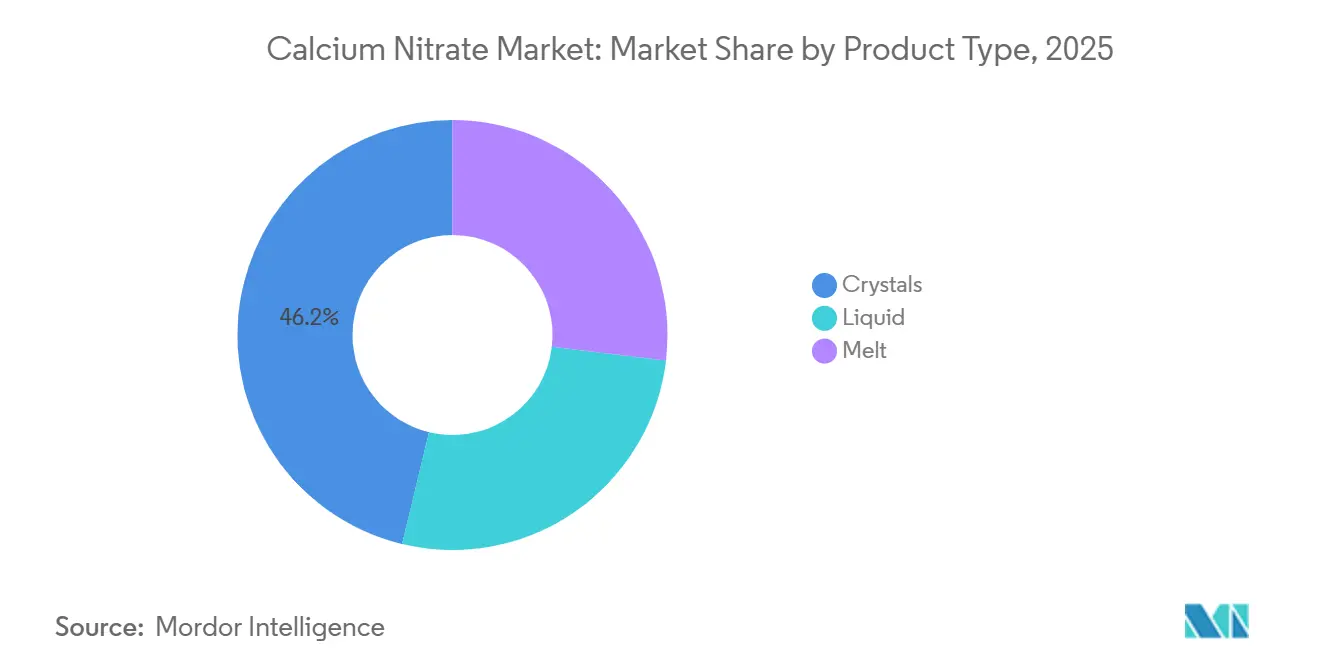
- By product type, crystals accounted for 46.22% revenue share of the calcium nitrate market in 2025; liquid is expanding at a 4.21% CAGR through 2031.
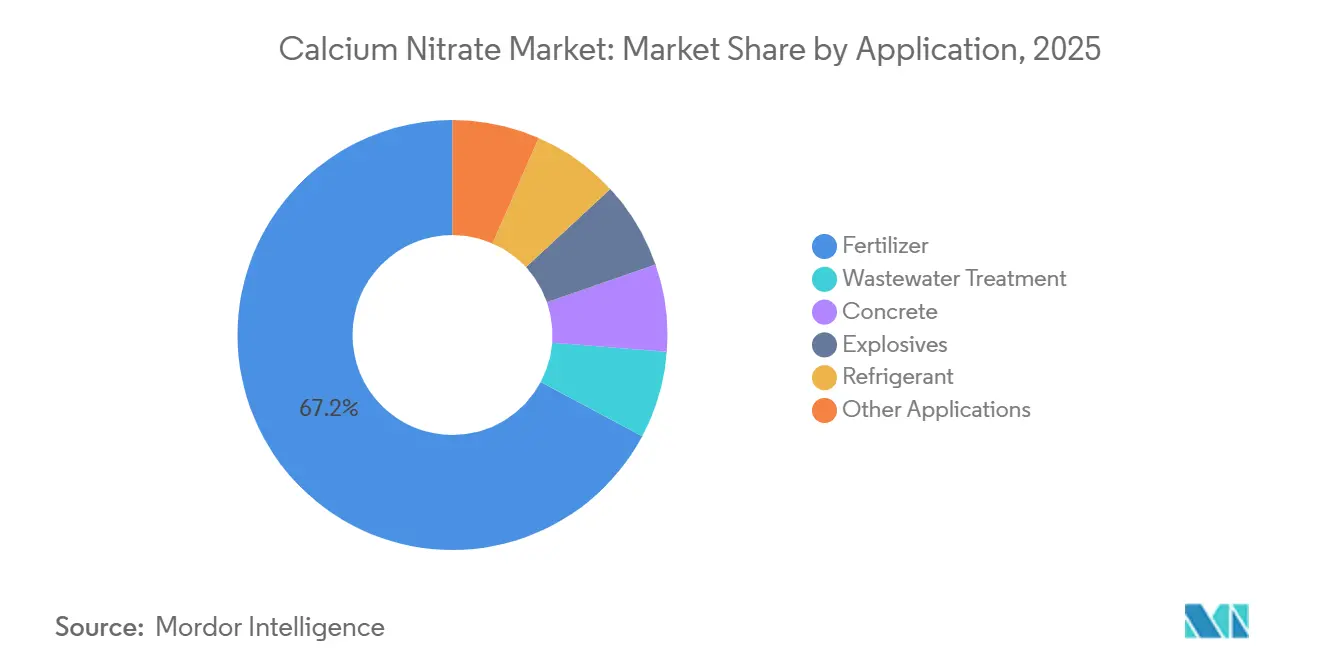
- By application, fertilizer represented 67.18% of demand in 2025, while wastewater treatment is advancing at a 4.78% CAGR to 2031.
- By geography, Asia-Pacific led with 41.98% calcium nitrate market share in 2025 and is forecast to grow at 5.41% through 2031.
Note: Market size and forecast figures in this report are generated using Mordor Intelligence’s proprietary estimation framework, updated with the latest available data and insights as of January 2026.
Market Trends and Insights
Drivers Impact Analysis of Calcium Nitrate Market*
| Driver | (~) % Impact on CAGR Forecast | Geographic Relevance | Impact Timeline |
|---|---|---|---|
| Specialty Water-Soluble Fertilizers Boom | +1.2% | Global, with concentration in Asia-Pacific and North America | Medium term (2–4 years) |
| Urban Vertical-Farm Fertigation Demand | +0.8% | North America, Europe, ASEAN urban clusters | Medium term (2–4 years) |
| Calcium-Deficiency Disorders in High-Value Crops | +0.7% | Global, particularly Mediterranean and tropical zones | Short term (≤ 2 years) |
| EU CBAM-Ready Low-Carbon Nitrate Push | +0.6% | Europe, with spillover to export-oriented producers globally | Long term (≥ 4 years) |
| On-Site Anhydrous Calcium Nitrate for CSP Salts | +0.3% | Middle East, North Africa, Southwestern United States | Long term (≥ 4 years) |
| Source: Mordor Intelligence | |||
Specialty Water-Soluble Fertilizers Boom
Precision irrigation is replacing broadcast spreading in water-scarce regions. Because calcium nitrate dissolves completely and contains no chloride, it is the preferred source of nitrogen and calcium for fertigation. Commercial grades such as Haifa’s Cal Prime deliver 17.0% total nitrogen—nearly all in nitrate form—and 23.5% water-soluble calcium, enabling concentrated stock solutions that lower freight costs and stabilize nutrient pH. Asia-Pacific governments subsidize micro-irrigation under China’s 14th Five-Year Plan and India’s Pradhan Mantri Krishi Sinchayee Yojana, lifting demand for fully soluble grades. Formulation innovation, exemplified by Croda Agriculture’s PiNT technology that slows ureic nitrogen release, bolsters overall adoption of complementary calcium nitrate inputs.
Urban Vertical-Farm Fertigation Demand
Vertical farms, rooftop greenhouses, and plant factories operate closed-loop hydroponic or aeroponic systems that mandate ultra-pure nutrient salts. Calcium nitrate, typically supplied in two-part recipes to prevent phosphate or sulfate precipitation, is central to these formulations. Yara’s greenhouse-grade Calcinit dissolves at 1,200 g L⁻¹ at 20 °C, leaving no residue that could clog emitters. New facilities in Singapore, the Netherlands, and the United States consume 5–10 kg of calcium nitrate per cubic meter of nutrient solution per crop cycle, providing steady, season-independent demand. Venture capital funding and corporate investments in metropolitan food production amplify this structural pull.
Calcium-Deficiency Disorders in High-Value Crops
Physiological disorders such as blossom-end rot and tip burn emerge when rapidly growing tissues lack calcium, even in calcium-rich soils. Foliar or fertigation treatments with calcium nitrate address both nutrient deficiency and nitrate supply, improving translocation efficiency and cell-wall strength. Ases Chemical Works recommends pre-plant applications of 4–8 kg acre⁻¹ and foliar sprays at 15% weight-per-volume to prevent these disorders. Economic stakes are high: a single blossom-end-rot episode can render up to 40% of a tomato crop unmarketable, prompting consistent inclusion of calcium nitrate in greenhouse and open-field nutrition programs.
On-Site Anhydrous Ca-Nitrate for CSP Salts
Concentrated solar power plants in arid regions blend anhydrous calcium nitrate with sodium and potassium nitrates to create ternary eutectic salts that melt near 130 °C. While these mixtures lower freezing points, they restrict the upper working temperature to roughly 450 °C, necessitating careful thermal-cycle design[1]. New projects in the Middle-East and North Africa adopt on-site nitrate synthesis to secure supply, adding incremental demand for industrial-grade calcium nitrate.
Restraints Impact Analysis of Calcium Nitrate Market*
| Restraint | (~) % Impact on CAGR Forecast | Geographic Relevance | Impact Timeline |
|---|---|---|---|
| Shift Toward Organic and Bio-Based Fertilizers | -0.5% | Europe, North America, niche segments in Asia-Pacific | Medium term (2–4 years) |
| Ammonia/Nitric-Acid Price Volatility | -0.7% | Global, with acute exposure in import-dependent regions | Short term (≤ 2 years) |
| Denitrifying Bioreactors Replacing Nitrate Dosing | -0.2% | North America (Midwest), Europe (agricultural drainage zones) | Long term (≥ 4 years) |
| Source: Mordor Intelligence | |||
Shift Toward Organic and Bio-Based Fertilizers
Policy incentives and consumer preferences are pushing land toward certified organic production in Europe and North America, where organic acreage grew by up to 10% annually in recent years. Organic standards prohibit synthetic nitrates, diverting demand to composts and microbial inoculants. The European Farm to Fork Strategy targets a 20% fertilizer-use reduction by 2030, with subsidies that reward low-input regimes. Although organic nutrient sources still account for a small slice of total nitrogen consumption, they displace calcium nitrate in premium vegetables, fruits, and wine grapes, particularly in Northern Europe and California.
Denitrifying Bioreactors Replacing Nitrate Dosing
Some U.S. Midwest and European drainage projects are installing wood-chip or substrate-filled bioreactors that foster denitrifying bacteria, reducing the need for chemical nitrate addition in municipal sewer lines. While adoption remains localized, successful pilots show 50%-plus hydrogen-sulfide reduction without external nitrate, posing a long-run substitution threat to calcium nitrate in odor-control applications[2]. Scaling hinges on land availability and maintenance costs, so market impact will unfold gradually.
*Our forecasts treat driver/restraint impacts as directional, not additive. The impact forecasts reflect baseline growth, mix effects, and variable interactions.
Calcium Nitrate Market Segment Analysis
By Product Type:
Crystals Anchor Bulk Use, Liquids Gain in Precision SystemsCrystals held 46.22% of revenue in 2025, underscoring their role in broad-acre and orchard nutrition programs. Growers appreciate the cost-efficiency of crystalline calcium nitrate tetrahydrate delivered in moisture-resistant bags that dissolve quickly in mix tanks. The calcium nitrate market size for crystals is expected to expand steadily, supported by greenhouse operators that dissolve crystals in stock tanks. Liquid formulations, sold at 9%–11% nitrogen and 14%–19% calcium, are advancing at a 4.21% CAGR. Precision fertigation adopters value the labor savings and uniformity that pre-dissolved solutions provide, especially when injected through computerized dosing pumps. Norkem’s 2024 launch of granular calcium nitrate illustrates continued innovation in the crystals category by offering a slower nutrient-release profile that mitigates leaching in high rainfall zones.
Industrial buyers form a niche but stable outlet. Anhydrous calcium nitrate melt blends into ternary CSP salts such as Hitec XL, enabling lower melting points but capping operating temperatures at 450 °C. Concrete admixture producers rely on calcium nitrate as a non-chloride set accelerator compliant with ASTM C494 Type C and Type E, a use reaffirmed in the Federal Highway Administration’s 2024 technical brief. Collectively, these industrial channels diversify demand and cushion the calcium nitrate market against agricultural cycles.

By Application:
Fertilizer Dominates, Wastewater Treatment SurgesFertilizer represented 67.18% of overall consumption in 2025, reflecting calcium nitrate’s dual nutrient benefit in intensive horticulture. The calcium nitrate market size for fertilizer applications will continue to climb as growers pursue higher nutrient-use efficiency. Wastewater treatment is the fastest-growing application at 4.78% through 2031. Utilities dose 50–200 mg L⁻¹ nitrate-nitrogen to suppress sulfate-reducing bacteria and to supply readily available carbon for denitrification, a practice endorsed by several U.S. state water agencies. Concrete, explosives, and refrigeration each account for smaller but persistent shares, with concrete admixture demand receiving fresh validation from the 2024 FHWA guidance that emphasized proper dosage control.
Industrial versatility sustains the calcium nitrate market during agricultural downturns. For instance, explosives manufacturers blend calcium nitrate into ammonium-nitrate-fuel-oil (ANFO) formulations to boost detonation velocity, while refrigeration engineers explore eutectic phase-change slurries that leverage calcium nitrate’s latent-heat properties for cold-chain logistics. This portfolio effect underpins a resilient growth outlook even amid regulatory and feedstock headwinds.
Geography Analysis
APAC Calcium Nitrate Market
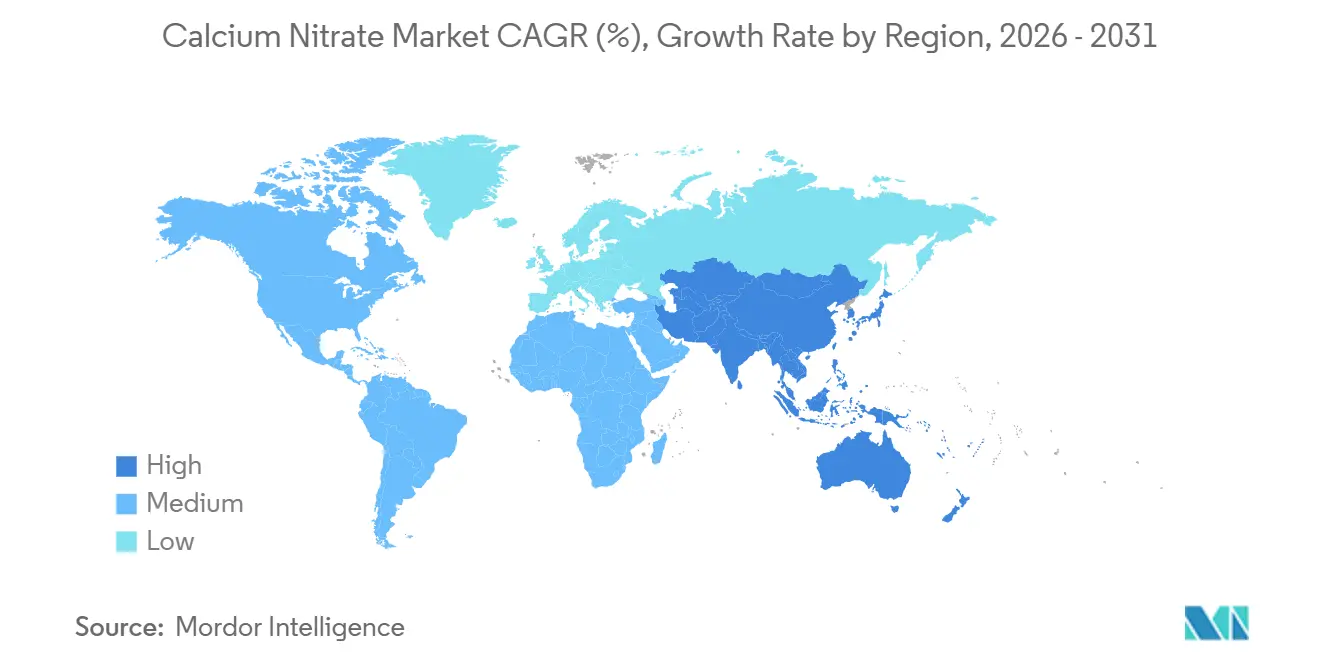
Asia-Pacific controlled 41.98% of the calcium nitrate market in 2025 and is forecast to grow at 5.41% through 2031. China’s 1.2 million ha greenhouse base is pivoting toward soilless systems that rely on ultrapure calcium nitrate in hydroponic mixes. National subsidies for water-saving irrigation accelerate fertigation adoption. India’s protected-cultivation acreage is rising under the National Horticulture Mission, with high uptake in Maharashtra and Rajasthan. Vertical-farm investment in Japan and South Korea, paired with expanding greenhouse clusters in Vietnam and Thailand, further underpins regional demand.
North America Calcium Nitrate Market
North America remains a core market. Greenhouse clusters in Arizona, California, and the Great Lakes region incorporate calcium nitrate in tomato and pepper nutrition programs to avert blossom-end rot. Municipalities in Florida and Texas continuously dose nitrate to manage hydrogen-sulfide odors in long sewer force mains. Canada’s greenhouse belt in Ontario and British Columbia sources calcium nitrate both domestically and from European suppliers. Mexico’s drip-irrigated vegetable exports from Sinaloa and Baja California increasingly rely on liquid grades that integrate easily with existing injection equipment.
EMEA and South America Calcium Nitrate Market
Europe’s market is characterized by advanced greenhouse technology and tightening carbon policy. Dutch growers demand high-purity calcium nitrate to maintain electrical-conductivity thresholds in recirculating nutrient systems, while German and French producers follow suit. The CBAM framework, enforced in 2026, advantages local low-carbon producers and encourages Nordic investment in green-ammonia projects that will supply future nitrate production. South America’s emerging role is underscored by Yara’s off-take agreement for renewable calcium ammonium nitrate from Paraguay, signaling Mercosur’s potential as a low-carbon supply hub. In the Middle East and Africa, Saudi Arabia’s Vision 2030 and South Africa’s export-oriented greenhouse clusters are adopting calcium nitrate solutions to support water-efficient, high-yield cultivation.
Value Chain Analysis
The calcium nitrate value chain starts with upstream feedstocks that shape both cost and carbon intensity, including ammonia-derived nitric acid (Ostwald route) and calcium sources such as limestone/calcium carbonate or calcium hydroxide. Integrated nitrogen players with captive ammonia and nitric-acid capacity, including Yara, Nutrien, EuroChem, URALCHEM JSC, and Haifa Negev Technologies, tend to have an advantage in securing supply and managing variability in nitric-acid and ammonia pricing. Non-integrated producers face higher exposure to short-cycle feedstock swings and logistics costs.
Midstream processing focuses on neutralization of nitric acid with calcium carbonate or calcium hydroxide, followed by evaporation, concentration, and finishing into liquids, crystals, or granules. Downstream, the product flows through fertilizer distributors, specialty greenhouse and hydroponics channels, and industrial chemical distributors into end uses such as fertigation-grade fertilizers, municipal wastewater odor control via nitrate dosing, concrete admixtures as non-chloride set accelerators, and explosives blends. Packaging, moisture control, and purity management also matter, since soluble horticulture and closed-loop systems require low-residue, consistent grades that help prevent emitter clogging and precipitation.
Competitive Landscape
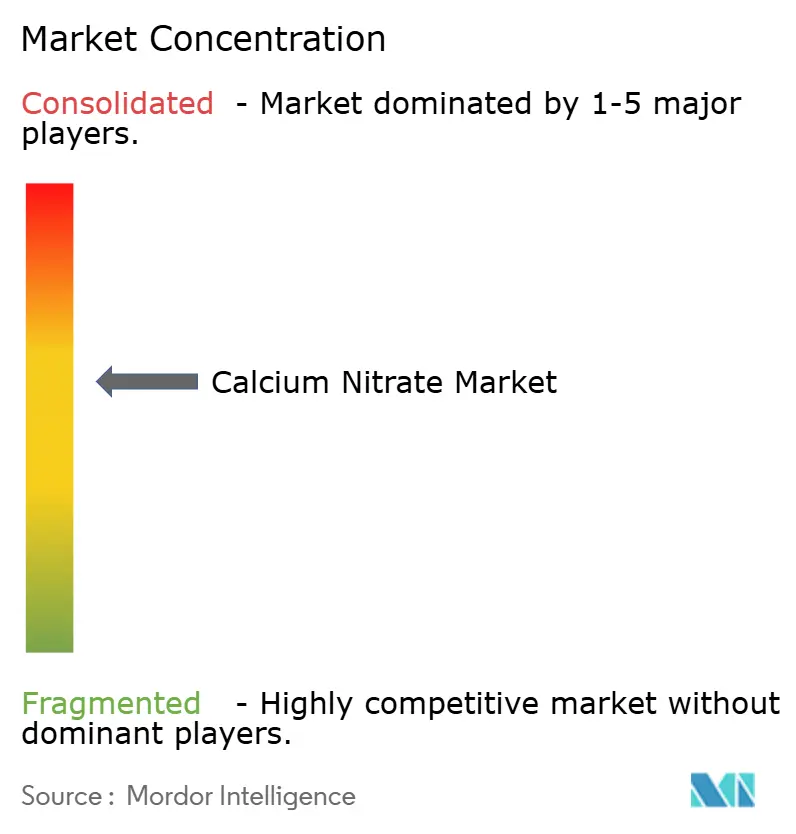
The calcium nitrate market is moderately concentrated. Yara, Nutrien, EuroChem, URALCHEM JSC, and Haifa Negev Technologies leverage vertically integrated ammonia and nitric acid capacity to secure raw-material cost advantages. Yara’s 165,000 t yr⁻¹ low-carbon fertilizer deal with PepsiCo Europe and its full off-take of ATOME’s upcoming 264,000 t yr⁻¹ renewable calcium ammonium nitrate plant exemplify first-mover positioning in premium, certified low-emission products. Nutrien and EuroChem are modernizing nitric-acid units with nitrous-oxide abatement technology to meet tightening emission limits, while Haifa focuses on ultra-low-ammonium formulations for greenhouse markets.
Smaller entrants differentiate through specialized formats or regional distribution. Norkem’s granular grade targets growers seeking season-long nutrient release, and specialty distributors in Asia-Pacific offer micronized powders tailored for foliar sprays. Digital agronomy tools are reshaping service models: Yara’s AtFarm platform provides satellite imagery and soil-analysis integration to optimize calcium nitrate dosing, embedding product usage within a broader advisory ecosystem. Emerging disruptors include start-ups exploring bio-based calcium sources and wastewater-technology firms promoting denitrifying bioreactors that reduce chemical nitrate dosing, signaling gradual competitive shifts.
Calcium Nitrate Industry Leaders
-
URALCHEM JSC
-
Yara
-
Nutrien
-
EuroChem Group
-
Haifa Negev technologies LTD
- *Disclaimer: Major Players sorted in no particular order
Calcium Nitrate Market Companies Covered in this Report
- ADOB
- Acron
- Airedale Group
- CF Industries Holdings, Inc.
- Eastman Chemical Corporation
- EuroChem Group
- GFS Chemicals, Inc.
- Haifa Negev Technologies LTD
- Noah Chemicals
- Nutrien
- PJSC Acron
- Prathista Industries Limited
- ProChem, Inc.
- RLF AgTech
- SABIC
- Shanxi Jiaocheng Tianlong Chemical Industry Co., Ltd.
- Shanxi Leixin Chemical Co., Ltd.
- Sumitomo Chemical Co., Ltd.
- SWISS FORMULATIONS
- URALCHEM JSC
- Van Iperen International
- WEGO Chemical Group
- Yara
Market Opportunities and Future Outlook
The most visible white-space is in premium water-soluble and specialty grades that fit fertigation and controlled-environment agriculture. Buyers increasingly look for chloride-free, fully soluble inputs and tighter impurity specifications, and product design and service models reflect that, including Yara greenhouse-grade formulations and digital agronomy tools such as Yara AtFarm that pair dosing guidance with product sales for hydroponics, recirculating greenhouse systems, and vertical farms.
A second opportunity track comes from industrial demand that is less tied to field seasonality. Wastewater utilities using nitrate dosing to suppress hydrogen sulfide and support biological nutrient removal create recurring offtake for solution grades, while non-chloride concrete accelerators aligned with ASTM C494 Type C and Type E keep calcium nitrate relevant in cold-weather and fast-track pours. In Europe, low-carbon positioning in nitrates is becoming a commercial lever under CBAM enforcement in 2026, and partnerships such as Yara and Atome around low-carbon calcium ammonium nitrate show how producers are building certified, lower-emission nitrogen chains that can spill into related nitrate product portfolios.
Recent Industry Developments in Calcium Nitrate Market
- June 2026: EuroChem highlighted a targeted third-quarter 2026 start-up timeline for its Kingisepp expansion in Russia, adding upstream nitrogen capacity that supports its wider nitrogen product portfolio. The update strengthens integration and can influence regional availability and cost positioning for nitrate-based products that share common feedstocks and intermediates.
- May 2026: Nutrien reported first-quarter 2026 results noting strong nitrogen fundamentals and cited North American ammonia operating rates of 92%. High operating rates at core nitrogen assets reinforce feedstock reliability for downstream nitrate products and support supply continuity during demand volatility.
- July 2024: Yara and Atome signed heads of terms under which Yara would market and sell calcium ammonium nitrate from Atome’s Villeta project in Paraguay under the YaraBela product line. The arrangement formalizes a route to commercialize lower-carbon nitrogen fertilizers at scale and broadens South America’s role in renewable nitrogen supply chains that connect into nitrate-based portfolios.
Calcium Nitrate Market Report Scope and Research Methodology
Market Definition and Coverage
For this methodology, the calcium nitrate market is measured as the sales value of calcium nitrate supplied as a distinct product, covering common solid and liquid forms used across agriculture and industrial applications.
Scope exclusions: We exclude blended calcium ammonium nitrate and compound fertilizers where calcium nitrate is only a minor ingredient.
Segments Covered in This Report
- By Product Type
- Crystals
- Liquid
- Melt
- By Application
- Fertilizer
- Wastewater Treatment
- Concrete
- Explosives
- Refrigerant
- Other Applications
- By Geography
- Asia-Pacific
- China
- India
- Japan
- South Korea
- ASEAN Countries
- Rest of Asia Pacific
- North America
- United States
- Canada
- Mexico
- Europe
- Germany
- United Kingdom
- France
- Italy
- NORDIC Countries
- Rest of Europe
- South America
- Brazil
- Argentina
- Rest of South America
- Middle-East and Africa
- Saudi Arabia
- South Africa
- Rest of Middle-East and Africa
- Asia-Pacific
Data Sources, Market Sizing, and Validation
Desk Research
Desk research starts by mapping where calcium nitrate demand is visible, then aligning that with published signals. Public sources such as FAOSTAT, USDA, Eurostat, and UN Comtrade are used to understand fertilizer intensity, cropping patterns, and trade movements that help explain regional demand direction.
We also refer to sources such as USGS for upstream context, as well as environmental agencies and wastewater associations for odor control and treatment dosing references. Company filings, investor presentations, and credible industry press are used to validate capacity mentions, product mix, and regional exposure. When needed, paid subscriptions for company financials and intelligence, patent databases, and shipment-level import/export views are used to refine assumptions around supply, product forms, and flows. The sources mentioned here are illustrative, and many other public and paid references were used to collect, cross-check, and clarify data points.
Primary Interviews and Surveys
Primary work is used to pressure-test the model with industry participants across production, distribution, and key end uses, including fertilizers, wastewater treatment, and construction chemicals. Interviews also help confirm price bands, typical contract terms, and the way demand shifts with crop cycles and industrial project timing across APAC, EMEA, and the Americas.
Distribution of primary research fieldwork respondents
| Company type | Respondent position | Region |
|---|---|---|
| Top tier: 30% | CXOs: 21% | APAC: 37% |
| Mid tier: 48% | Functional/Unit leaders: 39% | EMEA: 37% |
| Smaller Players: 22% | Managers: 40% | Americas: 26% |
Market-Sizing & Forecasting
The core sizing uses a top-down build where fertilizer nutrient demand indicators and wastewater treatment activity are converted into an addressable calcium nitrate requirement, then valued using region-specific pricing. To keep the totals realistic, we corroborate results with selective bottom-up checks, such as sample supplier revenue roll-ups, channel checks on typical volumes by form (liquid versus solid), and average selling price ranges confirmed by interviews.
Inputs that shape the model include crop mix shifts toward high-value horticulture, fertigation adoption, seasonal application patterns, wastewater odor control dosing intensity, construction activity for concrete acceleration, and observed trade flows that indicate supply balancing across regions. Forecasts are produced using scenario analysis, where demand drivers are stressed for agriculture and industrial uses separately, then reconciled into one outlook. Where direct volume signals are thin, gaps are handled using proxy indicators, such as regional fertilizer spend and wastewater network expansions, and then adjusted after primary feedback.
Data Validation & Update Cycle
Outputs are checked against independent signals, such as trade trends, upstream raw material movements, and application-level demand narratives heard in interviews. Large variances are reviewed, the underlying assumptions are revisited, and follow-up calls are triggered when pricing or usage rates do not align with market behavior.
Before sign-off, the model goes through multiple analyst reviews to confirm arithmetic integrity, consistent currency treatment, and reasonable regional shares. Reports are refreshed annually, and interim updates are made when material events occur, including capacity changes, regulatory shifts, or sharp price moves. Prior to delivery, a fresh validation pass is completed so clients receive an up-to-date view.
Mordor Intelligence's Calcium Nitrate Market Sizing Compared With Other Published Estimates
Published market sizes for calcium nitrate can differ even when the topic label looks the same, because the counted product boundary and the year used for pricing are not always aligned. The table below highlights how scope handling, application coverage, and currency timing can move the final number up or down.
The benchmark table shows a noticeable spread, and in Mordor Intelligence's model the value is tied to sales of calcium nitrate as a standalone product across fertilizer and industrial uses, while excluding blended calcium ammonium nitrate and compound fertilizers where it appears only as a minor ingredient.
Benchmark comparison
| Source | Market Size | Gaps in Research Methodology |
|---|---|---|
| Mordor Intelligence | USD 13.90 B (2026) | |
| Industry Publisher A | USD 12.40 B (2024) | Uses an earlier base year and applies a broad average price that can understate recent price changes, and coverage often leans toward agriculture-led demand without fully modeling industrial end uses like wastewater odor control and concrete acceleration. |
| Trade Release B | USD 11.80 B (2023) | Relies on a shorter historical anchor year and may include uneven currency conversion timing across regions, which can compress the global total when commodity-linked pricing and regional mix shift. |
In practice, the difference across published figures usually comes down to what is counted as calcium nitrate versus adjacent nitrate products, plus how prices are updated and normalized by region. By keeping the model traceable to a defined demand pool and a clear pricing year, the estimate stays easier to reproduce and explain when clients compare it to other public numbers.
Key Questions Answered in the Report
What is the current value of the calcium nitrate market?
The calcium nitrate market size reached USD 13.90 billion in 2026 and is forecast to reach USD 17.01 billion through 2031.
Which region leads demand for calcium nitrate?
Asia-Pacific accounted for 41.98% of global demand in 2025 and is projected to expand at a 5.41% CAGR to 2031.
Why are vertical farms interested in calcium nitrate?
Vertical-farm operators favor chloride-free calcium nitrate that dissolves completely, preventing emitter clogging while supplying both nitrate-nitrogen and calcium.
How does CBAM influence calcium nitrate trade?
The EU Carbon Border Adjustment Mechanism imposes levies on high-emission imports, giving a cost advantage to low-carbon calcium nitrate produced within Europe or with certified low-emission ammonia.