
Market Overview
| Study Period | 2020 - 2031 |
|---|---|
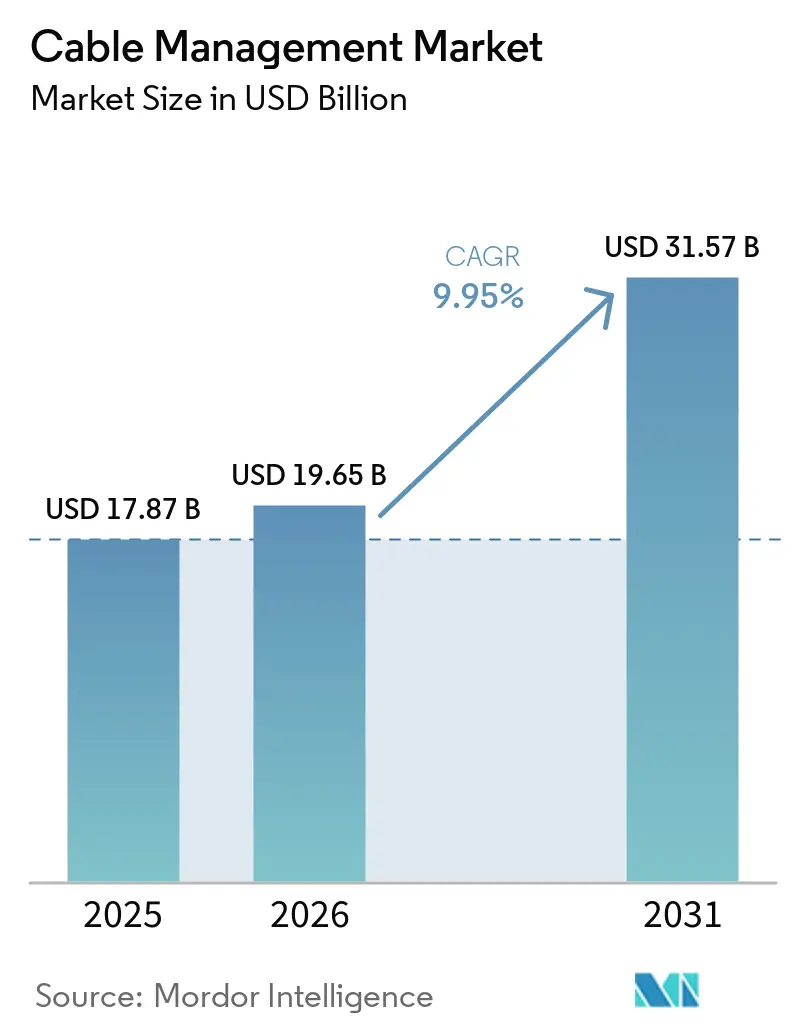
| Market Size (2026) | USD 19.65 Billion |
| Market Size (2031) | USD 31.57 Billion |
| Growth Rate (2026 - 2031) | 9.95 % |
| Fastest Growing Market | Asia Pacific |
| Largest Market | North America |
| Market Concentration | Medium |
Major Players *Disclaimer: Major Players sorted in no particular order Image © Mordor Intelligence. Reuse requires attribution under CC BY 4.0. | |
Cable Management Market Analysis by Mordor Intelligence
The cable management market size is expected to grow from USD 17.87 billion in 2025 to USD 19.65 billion in 2026 and is forecast to reach USD 31.57 billion by 2031 at 9.95% CAGR over 2026-2031. Increasing electrification of renewable-energy assets, hyperscale data-center construction, and industrial automation programs underpin this expansion. Higher power densities in 800 V EV-charging networks, convergence of data and control cabling within smart buildings, and modular off-site construction practices further intensify demand for advanced routing, protection, and identification solutions. Competitive activity centers on portfolio digitization and distribution-channel consolidation as suppliers race to integrate predictive maintenance features and shorten time-to-install. Supply-chain pressure from galvanized steel and PVC price swings persists, yet productivity gains from smart manufacturing and standard-modular product designs partially offset margin risk.
Key Report Takeaways
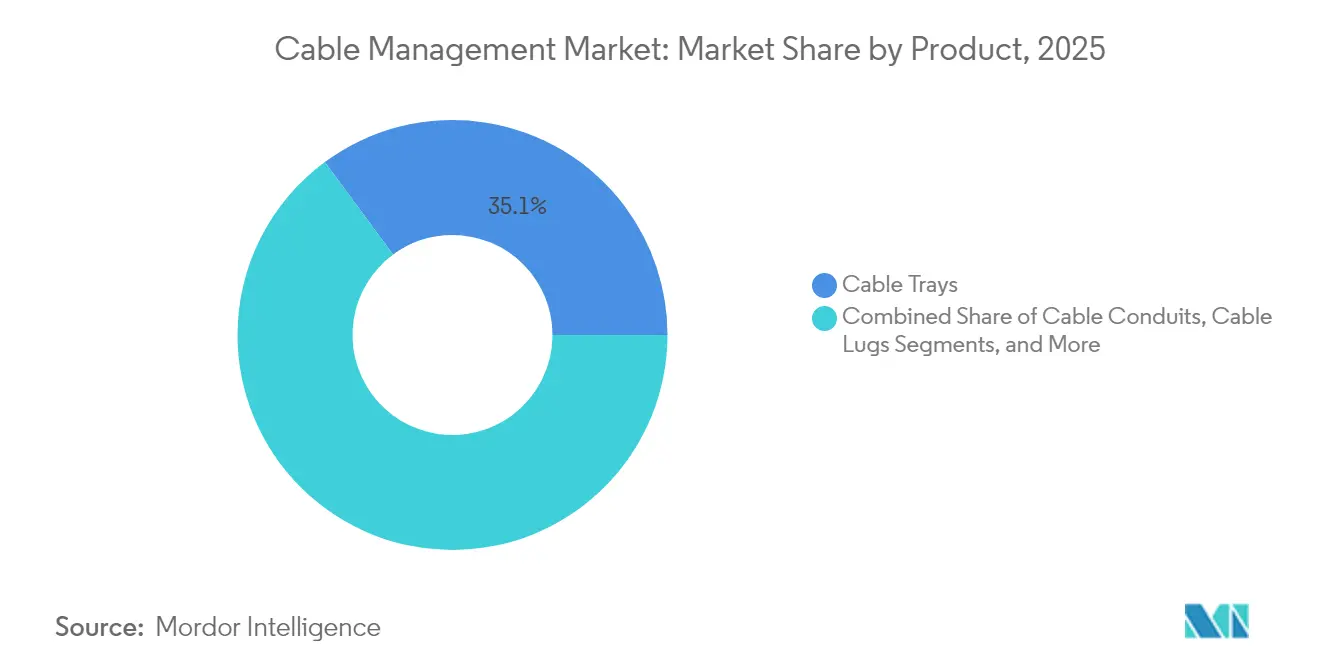
- By product, cable trays captured 35.12% revenue share in 2025, while cable connectors and glands led growth with a 10.52% CAGR through 2031.
- By end-user industry, IT and telecommunications held 28.24% of the cable management market share in 2025; data centers advance fastest at a 10.21% CAGR to 2031.
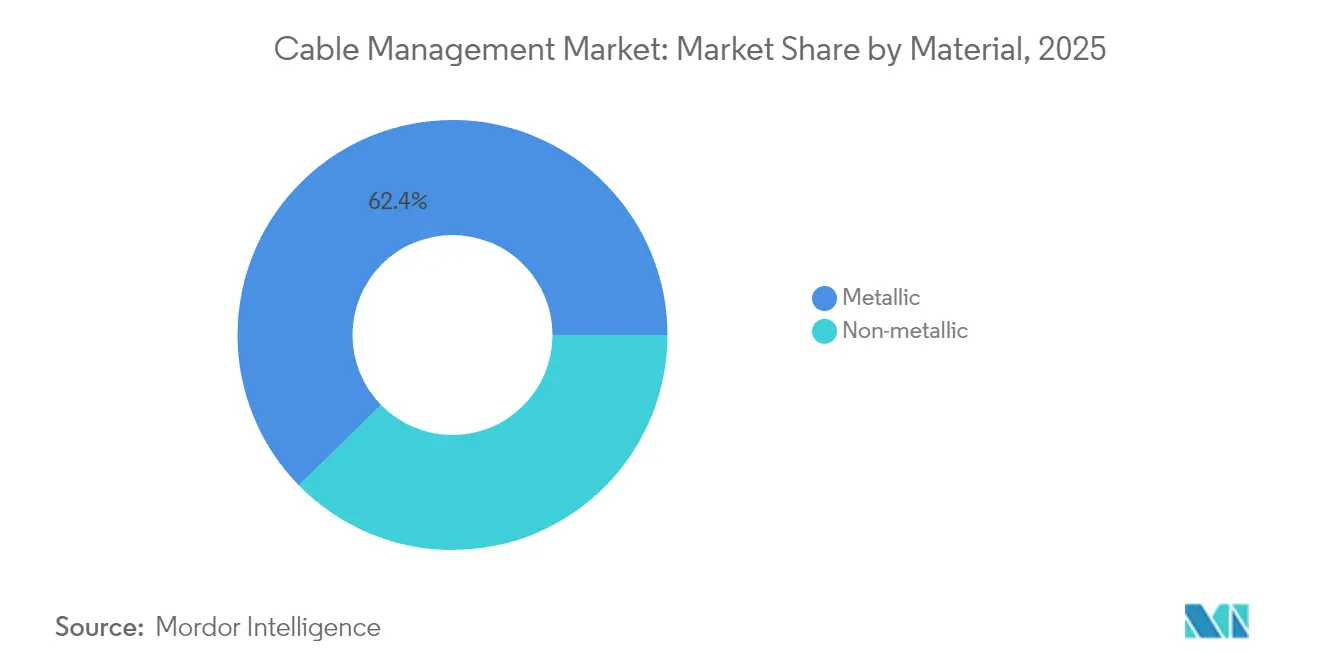
- By material, metallic solutions accounted for 62.35% share of the cable management market size in 2025, yet non-metallic alternatives are projected to expand at 10.97% CAGR between 2026-2031.
- By installation channel, overhead and ceiling systems led with 37.05% share in 2025 in the cable management market, while underground and buried systems record the highest forecast CAGR at 10.48% through 2031.
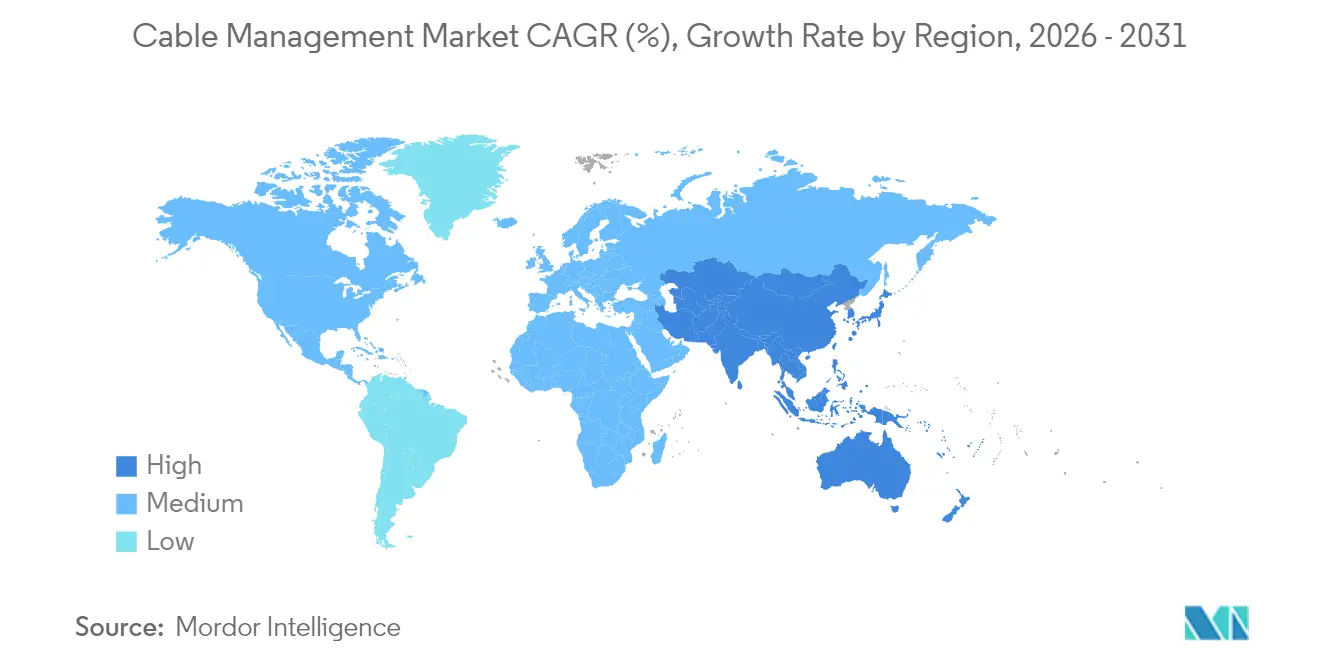
- By geography, North America commanded 39.02% of the cable management market in 2025; Asia Pacific is the fastest-growing region at an 10.71% CAGR to 2031.
Note: Market size and forecast figures in this report are generated using Mordor Intelligence’s proprietary estimation framework, updated with the latest available data and insights as of 2026.
Market Trends and Insights
Drivers Impact Analysis of Cable Management Market*
| Driver | (~) % Impact on CAGR Forecast | Geographic Relevance | Impact Timeline |
|---|---|---|---|
| Accelerated renewable-energy build-outs | +2.1% | Global, with concentration in Asia Pacific and North America | Medium term (2-4 years) |
| Proliferation of hyperscale data centers | +2.8% | North America and EU, expanding to Asia Pacific | Short term (≤ 2 years) |
| Smart-building mandates in OECD economies | +1.7% | North America and EU, selective Asia Pacific markets | Medium term (2-4 years) |
| Electrification of industrial processes | +1.9% | Global, with early adoption in developed markets | Long term (≥ 4 years) |
| Modular off-site construction methods | +1.2% | North America and EU, emerging in Asia Pacific | Medium term (2-4 years) |
| 800V EV-charging infrastructure rollout | +1.4% | Global, led by China, EU, and North America | Long term (≥ 4 years) |
| Source: Mordor Intelligence | |||
Proliferation of Hyperscale Data Centers
Hyperscale expansion represents the strongest single catalyst for the cable management market. NVIDIA DGX SuperPOD installations now specify cable pathways that house 400 G and 800 G fiber links plus liquid-coolant hoses in confined footprints, doubling the volume of trays and connectors per rack when compared with enterprise facilities. AFL’s vertical cable-manager designs raise usable rack space by 40% and cut airflow losses, supporting power densities beyond 70 kW per rack. It is expected that GPU clusters require three times the routing hardware per rack, pressuring project managers to pre-order components 16 weeks ahead of build start dates. Specialized connector supply is tight, lengthening project lead times and amplifying the value of modular kits that reduce field terminations. Vendors incorporating RFID tags and thermal sensors into trays gain share as operators seek predictive maintenance to avoid downtime.
Accelerated Renewable-Energy Build-Outs
Utility-scale solar and onshore wind sites impose unique environmental and longevity requirements on cable management systems. The U.S. Department of Energy outlines 25-year service-life standards that reward UV-stable polymers, thermal-expansion joints, and corrosion-proof fasteners.[1] Panduit delivers cable ties rated from -40 °C to +90 °C, limiting annual maintenance truck rolls across desert plants. CAB Solar’s modular hangers reduce install labor by 60% and virtually eliminate sand ingress, lowering O&M cost per megawatt. Wind-turbine applications favor flexible carriers that tolerate continual tower sway and rotation, maintaining insulation integrity for 20 years. Hybrid solar-plus-storage sites add routing complexity because DC arrays, AC grid interconnects, and battery circuits must remain segregated to satisfy safety codes.
Smart-Building Mandates in OECD Economies
Revisions to the EU Energy Performance of Buildings Directive obligate developers to install structured cabling that supports IoT sensor networks, centralized lighting control, and PoE endpoints.[2] Eland Cables calculates a 40% bump in cabling density for smart offices versus traditional builds. Integrated pathways that combine power and data reduce ceiling-grid clutter while meeting IEEE 802.3bt’s 90 W power-over-ethernet ceiling. MC Technologies embeds temperature and humidity probes inside trays, alerting facility teams when de-rating thresholds approach.[3] Paradoxically, widespread wireless adoption pulls more structured cabling because each access point requires reliable power and fiber backhaul.
Electrification of Industrial Processes
Manufacturers replacing pneumatic or hydraulic actuators with electric variants drive fresh investment in high-capacity tray systems that mitigate electromagnetic interference around variable-frequency drives. Rockwell Automation architecture guidelines separate operational-technology networks from corporate IT lines, doubling ladder-tray runs in brownfield retrofits. Prysmian’s quick-connect harnesses trim installation time by 30% while delivering chemical resistance for harsh process areas. Far East Cable leverages analytics to predict cable-bend fatigue and cuts maintenance budgets by 25% in smart factories. RFID-tagged harnesses feed asset-management systems, easing line reconfiguration and reducing unplanned downtime.
Restraints Impact Analysis of Cable Management Market*
| Restraint | (~) % Impact on CAGR Forecast | Geographic Relevance | Impact Timeline |
|---|---|---|---|
| Volatile prices of galvanized steel and PVC | -1.8% | Global, with acute impact in cost-sensitive markets | Short term (≤ 2 years) |
| Lengthy certification cycles for flame-retardant plastics | -1.1% | North America and EU regulatory markets | Medium term (2-4 years) |
| Growing adoption of wireless/PoE solutions | -0.7% | North America and EU, expanding to Asia Pacific | Medium term (2-4 years) |
| Miniaturization reducing copper cable volumes | -0.5% | Global, concentrated in electronics manufacturing hubs | Long term (≥ 4 years) |
| Source: Mordor Intelligence | |||
Volatile Prices of Galvanized Steel and PVC
Spot prices for galvanized steel and PVC swung 15% in early 2025 as regional supply imbalances and energy-cost spikes hit procurement budgets. ADS Sheet Metal’s forecasts show aluminum hovering near USD 2,763 per ton, further complicating cost assumptions. Cable management suppliers shorten quote validity to 14 days and index contracts to commodity benchmarks, shifting risk to end users. Volatility encourages substitution: fiber-reinforced plastic trays see accelerated interest, yet their adoption is tethered to longer qualification cycles. Some EPC contractors lock in bulk raw-material hedges, but smaller installers absorb direct hits to profitability.
Lengthy Certification Cycles for Flame-Retardant Plastics
UL 2556 and UL 94 testing adds 18-24 months to new product launches, slowing the flow of innovative halogen-free polymers.[4] nVent PYROTENAX research indicates potential tightening of UL 2196 requirements, signaling even longer lead times for approvals. Benvic reports certification outlays topping USD 500,000 per variant, a hurdle for startups diversifying beyond standard PVC. EU Construction Products Regulation forces multi-language declarations of performance, escalating paperwork for cross-border sales. Manufacturers maintain parallel product lines, legacy PVC for cost-sensitive projects, and HFFR for regulated sectors, straining inventory management.
*Our forecasts treat driver/restraint impacts as directional, not additive. The impact forecasts reflect baseline growth, mix effects, and variable interactions.
Cable Management Market Segment Analysis
By Product:
Infrastructure Density Drives SpecializationCable trays retained a 35.12% share of the cable management market in 2025, reflecting their broad applicability, while cable connectors and glands are projected to grow at a 10.52% CAGR through 2031. Elevated rack densities in hyperscale data centers and renewable inverters amplify demand for high-ampacity lugs, strain-relief glands, and multi-tier trays that separate power and fiber circuits. The cable management market size for connectors is set to widen as modularity shortens installation windows and limits site labor exposure. Junction boxes and carriers post steady gains, with dynamic-motion carriers finding niche uptake in robotic welding cells. Premium vendors add RFID tagging and asset-tracking software to differentiate offerings and lock in service contracts, supporting hybrid CAPEX-plus-OPEX revenue models.
Ties, covers, and fasteners accumulate incremental revenue thanks to maintenance cycles that replace UV-aged components in solar farms. Innovations in snap-in channel covers reduce assembly time, and color-coded clips boost troubleshooting efficiency. The cable assembly market size for fiber products benefits from Meta’s multibillion-dollar Corning agreement, which pre-books capacity and signals confidence in long-term demand. High-current lugs suited for 1,500 V solar strings command ASP premiums, buttressing margins within the cable management market. As copper and aluminum price spreads fluctuate, dual-material lugs enter designs, combining aluminum bodies with copper-plated contacts to manage galvanic corrosion without heavy cost penalties.

By End-User Industry:
Data Centers Accelerate GrowthIT and telecommunications held 28.24% of the cable management market share in 2025, yet data centers represent the fastest-growing end-user at 10.21% CAGR through 2031. Artificial-intelligence clusters, liquid-cooled servers, and battery-backed UPS architectures multiply pathway requirements per square foot. The cable management market size for data centers is therefore expected to capture a rising revenue slice as operators standardize on wider rung ladders and double-stacked basket trays to accommodate hybrid copper-fiber topologies.
Construction firms adopting modular prefabrication embed trays within wall panels, enabling hours-rather-than-days rack hall builds. Energy and utilities sectors push for corrosion-resistant solutions in offshore wind substations and hydrogen electrolyzer plants, sustaining metallic-tray demand. Manufacturing embraces flexible plug-and-play harnesses to support Industry 4.0 line changes, while healthcare facilities prioritize smooth, wipe-down surfaces and antimicrobial coatings. Across sectors, IT-OT convergence drives integrated raceways that preserve network segmentation yet promote data exchange for condition monitoring.
By Material Type:
Non-Metallic Solutions Gain MomentumMetallic options, principally steel and aluminum, commanded 62.35% of the cable management market size in 2025 owing to structural rigidity and fire performance. Non-metallic systems, however, show a stronger 10.97% CAGR on the back of corrosion-resistance mandates in chemical processing and weight-saving imperatives in aerospace. Hybrid assemblies combine steel backbones with FRP covers, delivering load-bearing strength while trimming weight by 25%.
Recycled-content quotas in EU public-procurement contracts spur suppliers to certify post-consumer content, complicating melt-chemistry but unlocking bids. Halogen-free flame-retardant formulations penetrate transport infrastructure where smoke-toxicity limits tighten. Marine and offshore energy segments pivot toward glass-reinforced polyester trays, which cut maintenance cycles in salt-spray zones. Supply continuity for specialty resins becomes critical, leading OEMs to dual-source from regional compounders.
By Installation Channel:
Underground Systems Drive GrowthOverhead and ceiling installations led revenue with 37.05% share in 2025, but underground and buried systems outpace at 10.48% CAGR amid grid-hardening and EV-charging corridor rollouts. The cable management market supports multi-duct trenches integrating power, fiber, and control in shared civil works, trimming lifecycle costs. Under-floor raceways flourish in hyperscale data-center halls, enabling rapid rack row reconfigurations without ceiling work.
Basket trays remain favored in retrofits for ease of access, while wall-mounted ladders suit constrained industrial corridors. Nexans reports modular underground systems that splice in 70% less field time and deliver 80% safety gains, accelerating adoption in dense urban renewal projects. Regulatory divergence in burial depth, grounding, and fire-barrier practice challenges multinational suppliers to maintain adaptable product catalogs.
Geography Analysis
North America and Mexico Cable Management Market
North America retained 39.02% of the cable management market in 2025, anchored by data-center megacampus construction across Virginia, Ohio, and Alberta. Federal incentives for renewable generation and transmission, together with grid-resilience funds, lift underground-system uptake. Mexico’s near-shoring boom stimulates cable-tray manufacturing footprints, evidenced by Panduit’s USD 50 million plant that serves both data-center and solar-farm demand.
APAC Cable Management Market
Asia Pacific leads growth at an 10.71% CAGR through 2031. China’s smart-factory programs and India’s high-voltage transmission upgrades fuel large tenders favoring domestic suppliers equipped to navigate local certification. Japan and South Korea innovate miniaturized fiber-tray solutions for semiconductor cleanrooms, while Southeast Asia attracts foreign direct investment into battery gigafactories that specify heavy-duty non-metallic conduits. Regional content rules encourage joint ventures, such as ABB-Niedax’s North American tray JV blueprint now replicated in ASEAN markets.
Europe Cable Management Market
Europe progresses steadily as smart-building codes and renewable-energy targets hold spending levels, though complex CPR documentation extends pre-bid phases. Germany’s automotive-line electrification demands flexible drag-chain carriers, and the U.K.’s London-edge data-center cluster invests in compact under-floor solutions. Eastern European wind corridors present new revenue pools, albeit with price-sensitive specifications that favor galvanized ladder trays over composites.
Regulatory Landscape
Regulation shaping cable management demand increasingly comes from telecom and building-safety rules that govern installation, labeling, and fire performance. In telecommunications, the FCC finalized updated submarine cable landing license rules in October 2025 and set May 7, 2026 as the effective date for revised pole attachment rules, which affect physical pathway selection, access procedures, and documentation for cable routing on poles and at landing facilities. Several national bodies also issued installation frameworks aimed at protecting shared infrastructure, including the Uganda Communications Commission framework on optical fiber installation, maintenance, protection, and disposal effective January 1, 2026, and the Communications Authority of Kenya draft cable installation guidelines published in April 2026 (effective date noted as TBD).
Standards activity is also tightening technical requirements for cable routing and identification in high-density environments. China issued GB/T 46331-2025 for direct-surface optical fiber cables (implemented May 1, 2026), while ITU-T approved Recommendation L.405 (November 2025) on preconnectorized cabling components for FTTx, supporting more modular, factory-terminated approaches. Safety and performance norms for containment and premises networks continue to evolve through updates such as IEC 61386-22:2021/COR1:2025 for conduit systems and PD CLC/TS 50658:2025 for cable management systems providing support for cables with intrinsic fire resistance, which raise compliance requirements for materials, testing, and documentation across regulated markets.
Value Chain Analysis
The cable management value chain covers upstream inputs (galvanized steel, aluminum, stainless and corrosion-resistant alloys, PVC/HDPE/FRP polymers, additives for halogen-free flame retardancy, fasteners and coatings), midstream manufacturing (metal forming and finishing for trays and raceways, extrusion and molding for conduits and fittings, connector and gland machining and assembly, and kitting of accessories), and verification and approvals (UL and related fire and performance testing for products used in regulated installations). Downstream, the market moves through electrical distributors and direct OEM channels into EPCs, data center integrators, telecom network contractors, and industrial installers, where labor availability and prefabrication readiness influence the balance between modular kits and field-assembled systems.
Bottlenecks tend to reflect both commodity volatility and certification and logistics constraints. The report context notes 15% swings in galvanized steel and PVC spot prices in early 2025, leading suppliers to shorten quote validity and use indexed contracts. It also highlights that specialized product lines for flame-retardant plastics face 18-24 month certification cycles, with UL 2556 and UL 94 testing pathways referenced in the report context. For telecom-related builds, supplier discussions point to long lead times for high-spec fiber and medium-voltage components during peak demand, driving a shift away from just-in-time purchasing toward longer-term volume commitments and buffer stock. This reinforces the role of large distributors and vertically integrated manufacturers in meeting hyperscale data center and broadband deployment schedules.
Competitive Landscape
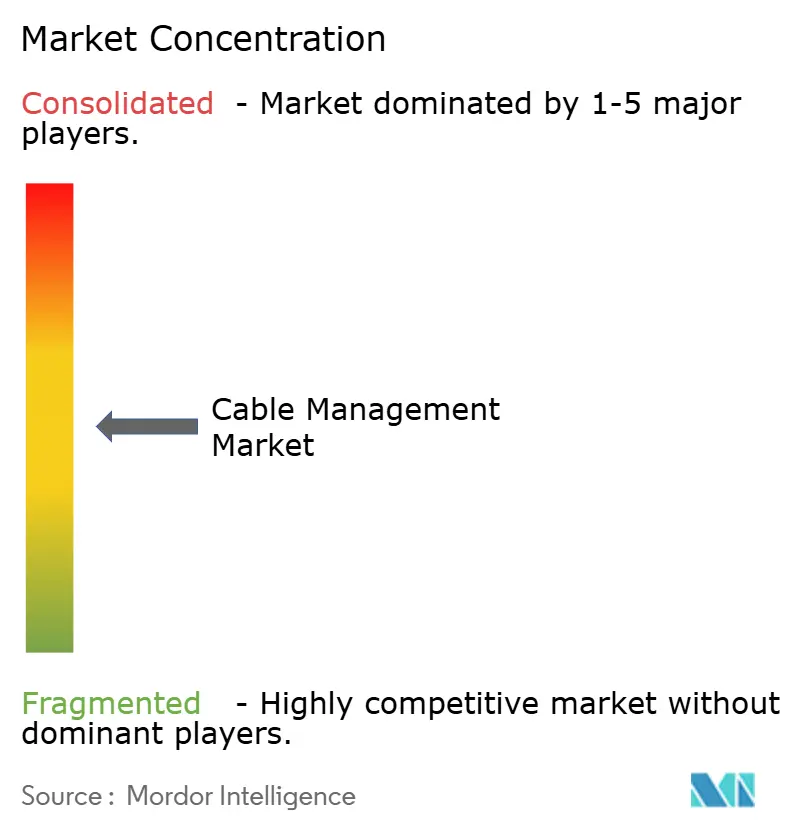
The cable management market exhibits moderate concentration: the top five vendors collectively control around 45%, balanced by a long tail of regional specialists. Established majors such as ABB, Schneider Electric, Eaton, and Legrand deploy vertical integration and digital SaaS overlays to defend share. Distributor consolidation accelerates; Sonepar’s 17 acquisitions in 2024 added EUR 2.2 billion in sales and broadened shelf presence for preferred OEM brands.
Joint ventures and tuck-in acquisitions extend product breadth, ABB and Niedax integrate automation know-how with tray expertise, while Legrand’s purchase of VASS expands fiber management for hyperscale clients. Technology disruptors focus on smart trays with embedded sensors and cloud dashboards; early deployments show mean-time-to-repair falling 30% as faults pinpoint faster.
Patent filings cluster around composite-material blends and clip-in accessory modules, hinting at future differentiation through installation speed. Regional challengers leverage proximity, tailored codes, and shorter lead times to chip at incumbents, especially in Asia. Market leaders counter by localizing fabrication and offering BIM libraries that integrate with contractor workflows.
Cable Management Industry Leaders
-
Schneider Electric SE
-
Eaton Corporation plc
-
ABB Ltd.
-
HellermannTyton Group PLC
-
Chatsworth Products, Inc.
- *Disclaimer: Major Players sorted in no particular order
Cable Management Market Companies Covered in this Report
- ABB Ltd.
- Schneider Electric SE
- Eaton Corporation plc
- Legrand SA
- Prysmian S.p.A.
- Panduit Corp.
- HellermannTyton Group PLC
- Atkore Inc.
- Hubbell Incorporated
- TE Connectivity Ltd.
- Chatsworth Products, Inc.
- Enduro Composites, Inc.
- Leviton Manufacturing Co., Inc.
- OBO Bettermann Holding GmbH and Co. KG
- Niedax Group
- Oglaend System Group AS
- Thomas and Betts Corporation
- CableOrganizer.com LLC
- Marco Cable Management Ltd.
- Unitrunk Ltd.
- Elastimold (ABB Installation Products Inc.)
- Cembre S.p.A.
Market Opportunities and Future Outlook
High-density AI data centers and FTTx deployments are accelerating adoption of modular, high-visibility fiber management and standardized identification, creating a clearer entry point for vendors that combine routing hardware with installation-time reductions and improved traceability. A specific signal is Legrand's March 2026 launch of Chroma Link, a color-indexed hyper-density fiber solution for AI and machine learning networks, which targets faster port identification as fiber counts increase. In the same period, ITU-T Recommendation L.405 (approved November 2025) on preconnectorized components supports more factory-terminated, plug-and-play approaches that shift value toward pre-assembled cable management kits and distribution frames that reduce on-site terminations.
Standards-driven labeling and documentation are also expanding adjacent demand for accessories and software-enabled workflow integration. ANSI/TIA-606-D (2026) calls for alphanumeric labeling with QR codes for telecommunications infrastructure, which aligns with the market shift toward RFID/QR-enabled identification and asset tracking in trays and enclosures described in the report context. Corrosion and environmental resilience for outdoor and underground builds is another opportunity, especially for suppliers that can pair non-metallic or hybrid materials with accepted test regimes to keep qualification timelines manageable for utilities, renewable assets, and telecom civil works, while modular enclosure and pathway systems help contractors deploy faster under capacity constraints.
Recent Industry Developments in Cable Management Market
- July 2026: Schneider Electric launched the EasyPact CVS C4 molded-case circuit breaker range in South Africa, extending ratings up to 1600A for non-critical low-voltage applications. The release supports higher-capacity distribution architectures that often require more structured routing, segregation, and protection of power cables inside panels, switchrooms, and adjacent pathways. It also reinforces Schneider Electric's regional portfolio refresh as electrification projects add load density in commercial and industrial facilities.
- June 2025: Schneider Electric introduced prefabricated modular EcoStruxure Pod Data Center configurations aimed at high-density AI and accelerated compute deployments. The pod approach emphasizes faster site build schedules and more repeatable physical-layer layouts, which increases pull-through for standardized cable pathways, containment, and installation kits. It also signals continued vendor focus on integrating power distribution and physical infrastructure into modular form factors for data center rollouts.
- December 2024: Prysmian closed its acquisition of Encore Wire for approximately USD 4.2 billion, expanding its North American footprint and portfolio breadth in electrical products. The combination strengthens procurement leverage and availability for cable and related installation ecosystems, supporting bundled offerings and more reliable supply for large renewable, industrial, and construction projects. Greater scale at the cable supplier level also influences downstream stocking and compatibility requirements for lugs, glands, and containment systems used alongside installed conductors.
Cable Management Market Report Scope and Research Methodology
Market Definition and Coverage
For this study, the cable management market covers products used to route, protect, organize, and terminate cables and wires across buildings and industrial sites, and the value is captured as revenue from the sale of these products in USD.
Scope exclusions: It excludes bulk wire and cable, cable installation labor-only services, and unrelated electrical components that do not primarily manage or protect cable runs.
Segments Covered in This Report
- By Product
- Cable Trays
- Cable Raceways
- Cable Conduits
- Cable Connectors and Glands
- Cable Carriers
- Cable Lugs
- Junction / Distribution Boxes
- Ties, Covers, Fasteners, Clips
- By End-user Industry
- IT and Telecommunications
- Construction
- Energy and Utilities
- Manufacturing
- Commercial
- Healthcare Facilities
- By Material Type
- Metallic (Steel, Aluminum)
- Non-metallic (PVC, HDPE, FRP)
- By Installation Channel
- Overhead and Ceiling
- Under-floor
- Wall-mounted
- Underground / Buried
- By Geography
- North America
- United States
- Canada
- South America
- Brazil
- Argentina
- Rest of South America
- Europe
- Germany
- United Kingdom
- France
- Russia
- Rest of Europe
- Asia Pacific
- China
- Japan
- India
- South Korea
- Rest of Asia Pacific
- Middle East and Africa
- Middle East
- Saudi Arabia
- United Arab Emirates
- Rest of Middle East
- Africa
- South Africa
- Nigeria
- Rest of Africa
- Middle East
- North America
Data Sources, Market Sizing, and Validation
Desk Research
We start with desk research to set a clean market boundary and to collect measurable signals that can be checked year over year. Public sources such as the US Census Bureau construction spending series, Eurostat construction indicators, the International Energy Agency power and grid investment outlooks, and the World Bank macro indicators are used to frame demand conditions across regions.
To connect those demand signals to what is sold, we also review sources such as UN Comtrade trade flows for relevant categories, electrical and construction association publications, product catalogs and technical standards pages, and company annual reports and investor presentations for revenue cues and product mix language. In parallel, we use a paid subscription for company financials and another for patents and technical filings to help confirm product adjacency and capture where innovation is shifting specifications and materials. The desk research sources mentioned above are illustrative and not exhaustive, and many other references were also used to collect data, validate assumptions, and clarify gaps.
Primary Interviews and Surveys
Our primary work focuses on validating product coverage and real purchasing behavior across key end users such as construction, energy and utilities, manufacturing, commercial facilities, healthcare facilities, and IT and telecommunications. Interviews and surveys are run with manufacturers, distributors, installers, and procurement and engineering teams across APAC, EMEA, and the Americas to close gaps on pricing movement, channel mix, and how installation choices shift demand between trays, raceways, conduits, connectors and glands, and junction or distribution boxes.
Distribution of primary research fieldwork respondents
| Company type | Respondent position | Region |
|---|---|---|
| Top tier: 37% | CXOs: 14% | APAC: 47% |
| Mid tier: 45% | Functional/Unit leaders: 39% | EMEA: 34% |
| Smaller Players: 18% | Managers: 47% | Americas: 19% |
Market-Sizing & Forecasting
Sizing starts with a top-down build that reconstructs the demand pool by linking construction activity and infrastructure spend to the intensity of cabling and fit-out work across end-use settings. Once that base is formed, the total is split by product groups and installation channels using adoption shares that were checked in interviews, and then translated into value using region-specific pricing bands.
In the model, a few inputs do most of the heavy lifting, including non-residential floor area additions and retrofit rates, data center and telecom site build-outs, grid expansion and renewable interconnection projects, industrial capex cycles, and the mix shift between overhead or ceiling, under-floor, wall-mounted, and underground runs. Material substitution between metallic and non-metallic systems is also tracked because it moves average selling prices and replacement cycles. To keep the totals realistic, selective bottom-up approximations are used as a cross-check, such as sampled price per meter assumptions applied to typical run lengths, distributor channel checks, and partial supplier roll-ups where public revenue disclosures allow it. When a bottom-up view is incomplete for smaller countries or informal channels, we bridge the gap using proxy indicators like construction value added and trade intensity, and then re-test the implied per-project spend with experts.
For forecasting, we rely on scenario analysis supported by a simple multivariate regression in the background, where the main drivers are construction output, energy and utilities investment, industrial production, and ICT infrastructure expansion. The final forecast path is adjusted only after primary feedback confirms whether lead times, commodity-linked pricing, and project postponements are likely to shift demand timing.
Data Validation & Update Cycle
Before results are finalized, the numbers are triangulated against independent signals, including construction and infrastructure series, trade movement for relevant categories, and the implied per-site or per-building spend that comes out of the model. Variance checks are run at the region and product level, and if a country trend looks too steep or too flat, the drivers are re-opened and the assumption is tested again with fresh calls.
A second analyst reviews the spreadsheet logic, units, and currency conversions, followed by a final review to ensure the scope is applied consistently across all segments and geographies. The report is refreshed annually, and interim adjustments are made when major policy shifts, large project cycles, or sharp raw material moves clearly change pricing or demand. Right before delivery, we do a final pass on the latest public indicators so the view is current.
Mordor Intelligence's Cable Management Market Size Measured Against Other Published Estimates
Published market sizes for cable management can vary even when the topic name looks the same, because the counting rules behind the number are often different. The biggest differences usually come from what product families get included, whether channel margins are treated consistently, and how quickly price and demand shifts are refreshed in the model.
By tracking installation channel mix and refreshing price bands at the regional level, Mordor Intelligence keeps the total tied to trays, raceways, conduits, connectors and glands, carriers, lugs, and junction or distribution boxes, and then excludes bulk wire and cable that can inflate broader wire and cable management totals.
Benchmark comparison
| Source | Market Size | Gaps in Research Methodology |
|---|---|---|
| Mordor Intelligence | USD 17.87 B (2025) | |
| Global Consultancy A | USD 27.19 B (2025) | Uses a broader wire and cable management scope that can fold in additional product families and cable-type lenses, which can raise the total beyond a product-only cable management set. |
| Industry Association B | USD 14.74 B (2023) | Reported for an earlier year and can reflect different price levels and channel structures, which makes the value look lower when compared directly without normalizing for pricing and scope updates. |
The spread across sources mostly traces back to scope and timing, rather than a disagreement that demand exists. When the product list, channel treatment, and year are aligned, the market size becomes easier to reconcile and the remaining differences are usually explainable.
Key Questions Answered in the Report
What growth rate is projected for the cable management market through 2031?
The market is forecast to grow at a 9.95% CAGR between 2026 and 2031.
Which region will add demand most quickly over the forecast period?
Asia Pacific is projected to record the fastest expansion at an 10.71% CAGR to 2031.
Which product category is expected to grow fastest?
Cable connectors and glands are anticipated to expand at 10.52% CAGR through 2031.
What end-user vertical holds the largest share today?
IT and telecommunications commanded 28.24% share in 2025.
How are raw-material price swings affecting suppliers?
Volatility in galvanized steel and PVC pricing compresses margins, leading vendors to shorten quote validity and explore composite alternatives.
Why are underground installations gaining traction?
Grid-hardening and renewable-energy transmission projects favor buried systems, which are forecast to grow at 10.48% CAGR.