
Butyric Acid Market Size and Share
Market Overview
| Study Period | 2021 - 2031 |
|---|---|
| Market Volume (2026) | 58.87 kilotons |
| Market Volume (2031) | 83.14 kilotons |
| Growth Rate (2026 - 2031) | 7.15 % |
| Fastest Growing Market | Asia Pacific |
| Largest Market | Asia Pacific |
| Market Concentration | Medium |
Major Players *Disclaimer: Major Players sorted in no particular order Image © Mordor Intelligence. Reuse requires attribution under CC BY 4.0. | |
Butyric Acid Market Analysis by Mordor Intelligence
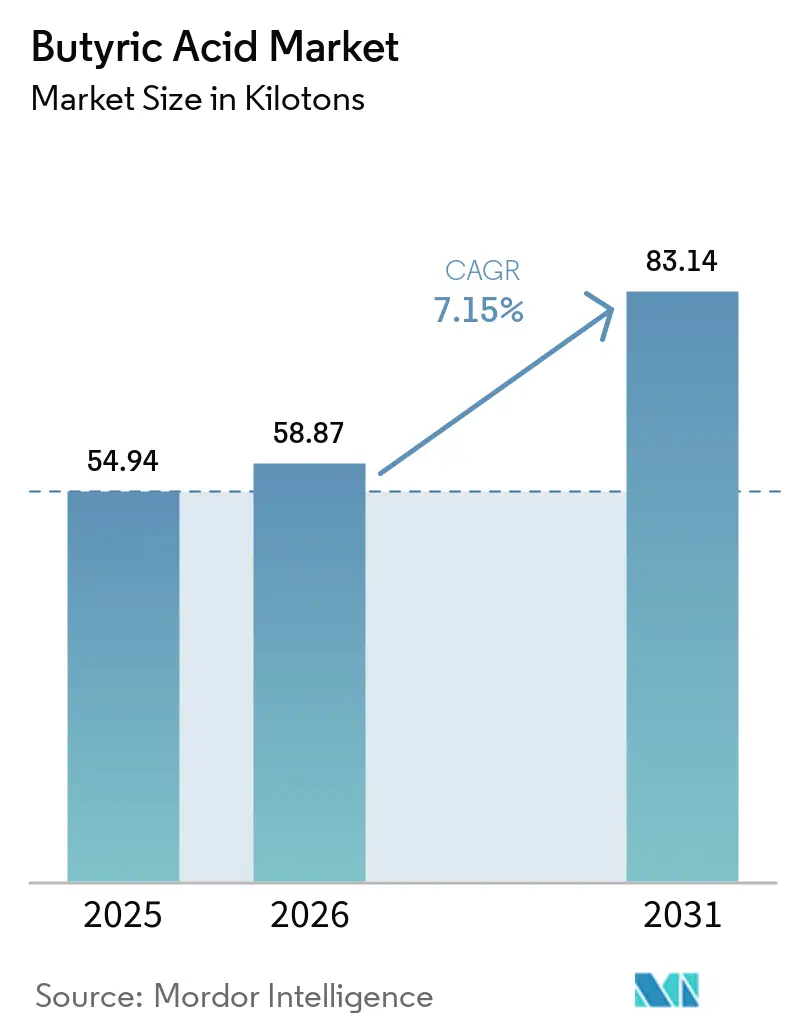
The Butyric Acid Market size was estimated at 54.94 kilotons in 2025 and is estimated to grow from 58.87 kilotons in 2026 to reach 83.14 kilotons by 2031, at a CAGR of 7.15% during the forecast period (2026-2031). Heightened demand for precision-livestock feed additives, clean-label food preservatives, and pharmaceutical-grade short-chain fatty acids underpins this steady climb. Synthetic routes remain dominant because of scale efficiencies, yet incremental carbon-pricing mechanisms and brand commitments to circular sourcing continue to steer investment toward renewable fermentation capacity. Food formulators favor butyric esters that deliver authentic butter notes while lowering reliance on synthetic diacetyl, whereas clinical developers value the compound’s histone-deacetylase-inhibiting properties in gastrointestinal therapeutics. Nevertheless, price swings in butanol and propylene feedstocks, coupled with stringent odor-abatement requirements, keep operating costs volatile and pose barriers for new entrants.
Key Report Takeaways
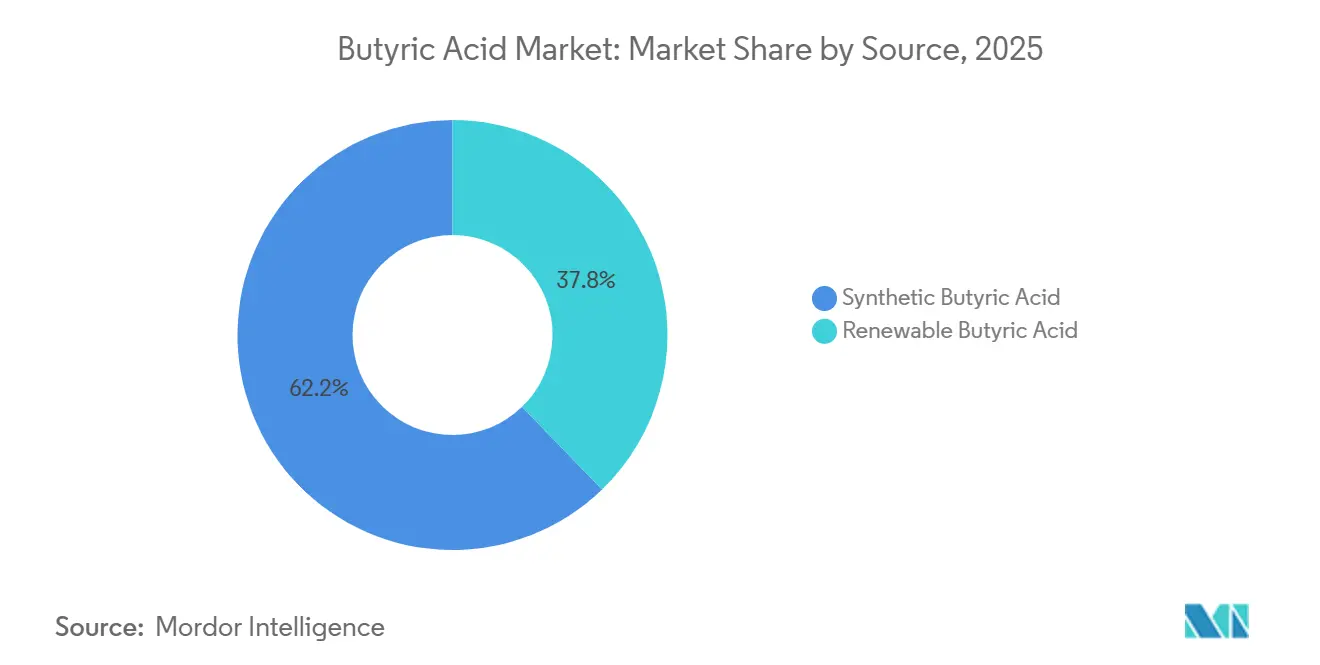
- By source, synthetic butyric acid accounted for 62.24% of the Butyric Acid market share in 2025, while renewable butyric acid is projected to expand at an 8.92% CAGR through 2031.
- By grade, food grade led with 40.67% share in 2025, whereas pharmaceutical grade is forecast to post a 9.10% CAGR during 2026-2031.
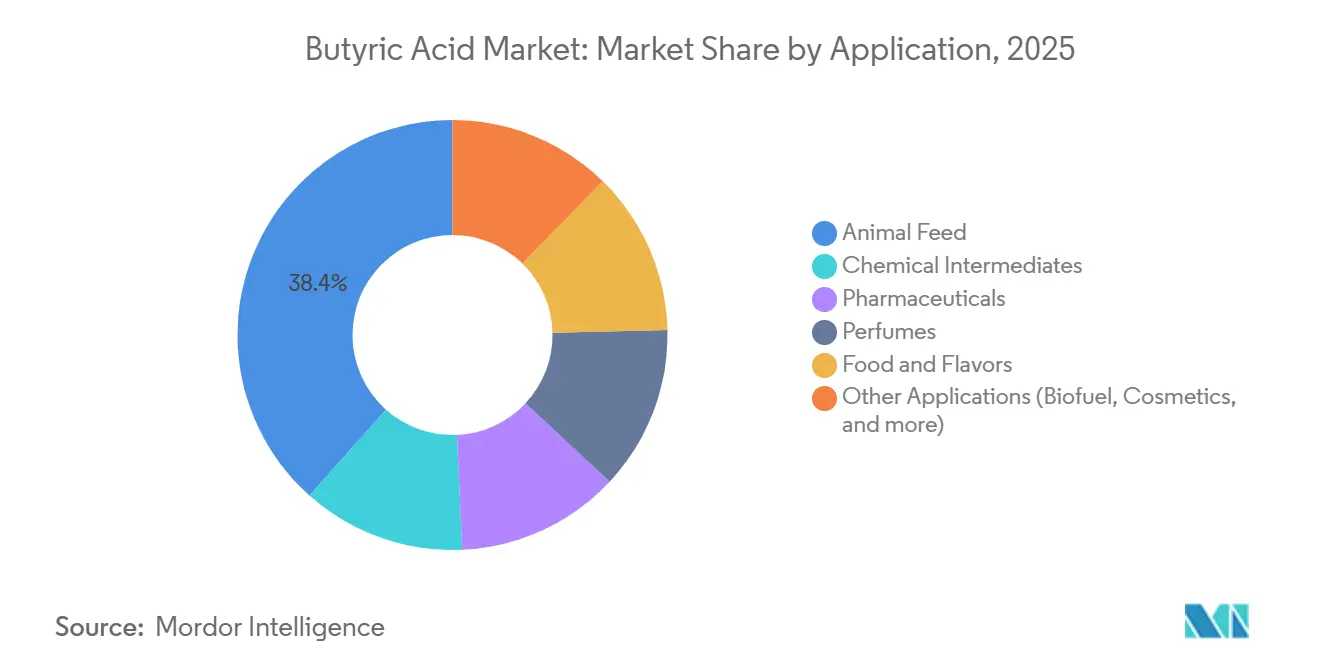
- By application, animal feed held 38.41% of the Butyric Acid market size in 2025 and is set to grow at a 9.61% CAGR to 2031.
- By geography, Asia-Pacific commanded 38.82% share of the Butyric Acid market in 2025, and the region is expected to progress at an 8.14% CAGR over the forecast window.
Note: Market size and forecast figures in this report are generated using Mordor Intelligence’s proprietary estimation framework, updated with the latest available data and insights as of January 2026.
Market Trends and Insights
Drivers Impact Analysis of Butyric Acid Market*
| Driver | (~) % Impact on CAGR Forecast | Geographic Relevance | Impact Timeline |
|---|---|---|---|
| Growing utilization in animal-feed gut-health additives | +2.8% | Global, led by Asia-Pacific and North America | Medium term (2–4 years) |
| Demand as natural flavoring & clean-label preservative | +1.5% | North America & Europe | Short term (≤2 years) |
| Pharma interest in SCFA-based therapeutics & pro-drugs | +1.2% | North America & Europe | Long term (≥4 years) |
| Adoption of precision-livestock farming enabling butyrate-based tools | +1.0% | Asia-Pacific core, spill-over to South America | Medium term (2–4 years) |
| Circular bio-economy push: fermentation of ag-waste to butyrate | +0.9% | Global, early gains in China, Europe, Brazil | Long term (≥4 years) |
| Source: Mordor Intelligence | |||
Growing Utilization in Animal-Feed Gut-Health Additives
Regulatory bans on growth-promoting antibiotics in Europe and voluntary phase-outs in North America have accelerated the switch to sodium butyrate and tributyrin, which improve intestinal barrier function and microbiome balance, translating into 5%–8% stronger feed conversion ratios. Precision-feeding platforms dose protected butyrate in real time, lifting per-animal consumption by up to 15% over static rations. Kemin Industries disclosed a 22% year-over-year rise in protected butyrate sales into Asian aquaculture during 2025 as shrimp farmers sought antibiotic-free mortality control[1]. China’s Ministry of Agriculture streamlined additive registrations in 2025, triggering local fermentation capacity additions due online in 2027.
Demand as Natural Flavoring & Clean-Label Preservative
Food manufacturers in the United States and European Union continue to replace synthetic diacetyl with butyric acid esters to satisfy transparent-label expectations. The US Food and Drug Administration reaffirmed the compound’s GRAS status for flavoring in 2024, and the European Food Safety Authority removed concentration caps on butyrate esters for dairy applications in 2025[2]. Formulators report being able to cut potassium sorbate loadings by 30% when leveraging butyric acid’s mild antimicrobial action, reducing both cost and label length. Clean-label positioning propelled a 12% jump in North American and European food-grade demand during 2025.
Pharma Interest in SCFA-Based Therapeutics & Pro-Drugs
Phase II clinical data published in 2025 showed enteric-coated sodium butyrate tablets lowering ulcerative colitis activity scores by 40% against placebo, stimulating investigational new drug applications for butyrate-centered therapies. Pro-drug versions such as tributyrin enhance systemic bioavailability by bypassing rapid hepatic metabolism, while high-purity feedstock must meet stringent USP or Ph.Eur. heavy-metal and solvent specifications. Merck KGaA’s launch of ≥99.5%-pure butyric acid in 2024 underscores confidence in impending regulatory approvals.
Adoption of Precision-Livestock Farming Enabling Butyrate-Based Productivity Tools
Sensor-equipped feeding lines and wearable gut-health trackers let producers titrate butyrate inclusion in response to live inflammatory markers, trimming overuse during low-stress periods and intensifying supplementation during weaning or heat stress. A 2025 journal study found that dynamic dosing reduced feed cost per kilogram of broiler weight gain by 8% compared to fixed protocols. Swine nurseries recorded three-point mortality reductions when applying targeted butyrate delivery in the first 10 days post-weaning. Asia-Pacific integrators increasingly employ blockchain tracing to certify antibiotic-free meat, commanding 15%–20% export premiums in Japan and South Korea.
Restraints Impact Analysis of Butyric Acid Market*
| Restraint | (~) % Impact on CAGR Forecast | Geographic Relevance | Impact Timeline |
|---|---|---|---|
| Volatile butanol & propylene feedstock prices | -1.8% | Global | Short term (≤2 years) |
| Odor-control & handling challenges limiting plant adoption | -1.0% | Global, acute in densely populated regions | Medium term (2–4 years) |
| Competition from propionic & valeric acids in feed and preservation | -0.7% | Global, strongest in cost-sensitive markets | Short term (≤2 years) |
| Source: Mordor Intelligence | |||
Volatile Butanol & Propylene Feedstock Prices
Petrochemical routes tie production costs to butanol and propylene spot prices, which swung 25% in early 2025 amid US Gulf Coast and Middle East refinery outages, squeezing margins for producers lacking long-term contracts. Chinese electrolytic pathways starting from maleic anhydride also experienced a 12% cost hike after domestic butane shortages. While fermentation insulation exists, current separation costs keep renewable butyric acid near the upper end of competitive price bands outlined in a 2025 techno-economic study.
Odor-Control & Handling Challenges Limiting Plant Adoption
The compound’s rancid-butter odor is detectable at parts-per-billion, necessitating sealed reactors, vapor scrubbers, and specialized storage, adding 20%–30% to greenfield capital outlays. A proposed 15,000-tonne German plant required a EUR 4 million odor-abatement upgrade before permitting approval in 2024. Downstream additive suppliers rely on lipid microencapsulation to mask odor, adding USD 0.80–1.20 per kilogram to finished product cost. Tokyo Chemical Industry’s SDS lists the flash point at 75°C and a corrosive classification, underlining stringent handling needs.
*Our forecasts treat driver/restraint impacts as directional, not additive. The impact forecasts reflect baseline growth, mix effects, and variable interactions.
Butyric Acid Market Segment Analysis
By Source:
Renewable Routes Gain Traction Amid Sustainability MandatesSynthetic pathways controlled 62.24% of total volume in 2025, reflecting mature propylene-oxidation infrastructure. Nevertheless, renewable butyric acid is rising at an 8.92% CAGR as carbon pricing and circular-bioeconomy targets push brands to decouple from fossil feedstocks. The butyric acid market size for renewable supply is projected to expand from 22.2 kilotons in 2026 to 36.3 kilotons by 2031, equating to 44% of incremental demand. Fermentation titers exceeding 70 g/L have been demonstrated, yet downstream separation still represents around 60% of total cost. The butyric acid market share for synthetic feedstock could slip below 55% by 2031 if European carbon tariffs and Chinese subsidy programs materialize as scheduled.
Renewable developers are forging partnerships with municipal waste processors, exemplified by Perstorp’s Swedish demonstration plant that ferments sorted food waste to pharmaceutical-grade butyric acid. China’s Ministry of Industry and Information Technology embedded butyric acid in its 2024–2027 Fine Chemical Innovation Plan, offering tax rebates and pilot funding for non-food biomass routes. Synthetic producers retain an edge on cost and scale for industrial-grade sales, but brand owners in food and pharma now pay premiums of 15%–25% for verified renewable material.
By Grade:
Pharmaceutical Purity Commands Premium as Therapeutic Pipelines AdvanceFood-grade butyric acid accounted for 40.67% of 2025 demand, supplying butter-flavor esters and clean-label preservatives. Pharmaceutical-grade volumes remain smaller but carry gross margins roughly double those of food-grade. The butyric acid market size for pharmaceutical applications is forecast to climb from 5.9 kilotons in 2026 to 9.7 kilotons in 2031, reflecting a 9.10% CAGR. Clinical trials have moved into Phase III for ulcerative colitis, and drug sponsors require more than or equal to 99.5% purity and sub-ppm heavy-metal limits. Merck and Tokyo Chemical Industry expanded chromatography capacity during 2024–2025 to service this exacting niche.
Industrial-grade users, particularly cellulose butyrate and plasticizer manufacturers, value price over purity, purchasing products that permit higher aldehyde content. Regulatory tailwinds may eventually raise baseline purity thresholds even for industrial buyers, narrowing the cost gap but benefiting players with existing high-purity infrastructure. Food-grade remains the largest slice of the butyric acid market, but pharmaceuticals deliver the strongest profit uplift per unit of installed capacity.
By Application:
Animal Feed Leads Volume and Growth as Antibiotic Alternatives Gain TractionAnimal feed held 38.41% of 2025 consumption and is expanding at a 9.61% CAGR, bolstered by antimicrobial resistance regulations and rising protein demand in Asia. The butyric acid market share for feed additives is projected to grow as precision-dosing platforms integrate real-time gut-health data, raising per-animal inclusion rates. Kemin Industries reported double-digit annual growth in protected butyrate adoption among Vietnamese and Thai shrimp farms, confirming cross-species applicability.
Chemical intermediates captured roughly one-quarter of volumes, but their cyclical link to downstream polymer demand tempers growth prospects. Food-flavor esters market share is underpinned by clean-label bakery and dairy reformulations in Europe following EFSA’s positive 2025 opinion.
Perfume applications remain mature and price sensitive. Biofuel pathways that convert butyric acid to 1-butanol or heavier hydrocarbons have cleared technical hurdles, yet remain niche until policy credit values widen.

Geography Analysis
APAC and Europe Butyric Acid Market
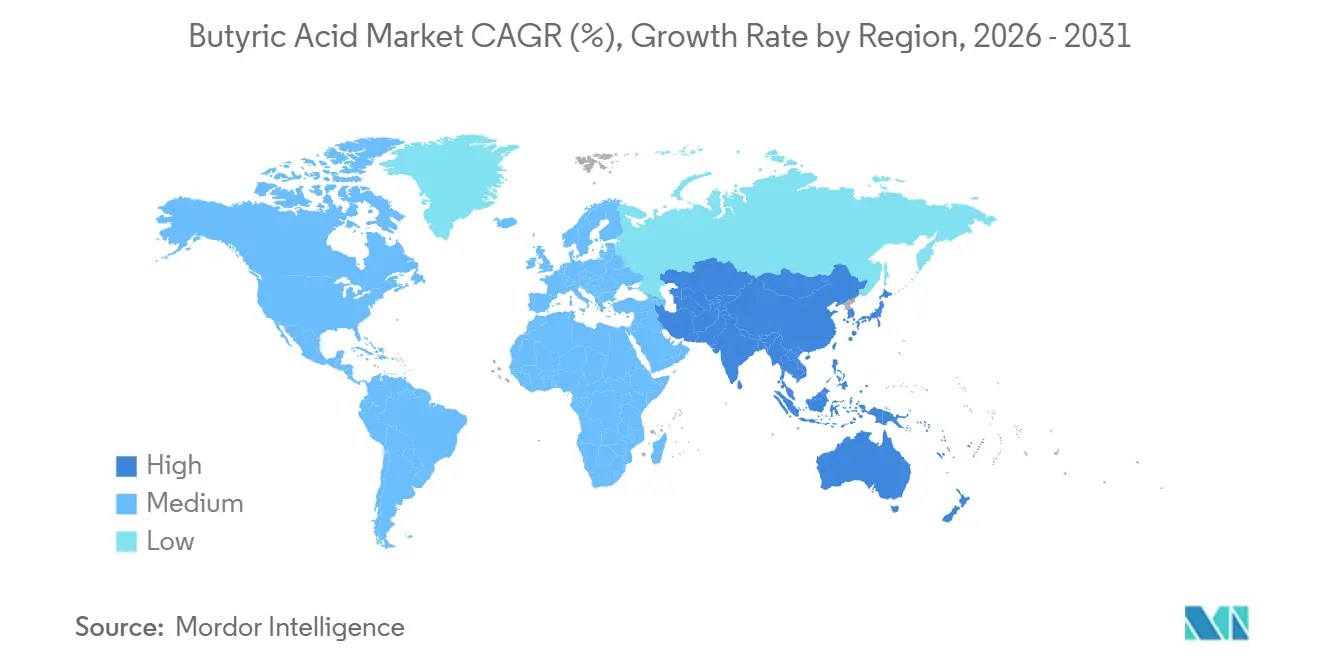
Asia-Pacific retained 38.82% of worldwide demand in 2025 and is on track for an 8.14% CAGR through 2031. China accounts for almost half of global capacity, leveraging proximity to maleic anhydride and butanol feedstocks, while new fermentation projects aim to meet tightening sustainability targets. India’s poultry expansion, coupled with antibiotic-restriction policies, adds 1,200–1,500 tonnes per year of incremental butyrate demand. Japanese and South Korean pharmaceutical importers rely on high-purity products from Tokyo Chemical Industry and European partners. A gradual shift to renewable sourcing is expected as Chinese provinces implement carbon-trading schemes and Europe applies border adjustments.
North America Butyric Acid Market
US producers such as Eastman Chemical invest in high-chromatography purification to meet clinical-trial needs, leveraging the FDA’s reaffirmed GRAS status for flavoring applications. Europe’s circular-economy directives provide grants for waste-fed fermentation plants, epitomized by Perstorp’s Swedish demo unit. Precision-livestock platforms that modulate butyrate based on gut-health biomarkers expand rapidly in the U.S. broiler and swine sectors, supporting annual feed-grade growth.
South America and MEA Butyric Acid Market
South America benefits from Brazil’s broiler export ambitions and Argentina’s recovery in animal husbandry investment. Producers test protected-butyrate feed additives to satisfy European importers’ antibiotic-free requirements. In the Middle East and Africa, Saudi Arabia and South Africa are scaling the dairy and poultry sectors. Infrastructure constraints and climate factors slow adoption relative to other regions, yet pharmaceutical imports continue to rise.
Value Chain Analysis
The butyric acid value chain starts with upstream feedstocks and utilities. Synthetic production economics are closely tied to petrochemical inputs such as propylene-derived intermediates and the butanol or butyraldehyde chains, which leaves producers exposed to feedstock volatility like the kind seen in early 2025. Renewable routes draw on sugars and biomass streams (for example, glucose, molasses, and lignocellulosic residues) fermented using strains such as Clostridium tyrobutyricum, but downstream separation remains a key cost and scale-up constraint, alongside odor-control hardware and permitting requirements.
Midstream, merchant producers (including Eastman Chemical Company, OXEA GmbH, Celanese Corporation, BASF, and Perstorp) supply food, industrial, and pharmaceutical grades through a mix of direct contracts and specialty chemical distribution, with large-volume buyers typically purchasing under multi-year agreements. Downstream demand concentrates in animal nutrition and formulation players that convert butyric acid into feed solutions (including protected or microencapsulated formats), and in flavor houses formulating butyrate esters for dairy and bakery notes. These customers prioritize traceability, consistent odor specification, and compliance (GMP and food-safety systems for food and pharma supply). Key bottlenecks include purification capacity for higher grades and logistics infrastructure designed for corrosive, odor-intensive materials, such as sealed handling, vapor management, and dedicated storage.
Competitive Landscape
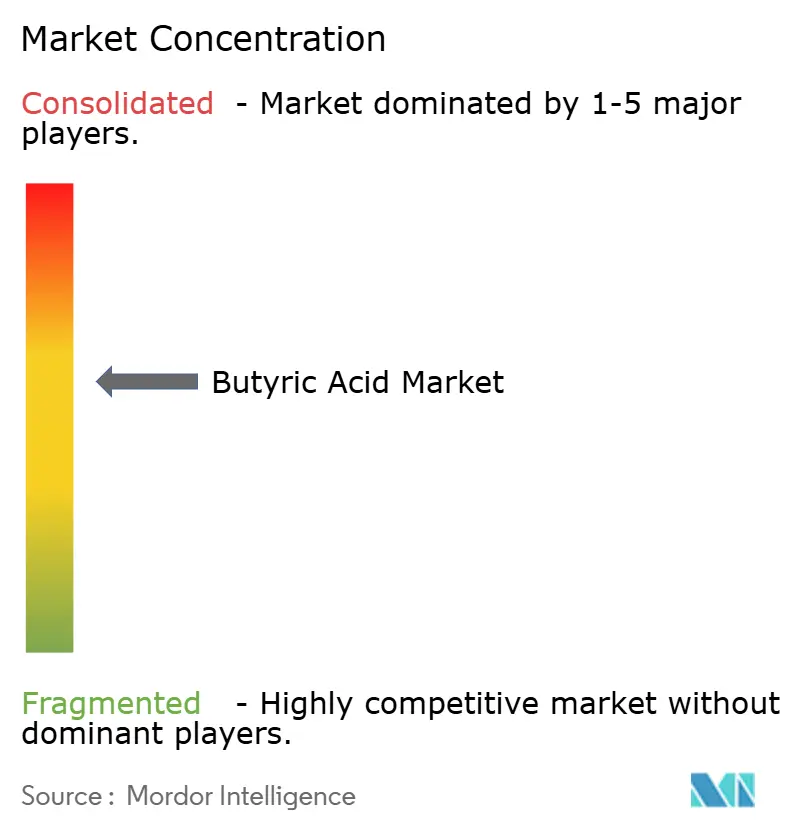
The Butyric Acid market exhibits a moderate concentration. Rising renewable entrants such as Kemin Industries and multiple Chinese biorefineries target fermentation niches backed by policy incentives. BASF’s green-hydrogen integration plan at Ludwigshafen could halve CO₂ intensity and protect its premium in low-carbon markets. Innovative white-space includes odor-masking encapsulation for feed additives and pro-drug chemistry that releases butyric acid in the colon. Patent filings highlight membrane separation and in-situ product removal as cost-cutting levers for fermentation plants, with a 2025 study projecting 20%–25% unit-cost reductions once energy-efficient separations move to industrial scale.
Butyric Acid Industry Leaders
-
Eastman Chemical Company
-
OXEA GmbH
-
Perstorp
-
BASF
-
Celanese Corporation
- *Disclaimer: Major Players sorted in no particular order
Butyric Acid Market Companies Covered in this Report
- Axxence Aromatic GmbH
- BASF
- Beijing Huamaoyuan Fragrance Flavor Co.,Ltd
- Celanese Corporation
- Eastman Chemical Company
- Haihang Industry Co., Ltd.
- Kemin Industries, Inc.
- Merck
- OXEA GmbH
- Perstorp
- Snowco
- Spectrum Chemical
- Thermo Fisher Scientific Inc.
- Tokyo Chemical Industry Co., Ltd.
- Yufeng International Group Co., Ltd.
Market Opportunities and Future Outlook
Near-term whitespace is concentrated on de-risking supply and upgrading product formats for feed and regulated end uses, where buyers pay for consistency, documentation, and performance rather than commodity pricing. Large livestock and aquaculture integrators are substituting sub-therapeutic antibiotics with organic-acid solutions, which pulls demand toward protected-butyrate systems and tighter origin certification, particularly in Europe and in export-oriented Asia-Pacific production chains. In food and flavors, EFSA actions in 2025 that eased constraints on butyrate esters in dairy applications support reformulation activity that shifts demand toward consistent food-grade supply and ester-grade intermediates.
Renewable and circular sourcing also creates an opportunity for fermentation producers that can pair lower-carbon feedstocks with credible mass-balance and chain-of-custody documentation. Corporate activity such as Perstorp's Asia expansion (including its India facility inauguration in November 2024) and commercialization steps like the March 2025 METEX NOOVISTA and ALINOVA agreement for 100% bio-based butyric acid in animal nutrition in France point to market pull for differentiated, bio-based offerings. On the technology side, published techno-economic work that highlights material cost and emissions advantages when integrating first-generation and lignocellulosic feedstocks strengthens the business case for projects that combine higher fermentation productivity with improved separations, particularly for customers seeking measurable carbon reductions without changing away from existing butyrate-based formulations.
Recent Industry Developments in Butyric Acid Market
- April 2026: Eastman Chemical Company announced a price increase of USD 0.05 per pound for selected acids effective April 1, 2026, or as contracts allow. The announcement signals continued cost pressure in merchant acid supply and can tighten procurement strategies for buyers using butyric acid in feed and flavor intermediates. Contractual pass-through mechanisms also gain importance as purchasers seek to stabilize input costs.
- March 2026: Perstorp Oxo AB implemented price increases for n-butyric acid globally, including a USD 0.03 per pound increase in the United States effective March 1, 2026. Repeated adjustments by large suppliers reinforce the market shift toward formula-based and multi-month contracting, particularly for customers exposed to petrochemical and energy variability. The announcements also show how producers are protecting margin while maintaining global availability.
- December 2024: Perstorp Oxo AB announced a price increase for butyric acid and valeric acid effective January 1, 2025, or as existing contracts allowed. The timing aligned with rising cost environments and set a baseline for 2025 contract resets across parts of the oxo acids chain. Such actions can accelerate downstream efforts to qualify alternate suppliers and to optimize dosage and encapsulation choices in animal nutrition applications.
Butyric Acid Market Report Scope and Research Methodology
Market Definition and Coverage
For this study, the market covers sales of straight-chain butyric acid (C4) supplied to end users for industrial, feed, food, fragrance, and regulated pharma uses, counted as product volume traded and consumed.
Scope exclusions: We exclude isobutyric acid, butyrate salts and esters (such as sodium, calcium, or ethyl butyrates), and captive in-house transfers that are not commercially sold.
Segments Covered in This Report
- By Source
- Renewable Butyric Acid
- Synthetic Butyric Acid
- By Grade
- Food Grade
- Industrial Grade
- Pharmaceutical Grade
- By Application
- Chemical Intermediates
- Animal Feed
- Pharmaceuticals
- Perfumes
- Food and Flavors
- Other Applications (Biofuel, Cosmetics, etc.)
- By Geography
- Asia-Pacific
- China
- India
- Japan
- South Korea
- Rest of Asia-Pacific
- North America
- United States
- Canada
- Mexico
- Europe
- Germany
- United Kingdom
- France
- Italy
- Rest of Europe
- South America
- Brazil
- Argentina
- Rest of South America
- Middle-East and Africa
- Saudi Arabia
- South Africa
- Rest of Middle-East and Africa
- Asia-Pacific
Data Sources, Market Sizing, and Validation
Desk Research
Desk work started with a simple map of the value chain, then we pulled public signals on where butyric acid volume is produced and where it is absorbed.
For trade and external reference points, we used trade and tariff statistics from agencies such as UN Comtrade, industrial classification notes and manufacturing data from agencies such as the US Census Bureau, and chemical safety and regulatory listings such as the US EPA and ECHA.
To keep assumptions realistic, we also reviewed peer-reviewed chemistry and fermentation literature for yield and process trends, along with association and conference materials that cover flavors, feed additives, and chemical intermediates. Company annual reports, product brochures, and investor presentations were used to confirm purity positioning and typical end-use statements. When needed, we checked a paid database subscription for company financials and a separate subscription for patent activity to spot technology shifts that could change supply additions.
These desk sources are illustrative, and we also relied on other public references for data collection, cross-checks, and clarification.
Primary Interviews and Surveys
Primary work focused on validating how much volume is actually sold into open markets versus moved internally, and on obtaining practical ranges for application shares that are not visible in public statistics. We spoke with producers, distributors, and downstream formulators across the main consuming regions so that grade, purity, and use-case splits could be checked and then refined before finalizing the model.
Distribution of primary research fieldwork respondents
| Company type | Respondent position | Region |
|---|---|---|
| Top tier: 32% | CXOs: 15% | APAC: 45% |
| Mid tier: 53% | Functional/Unit leaders: 25% | EMEA: 35% |
| Smaller Players: 15% | Managers: 60% | Americas: 20% |
Market-Sizing & Forecasting
The core sizing uses a top-down approach where production, trade, and end-use demand signals are rebuilt into an addressable demand pool for commercial butyric acid, then converted into annual kilotons.
In parallel, totals are corroborated using selective bottom-up checks, such as sampled supplier capacity and utilization, distributor channel feedback, and typical application-side volume ranges. If those checks flagged gaps, we adjusted the model inputs rather than forcing a match.
Inputs that mattered in this market included estimated operating rates for oxo and fermentation routes, reported expansions and shutdown timings, purity and grade mix that affects what can be sold into food or pharma uses, the share of demand linked to animal nutrition additives, and chemical intermediate consumption tied to downstream activity. When a variable was not available consistently by country, we used regional proxies that were validated in interviews, and we kept the assumptions visible in the model.
For forecasting, we ran scenario analysis around capacity additions, route economics, and adoption speed for renewable supply. The final run was selected after it matched the direction and magnitude expected by market participants for the next five years.
Data Validation & Update Cycle
Results are checked through multiple passes so the final volume curve does not contradict basic reality checks, such as trade direction, known plant scale, and downstream pull.
When outliers appear, we re-check the underlying drivers, and if needed we return to respondents to confirm whether the difference is structural or mainly timing noise.
Before sign-off, the model is reviewed by another analyst to confirm that conversions, unit logic, and application splits remain consistent across regions. Reports refresh annually, with interim updates when material events occur, such as a major capacity announcement, route change, or regulation shift. Right before delivery, a final pass is completed so clients receive the latest updated view.
Mordor Intelligence's Butyric Acid Market Size Compared Against Other Published Estimates
Published market sizes for butyric acid often do not line up because some studies count the market in revenue while others report only volume, and the included product boundaries are not always the same. Differences also come from how captive use is treated, what purity level is assumed, and whether salts and esters are quietly included.
Trade flow direction, announced plant capacities, and application-side consumption checks are the signals that anchor Mordor Intelligence to a commercial-volume view of butyric acid, which will not match value-based estimates that blend pricing with broader product families.
Benchmark comparison
| Source | Market Size | Gaps in Research Methodology |
|---|---|---|
| Mordor Intelligence | USD 58.87 M (2026) | |
| Industry Publisher A | USD 405.11 M (2024) | This figure is reported in revenue terms, which can embed price assumptions and may also reflect broader inclusion of butyrate derivatives or wider purity ranges that lift the addressable total. |
| Industry Publisher B | USD 319.60 M (2024) | The estimate is value-based and its growth curve can shift materially depending on the price path used, currency timing, and whether internal transfers or adjacent butyrate forms are counted as part of the market. |
The spread in the table is mainly explained by unit choice and scope edges, not by a simple disagreement on underlying demand direction. By keeping the market boundary tied to commercial butyric acid volumes and then checking totals against observable supply and consumption signals, the final number stays traceable to clear inputs and repeatable steps.
Key Questions Answered in the Report
What is current market size of Butyric Acid Market?
The Butyric Acid Market size was estimated at 54.94 kilotons in 2025 and is estimated to grow from 58.87 kilotons in 2026 to reach 83.14 kilotons by 2031, at a CAGR of 7.15% during the forecast period (2026-2031).
Which region is expected to lead the Butyric Acid Market through 2031?
Asia-Pacific is expected to remain the leading region. It accounted for 38.82% of worldwide demand in 2025 and is projected to grow at an 8.14% CAGR through 2031.
What are the major challenges facing the butyric acid market?
Major challenges include the strong and unpleasant odor of butyric acid, fluctuations in raw-material prices, handling and storage requirements, and environmental and regulatory considerations associated with chemical production.
Why is pharmaceutical-grade butyric acid important?
Pharmaceutical-grade butyric acid is important because it meets strict purity and quality standards required for pharmaceutical and clinical applications.