
Business Valuation Service Market Size and Share
Market Overview
| Study Period | 2020 - 2031 |
|---|---|
| Market Size (2026) | USD 4.16 Billion |
| Market Size (2031) | USD 5.69 Billion |
| Growth Rate (2026 - 2031) | 6.46 % |
| Fastest Growing Market | Asia-Pacific |
| Largest Market | North America |
| Market Concentration | High |
Major Players *Disclaimer: Major Players sorted in no particular order Image © Mordor Intelligence. Reuse requires attribution under CC BY 4.0. | |
Business Valuation Service Market Analysis by Mordor Intelligence
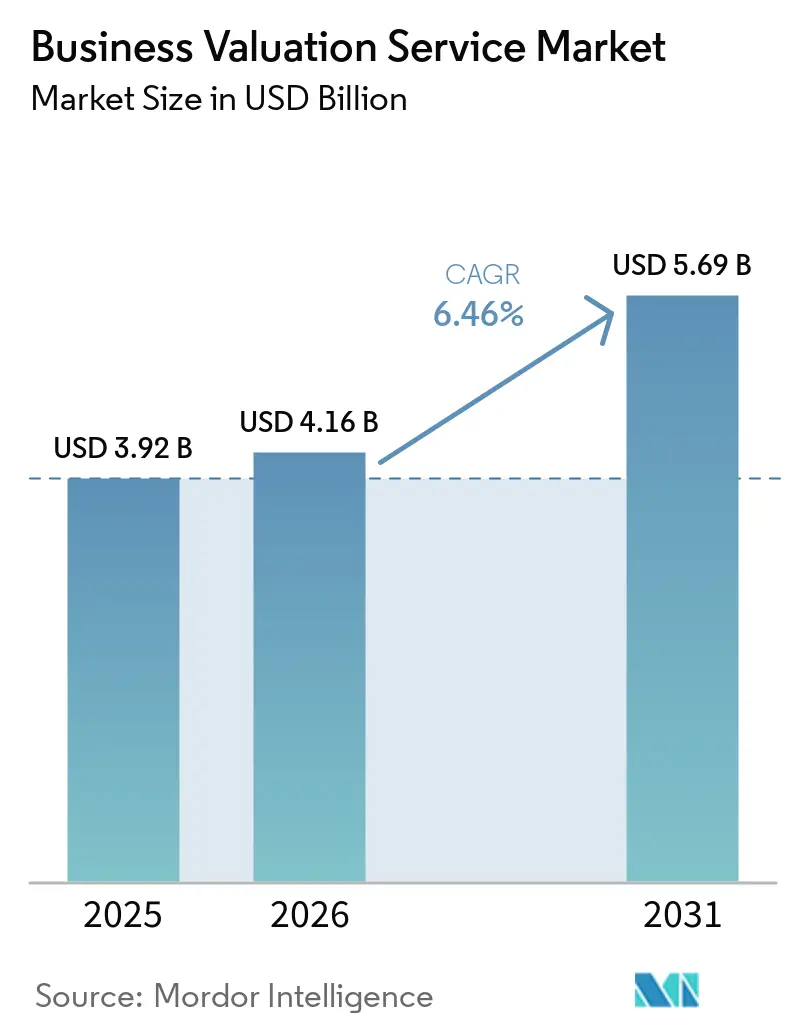
The Business Valuation Service Market size was valued at USD 3.92 billion in 2025 and is estimated to grow from USD 4.16 billion in 2026 to reach USD 5.69 billion by 2031, at a CAGR of 6.46% during the forecast period (2026-2031).
Demand is supported by fair-value accounting requirements, more complex intangible-asset portfolios, and the expansion of private credit. Global M&A volume reached USD 3.2 trillion in the first half of 2026, up 44% year over year, while cross-border deal value reached USD 820 billion, up 63%. These transactions require fairness opinions, purchase-price allocation studies, and tax-basis step-up analyses. The business valuation service market also benefits from larger and more complex deals, which need deeper work on intangible assets, complex securities, and multiple jurisdictions. Providers are responding through specialist hiring, technology investment, and recurring service models for funds and private-market investors.
Key Report Takeaways
- By purpose, financial reporting and fund fair value captured 33.87% of the business valuation service market share in 2025, while the same segment is projected to grow at 8.12% CAGR through 2031.
- By engagement product, valuation engagement captured 47.56% of the business valuation service market share in 2025, while recurring portfolio or NAV Mark is projected to grow at 8.45% CAGR through 2031.
- By provider type, accounting and professional-services networks captured 35.76% of the business valuation service market share in 2025, while independent practitioners and registered-valuer entities are projected to grow at 7.78% CAGR through 2031.
- By client type, operating companies and issuers captured 36.96% of the business valuation service market share in 2025, while alternative-asset managers and vehicles are projected to grow at 8.62% CAGR through 2031.
- By end-user industry, technology, media, and telecommunications captured 20.09% of the business valuation service market share in 2025, while the same segment is projected to grow at 7.92% CAGR through 2031.
- By geography, North America captured 49.68% of the business valuation service market share in 2025, while Asia-Pacific is projected to grow at 9.12% CAGR through 2031.
Note: Market size and forecast figures in this report are generated using Mordor Intelligence’s proprietary estimation framework, updated with the latest available data and insights as of January 2026.
Global Business Valuation Service Market Trends and Insights
Drivers Impact Analysis*
| Driver | (~) % Impact on CAGR Forecast | Geographic Relevance | Impact Timeline |
|---|---|---|---|
| Increasing M&A, Private Equity and Corporate Transaction Activity | +2.2% | Global, concentrated in North America and Western Europe | Short term (≤ 2 years) |
| Growing Financial Reporting and Regulatory Demand for Independent Business Valuations | +1.4% | Global, North America and the European Union lead adoption | Medium term (2-4 years) |
| Rising Valuation Requirements for Intangible, Complex and Hard-to-Value Businesses | +0.9% | Global, Asia-Pacific is gaining rapidly | Long term (≥ 4 years) |
| Expansion of Private Markets and Unquoted Company Investments | +0.6% | North America, Europe, and Asia-Pacific | Medium term (2-4 years) |
| Increasing Cross-Border Tax, Restructuring and Commercial Dispute Activity | +0.5% | Global, with Asia-Pacific and Middle East and Africa spillover | Medium term (2-4 years) |
| Greater Adoption of Data, Analytics and Digital Tools in Valuation Delivery | +0.4% | Global | Long term (≥ 4 years) |
| Source: Mordor Intelligence | |||
Increasing M&A, Private Equity and Corporate Transaction Activity
Global M&A value reached USD 3 trillion in 2025, up 31% from 2024, and rose to USD 3.2 trillion in H1 2026. Private equity also has a large exit backlog, with about 32,000 portfolio companies awaiting sale and an estimated USD 3.8 trillion backlog[1]J.P. Morgan, “2026 Global M&A Mid-Year Outlook,” J.P. Morgan Investment Banking, jpmorgan.com. Private equity dry powder of USD 2.2 trillion supports continuation vehicles, carve-outs, and structured exits. These transactions require independent valuations, fairness opinions, purchase-price allocations, and complex securities analysis. Cross-border and multi-party transactions further increase valuation complexity. This supports demand for specialized business valuation providers.
Growing Financial Reporting and Regulatory Demand for Independent Business Valuations
ASC 820 and IFRS 13 require fair-value measurement for many financial and non-financial assets, creating recurring valuation requirements[2] IFRS Foundation, “IFRS 13 Fair Value Measurement,” IFRS Foundation, ifrs.org. Level 3 assets require significant judgment because observable market inputs are limited. Growing private-market investments and complex assets increase demand for independent valuation and supporting documentation. AI-related investments, energy-transition assets, and other difficult-to-value positions further expand this requirement. The American Institute of Certified Public Accountants and the National Association of Certified Valuators and Analysts have also issued guidance on responsible AI use in valuation and forensic engagements. These requirements strengthen demand for credentialed providers with robust documentation and audit support.
Rising Valuation Requirements for Intangible, Complex and Hard-to-Value Businesses
Global intangible investment exceeded USD 10 trillion in 2025, highlighting the growing importance of intangible assets in corporate value[3]World Intellectual Property Organization, “World Intangible Investment Highlights 2026,” World Intellectual Property Organization, wipo.int. AI models, proprietary datasets, software, and digital rights often lack observable market prices, requiring income-based valuation and significant professional judgment. The European Group of Valuers' Associations issued an exposure draft for European Business Valuation Standards for Intangible Assets in February 2026. The World Intellectual Property Organization and other organizations also launched the Intangible Asset Valuation Network in 2026. These developments point toward greater standardization and documentation requirements. Rising AI acquisitions and technology-licensing activity should further increase demand for specialist intangible-asset valuation.
Expansion of Private Markets and Unquoted Company Investments
Private equity, private credit, and other private-market investments require recurring valuations because they lack readily observable market prices. Moody's projected private credit assets under management to exceed USD 2 trillion in 2026, supporting continued demand for valuation services[4]Moody’s, “Will Private Credit Maintain Its Momentum in 2026,” Moody’s CreditView, moodys.com. Quarterly and semiannual reporting requirements create recurring assignments beyond transaction-driven work. Evergreen and perpetual-capital funds further increase the need for repeated independent net asset value assessments. Greater scrutiny from investors and regulators also increases demand for independent and defensible valuations. This creates opportunities for providers with private-market data, fund expertise, and independent advisory capabilities.
Restraints Impact Analysis*
| Restraint | (~) % Impact on CAGR Forecast | Geographic Relevance | Impact Timeline |
|---|---|---|---|
| Shortage of Experienced and Credentialed Business Valuation Professionals | -1.2% | Global, most acute in North America | Short term (≤ 2 years) |
| Fee Pressure on Standardized and Lower-Complexity Valuation Engagements | -0.8% | North America and Europe | Short term (≤ 2 years) |
| Limited Availability of Reliable Comparable and Market Data for Private Businesses | -0.5% | Emerging markets, Asia-Pacific and Middle East and Africa | Medium term (2-4 years) |
| Professional-Liability, Regulatory and Litigation Risk | -0.3% | Global | Medium term (2-4 years) |
| Source: Mordor Intelligence | |||
Shortage of Experienced and Credentialed Business Valuation Professionals
The United States has a limited pool of credentialed business valuation professionals, creating a capacity constraint as demand grows. The American Society of Appraisers notes that business valuation requires specialized education, examination, and experience, while the American Institute of Certified Public Accountants continues to highlight hiring and retention challenges in valuation and forensic services. The ASA Business Valuation designation requires five years of full-time experience, further extending the time needed to develop senior professionals. Competition from private equity and investment management firms can also draw experienced analysts away from valuation practices. Consolidation and acquisitions can help firms build larger specialist teams and structured training programs. The talent shortage supports pricing for complex assignments but limits how quickly providers can expand capacity.
Fee Pressure on Standardized and Lower-Complexity Valuation Engagements
AI-enabled valuation tools are reducing delivery time and marginal costs for standardized assignments such as 409A valuations, goodwill impairment studies, and calculation engagements. This is increasing price transparency and competition, particularly among providers serving mid-market clients. Firms without proprietary technology may face margin pressure while still carrying professional, compliance, and liability costs. In contrast, purchase-price allocations, cross-border valuations, and litigation-support assignments remain more judgment-intensive and command stronger pricing. Larger providers can use automation to compete on routine work while reallocating professionals toward complex engagements. This is creating a widening difference between the economics of standardized and specialist valuation services.
*Our forecasts treat driver/restraint impacts as directional, not additive. The impact forecasts reflect baseline growth, mix effects, and variable interactions.
Segment Analysis
By Purpose: Financial Reporting Mandates Anchor and Accelerate Revenue
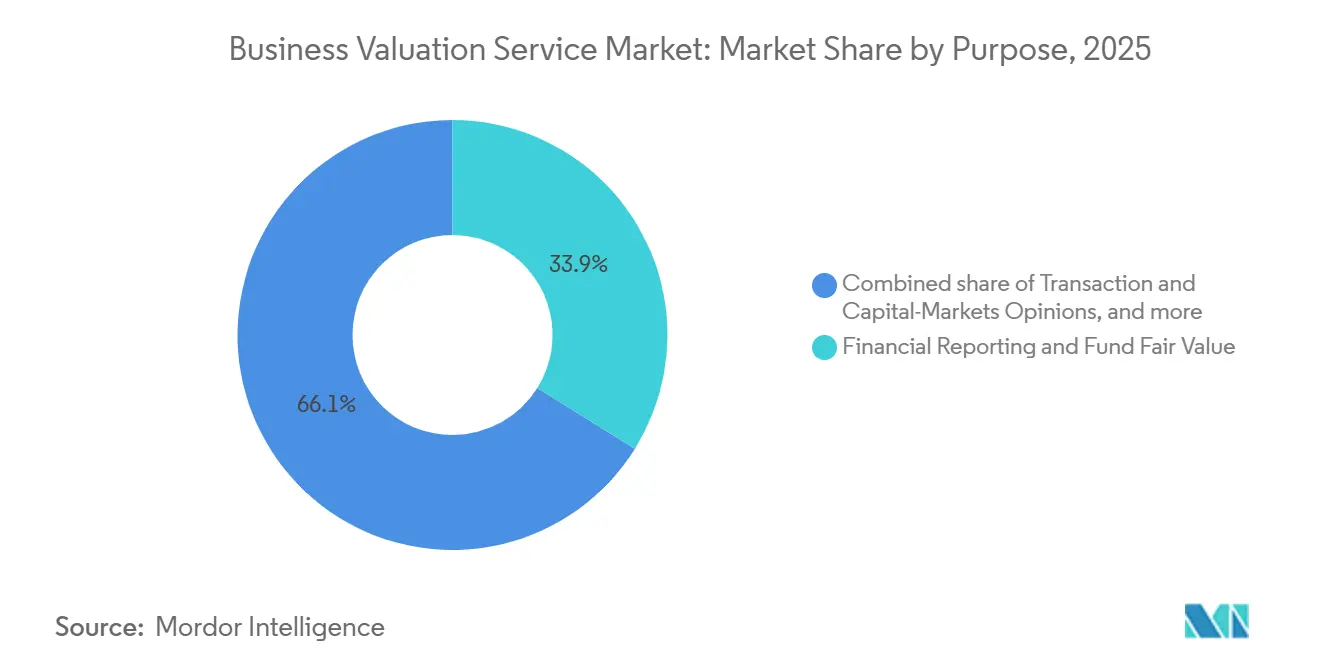
Financial reporting and fund fair value held 33.87% of revenue in 2025 and is forecast to grow at 8.12% CAGR through 2031. This purpose category leads both current scale and forecast growth. Audited financial statements with business combinations, goodwill balances, or fund portfolios require periodic Level 3 fair-value support. ASC 805, ASC 350, and IFRS 3 support requirements that do not disappear when transaction activity slows. Private credit assets under management are projected to exceed USD 2 trillion in 2026. New evergreen and perpetual-capital vehicles add quarterly and semiannual net asset value assignments.
The business valuation service market size for financial reporting and fund fair value is supported by recurring accounting and fund administration needs. Companies also face more difficult Level 3 assumptions related to artificial intelligence investments, energy-transition costs, and global minimum-tax rules. This adds to auditor demand for specialist support. Transaction and capital markets opinions are the second-largest purpose segment and track M&A volume. Tax, statutory, and regulatory mandates follow transfer-pricing disputes, Pillar Two compliance, and estate-planning activity. Dispute, litigation, and investigation assignments can rise during downturns, while insolvency and restructuring work follows the credit cycle and aging private equity holdings. These purposes show that valuation work is needed across the corporate life cycle, not only in active deal periods, supporting the business valuation service market share of recurring and non-transactional mandates.


By Engagement Product: Portfolio Marks Drive Recurring Revenue at Superior Growth Rates
Valuation engagement held 47.56% of revenue in 2025. It remains central to M&A fairness opinions, financial reporting work, and tax-planning appraisals. These use cases require full-scope signed opinions with a formal conclusion of value. Recurring portfolio or NAV mark is projected to grow at 8.45% CAGR through 2031. This growth reflects the continued use of perpetual capital and evergreen fund vehicles. Evergreen private credit assets under management reached USD 644 billion in mid-2025, up 28% from year-end 2024.
The business valuation service market size for recurring portfolio marks expands as each vehicle creates several independent valuation events each year. This converts some transactional pipelines into recurring service agreements and increases the business valuation service market share of recurring engagements. Providers can use quarterly work to plan staffing and technology investments with greater certainty. Calculation engagements serve clients seeking an option between a full valuation and a self-prepared estimate. Independent opinion products include fairness and solvency opinions used in board fiduciary and Securities and Exchange Commission disclosure settings. Recurring marks offer predictable revenue, while complex opinions remain expertise-intensive and can support higher margins. These product lines require different approaches to talent, data, and operating investment.
By Provider Type: Accounting Networks Dominate, Independent Registrants Accelerate
Accounting and professional-services networks held 35.76% of provider revenue in 2025. Their position is supported by audit and advisory relationships, broad client coverage, and credibility in regulated and complex M&A assignments. Independent practitioners and registered valuer entities are forecast to grow at 7.78% CAGR through 2031. Demand for conflict-free opinions contributes to this growth. Audit-independence rules can prevent an incumbent audit firm from providing fair-value support to its own audit client. Regional fund-administrator assignments and digitally enabled practitioner models also support independent providers.
The business valuation service market benefits when independence requirements redirect financial-reporting work toward specialist providers. USPAP, International Valuation Standards, and European frameworks create credential requirements for complex engagements. Independent valuation specialists compete through methodological depth, proprietary data, and expert-witness capability. Investment-banking and corporate-finance opinion desks focus more narrowly on fairness opinions and leveraged-buyout solvency assessments. Private-credit audits and Securities and Exchange Commission scrutiny of Level 3 estimates increase demand for conflict-free specialists. The business valuation service market offers a clear role for mid-tier specialists where audit and transaction advisory conflicts limit other provider types. Providers must still demonstrate quality, independence, and sufficient data coverage.
By Client Type: Operating Companies Lead, Alternative-Asset Managers Accelerate Fastest
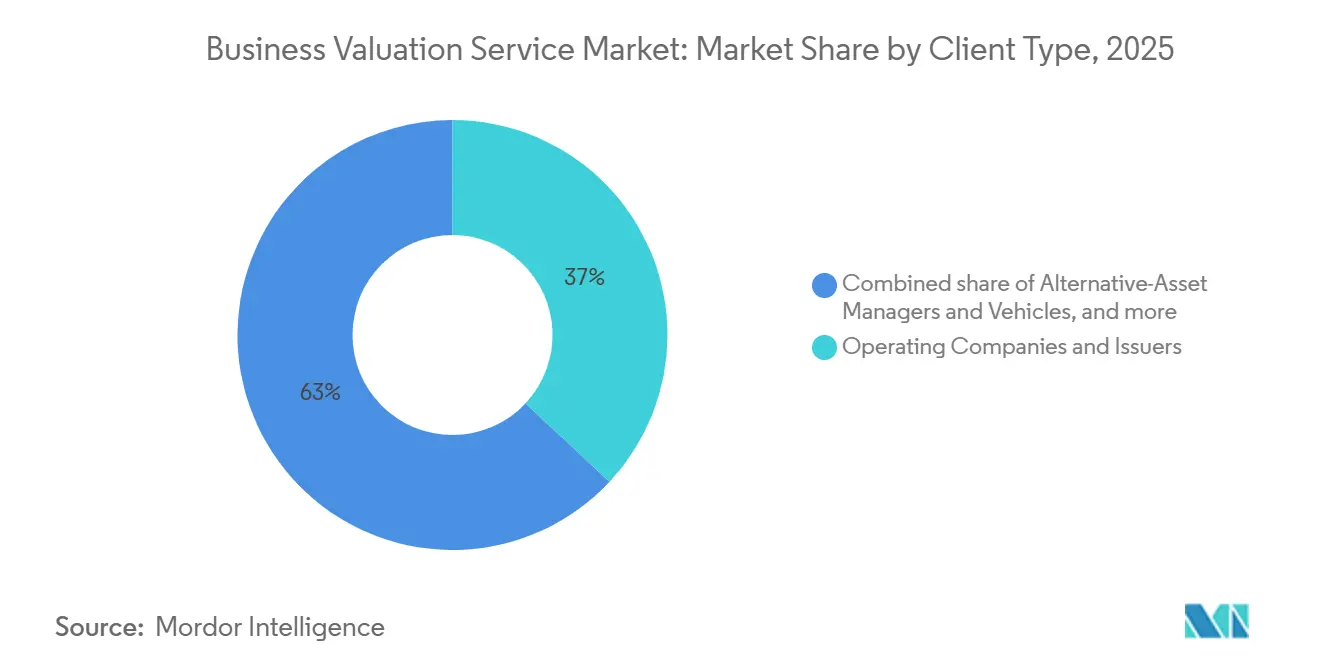
Operating companies and issuers held 36.96% of the business valuation service market share in 2025. They form the broadest and most stable client base. Annual goodwill impairment testing, M&A support, ASC 718 stock-based compensation valuations, and tax planning all originate from corporate issuers. Alternative-asset managers and vehicles are forecast to grow at 8.62% CAGR through 2031. Their portfolios require periodic independent fair-value assessments. Private equity, private credit, and hedge funds each contribute to this recurring work.
The business valuation service market size for alternative-asset managers rises as fund portfolios grow and investors examine net asset value practices more closely. Private-market EV/EBITDA multiples rose to 11.9x in the first quarter of 2026 from 11.5x in 2025. This environment can increase the use of independent valuers when net asset values are contested. Banks, insurers, and other regulated financial institutions use valuations for IFRS 9, expected credit loss, insurance solvency, and Basel-related work. Family offices and private individuals create demand through wealth transfer and estate activity. Officeholders, courts, public bodies, and professional intermediaries provide stable channels for calculation-level and litigation-related assignments. These client groups spread demand across corporate, financial, public, and private settings.
By End-User Industry: Technology, Media and Telecommunications Reflect M&A Intensity and Intellectual Property Complexity
Technology, media, and telecommunications held 20.09% of the business valuation service market share in 2025 and is projected to grow at a 7.92% CAGR through 2031. It leads end-user demand because intangible assets, M&A activity, and valuation complexity are concentrated in this sector. Artificial intelligence acquisitions create challenges around models, training datasets, and digital rights portfolios. These assets often lack observable comparable-market data. Income-based methods require judgment on discount rates and growth assumptions. The TEGOVA exposure draft recognizes the need for a more developed practice for intangible assets, supporting the business valuation service market size over the forecast period.
The BCG M&A Sentiment Index for technology was 52 in the second quarter of 2026, below its long-term average of 100. Selective deal activity can still increase the independence and complexity requirements of individual transactions. Financial services is the second-largest end-user area because of credit-loss models, insurance fair value, and private credit growth. Healthcare and life sciences rank third through pharmaceutical licensing, clinical-stage pipeline valuation, and provider-group M&A. Industrials and manufacturing, energy, utilities and infrastructure, consumer and retail, and other sectors demonstrate the broad application of valuation services. Renewable financing, public procurement, and utility privatizations require regulated-asset and concession expertise that differs from technology-focused work.
Geography Analysis
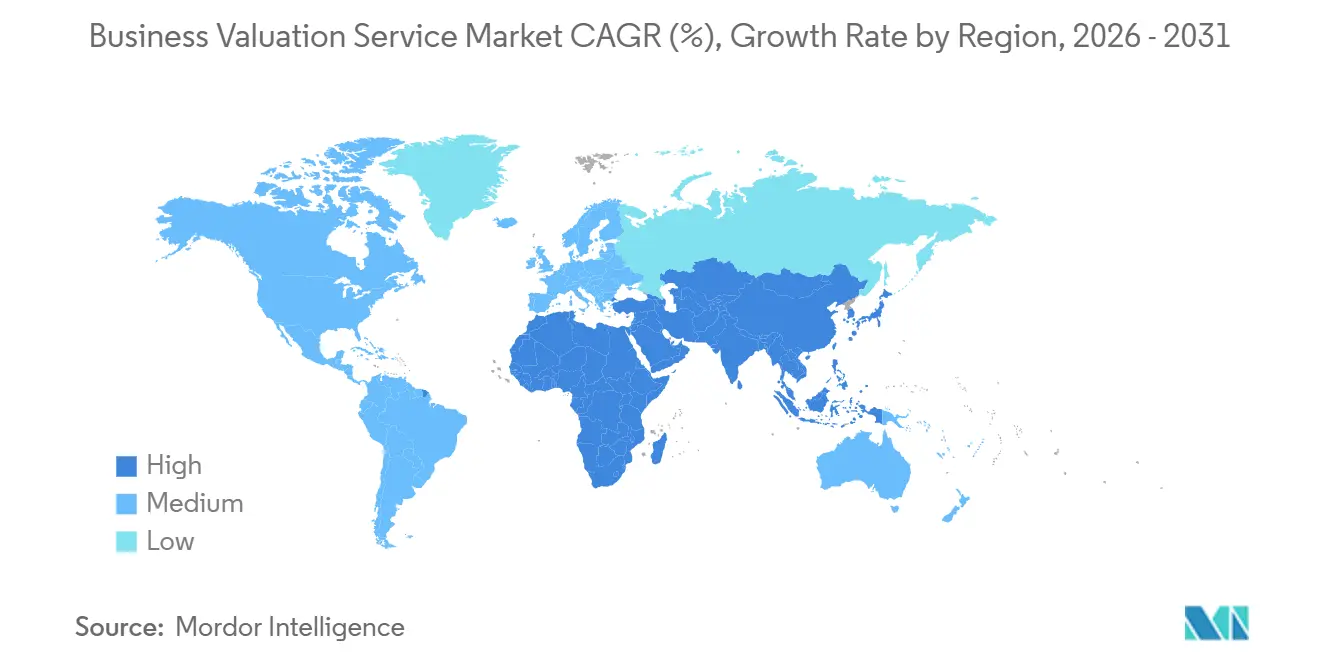
North America held 49.68% of the business valuation service market share in 2025. The region has a high concentration of private equity sponsors and public companies with detailed fair-value reporting requirements. The United States is the largest national market, supported by Securities and Exchange Commission examination priorities, Financial Accounting Standards Board requirements, Delaware litigation, and aging private equity holdings. The Americas M&A Sentiment Index stood at 84 in the second quarter of 2026, up from 79 at the start of the year but below the long-term average of 100. Canada supports activity through natural resources M&A and ties with the United States. Mexico adds demand through financial services growth and investment linked to the United States-Mexico-Canada Agreement.
Europe has a distinct structure because public companies widely use IFRS, and the region has a fragmented private-company base. The United Kingdom, Germany, and France generate most European mandates. The European Business Valuation Standards for Intangible Assets exposure draft may increase documentation and methodology requirements across European markets. The Middle East and Africa remain smaller but are developing as Gulf Cooperation Council diversification programs create infrastructure, energy, and private-company valuation assignments. Sovereign wealth fund assets under management reached USD 15 trillion in 2025 and are projected to reach USD 30 trillion by 2035. Gulf funds account for a large share of this growth, supporting demand for independent valuations on new commitments.
Asia-Pacific is projected to grow at a 9.12% CAGR through 2031, supporting the expansion of the business valuation service market size. China, India, Japan, South Korea, and Southeast Asia are supported by private equity, private credit, and cross-border M&A activity. India recorded 457 buyouts and growth-equity deals worth USD 13.7 billion in the first half of 2025, equal to 21% of Asia-Pacific activity. Greater China became the region's largest exit market in 2025 as exit value rose 76%. The Asia-Pacific M&A Sentiment Index was 55 in the second quarter of 2026. South America, led by Brazil, has a smaller business valuation service market share but growing interest in regulated fair-value practices as capital markets deepen and United States and European sponsors increase infrastructure and consumer investment.

Competitive Landscape
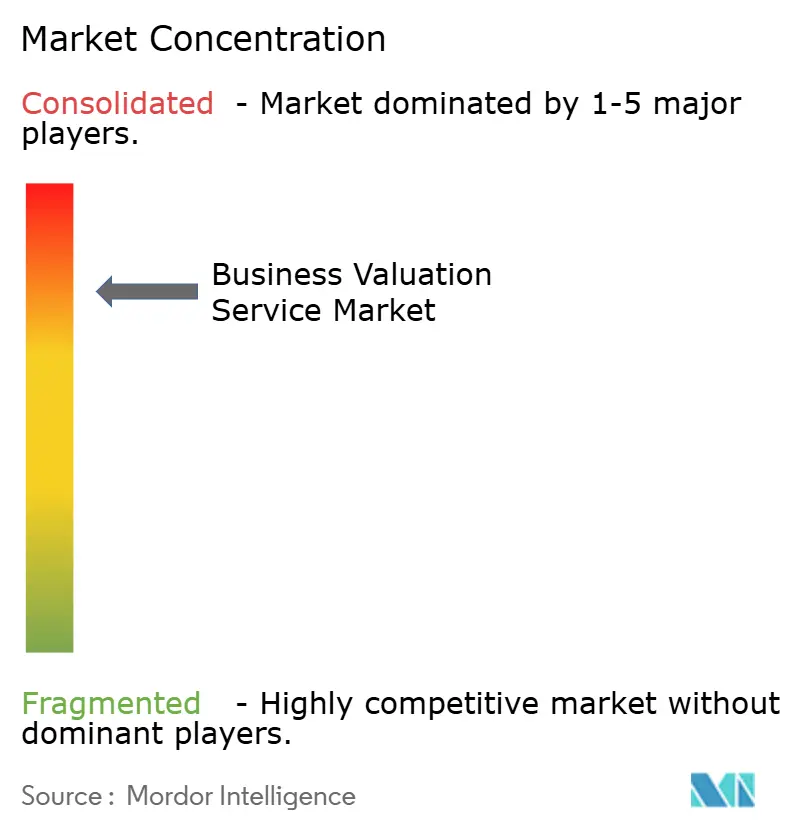
The business valuation service market is concentrated, with large global accounting and professional-services networks and specialized providers such as Kroll holding strong positions in institutional and complex valuation mandates. Kroll identifies itself as the largest independent provider of business valuation services globally, with more than 2,000 professionals across 70+ offices. Kroll has also expanded its Netherlands valuation advisory services practice through the addition of the BFI team, strengthening its specialist and European capabilities. Its scale, global coverage, specialized expertise, and technology create barriers for smaller providers competing for large cross-border and complex assignments. The market, therefore, remains concentrated among leading institutional providers, while smaller firms compete primarily in regional and lower-complexity engagements.
Houlihan Lokey identifies financial and valuation advisory as a central part of its M&A, restructuring, and dispute advisory offering. Its model combines deal execution with valuation opinions. Independent specialists can find it difficult to replicate this integrated model at scale. Stout combined with Pointe Advisory in January 2026 and launched Stout Strategy. It had also announced an investment partnership with Integrum Holdings in 2025. These steps show a consolidation approach across valuation, investment banking, and disputes.
Technology platforms automate workpapers for standard assignments, while private equity-backed consolidators aggregate specialist talent and data. Providers with proprietary comparable-transaction and private-market pricing databases have a stronger position than technology-only entrants. Platforms can serve clients that were previously uneconomic for large providers. They do not yet compete broadly for litigation-sensitive, highly complex, or regulatory-examination work. Recurring portfolio services for mid-market private credit managers, artificial intelligence and digital-asset methods, and scalable small and medium-sized enterprise tools remain important areas of competition. The International Valuation Standards and USPAP create barriers in complex categories by requiring professional standards and defensible methods.
Business Valuation Service Industry Leaders
Deloitte Touche Tohmatsu Limited
PricewaterhouseCoopers International Limited
Ernst & Young Global Limited
KPMG International Limited
- *Disclaimer: Major Players sorted in no particular order

Recent Industry Developments
- June 2026: Houlihan Lokey, Inc. signed an agreement to acquire Intrepid Financial Partners, LLC, a premier independent investment bank specializing in energy-sector advisory services. The transaction, announced June 27, 2026, and expected to close before September 30, 2026, deepens Houlihan Lokey's energy-sector valuation and financial advisory capability, adding a specialized coverage team to its financial and valuation advisory business.
- January 2026: Stout announced its combination with Pointe Advisory, with the transaction finalized on December 16, 2025, and simultaneously launched Stout Strategy, a new practice covering growth strategy consulting, commercial and vendor due diligence, and competitive intelligence. Adding nearly 100 professionals, this marks Stout's second acquisition since its partnership with Integrum Holdings in July 2025, reflecting private equity-backed capital enabling deliberate mid-market consolidation in valuation and advisory services.
- January 2026: The OECD released the Pillar Two Side-by-Side Package, introducing safe harbors for United States-headquartered multinational enterprise groups under the global minimum-tax framework. The rules create a new class of compliance-valuation and intercompany re-pricing work for transfer-pricing specialists, directly expanding mandate volume in the tax and statutory purpose segment.
- July 2025: Stout announced a strategic investment partnership with Integrum Holdings LP, a private investment firm focused on technology-enabled financial and business services, following the exit of prior investor Audax Private Equity. Closing in the third quarter of 2025, the partnership is structured to fund continued acquisitions and organic expansion across Stout's valuation, investment banking, and disputes practices.


Global Business Valuation Service Market Report Scope
| Transaction and Capital-Markets Opinions |
| Financial Reporting and Fund Fair Value |
| Tax, Statutory and Regulatory |
| Dispute, Litigation and Investigation |
| Insolvency, Restructuring and Distress |
| Valuation Engagement |
| Calculation Engagement |
| Independent Opinion Product |
| Recurring Portfolio or NAV Mark |
| Accounting and Professional-Services Networks |
| Independent Valuation Specialists |
| Investment-Banking and Corporate-Finance Opinion Desks |
| Independent Practitioners and Registered-Valuer Entities |
| Operating Companies and Issuers |
| Alternative-Asset Managers and Vehicles |
| Banks, Insurers and Other Regulated Financial Institutions |
| Private Individuals, Estates, Trustees and Family Offices |
| Officeholders, Courts and Public Bodies |
| Professional Intermediaries as Principal |
| Financial Services |
| Technology, Media and Telecommunications |
| Healthcare and Life Sciences |
| Industrials and Manufacturing |
| Energy, Utilities and Infrastructure |
| Consumer and Retail |
| Others |
| North America | United States |
| Canada | |
| Mexico | |
| South America | Brazil |
| Argentina | |
| Rest of South America | |
| Europe | United Kingdom |
| Germany | |
| France | |
| Italy | |
| Spain | |
| Rest of Europe | |
| Asia-Pacific | China |
| Japan | |
| India | |
| South Korea | |
| Australia | |
| Indonesia | |
| Thailand | |
| Malaysia | |
| Singapore | |
| Vietnam | |
| Rest of Asia-Pacific | |
| Middle East and Africa | Saudi Arabia |
| United Arab Emirates | |
| Turkey | |
| South Africa | |
| Egypt | |
| Rest of Middle East and Africa |
| By Purpose | Transaction and Capital-Markets Opinions | |
| Financial Reporting and Fund Fair Value | ||
| Tax, Statutory and Regulatory | ||
| Dispute, Litigation and Investigation | ||
| Insolvency, Restructuring and Distress | ||
| By Engagement Product | Valuation Engagement | |
| Calculation Engagement | ||
| Independent Opinion Product | ||
| Recurring Portfolio or NAV Mark | ||
| By Provider Type | Accounting and Professional-Services Networks | |
| Independent Valuation Specialists | ||
| Investment-Banking and Corporate-Finance Opinion Desks | ||
| Independent Practitioners and Registered-Valuer Entities | ||
| By Client Type | Operating Companies and Issuers | |
| Alternative-Asset Managers and Vehicles | ||
| Banks, Insurers and Other Regulated Financial Institutions | ||
| Private Individuals, Estates, Trustees and Family Offices | ||
| Officeholders, Courts and Public Bodies | ||
| Professional Intermediaries as Principal | ||
| By End-User Industry | Financial Services | |
| Technology, Media and Telecommunications | ||
| Healthcare and Life Sciences | ||
| Industrials and Manufacturing | ||
| Energy, Utilities and Infrastructure | ||
| Consumer and Retail | ||
| Others | ||
| By Geography | North America | United States |
| Canada | ||
| Mexico | ||
| South America | Brazil | |
| Argentina | ||
| Rest of South America | ||
| Europe | United Kingdom | |
| Germany | ||
| France | ||
| Italy | ||
| Spain | ||
| Rest of Europe | ||
| Asia-Pacific | China | |
| Japan | ||
| India | ||
| South Korea | ||
| Australia | ||
| Indonesia | ||
| Thailand | ||
| Malaysia | ||
| Singapore | ||
| Vietnam | ||
| Rest of Asia-Pacific | ||
| Middle East and Africa | Saudi Arabia | |
| United Arab Emirates | ||
| Turkey | ||
| South Africa | ||
| Egypt | ||
| Rest of Middle East and Africa | ||


Key Questions Answered in the Report
What is driving demand in the business valuation service market?
Fair-value reporting, M&A, private credit growth, and difficult intangible-asset assignments support demand through 2031.
How large is the business valuation service market?
The business valuation service market size is USD 4.2 billion in 2026 and is forecast to reach USD 5.7 billion by 2031 at a 6.5% CAGR.
Which purpose generates the most valuation work?
Financial Reporting and Fund Fair Value led with 33.87% share in 2025 and is projected to grow at 8.12% CAGR through 2031.
Which client group is growing fastest for valuation providers?
Alternative-Asset Managers and Vehicles are projected to grow at 8.62% CAGR through 2031 as private-market portfolios require recurring marks.
Which region is expanding fastest for valuation services?
Asia-Pacific is projected to grow at 9.12% CAGR through 2031, supported by private equity, private credit, and cross-border M&A activity.
Why are independent valuation providers important?
Audit-independence requirements and investor scrutiny can create demand for conflict-free opinions and specialist Level 3 fair-value support.
Page last updated on:





