
Business Rules Management Systems Market Size and Share
Market Overview
| Study Period | 2020 - 2031 |
|---|---|
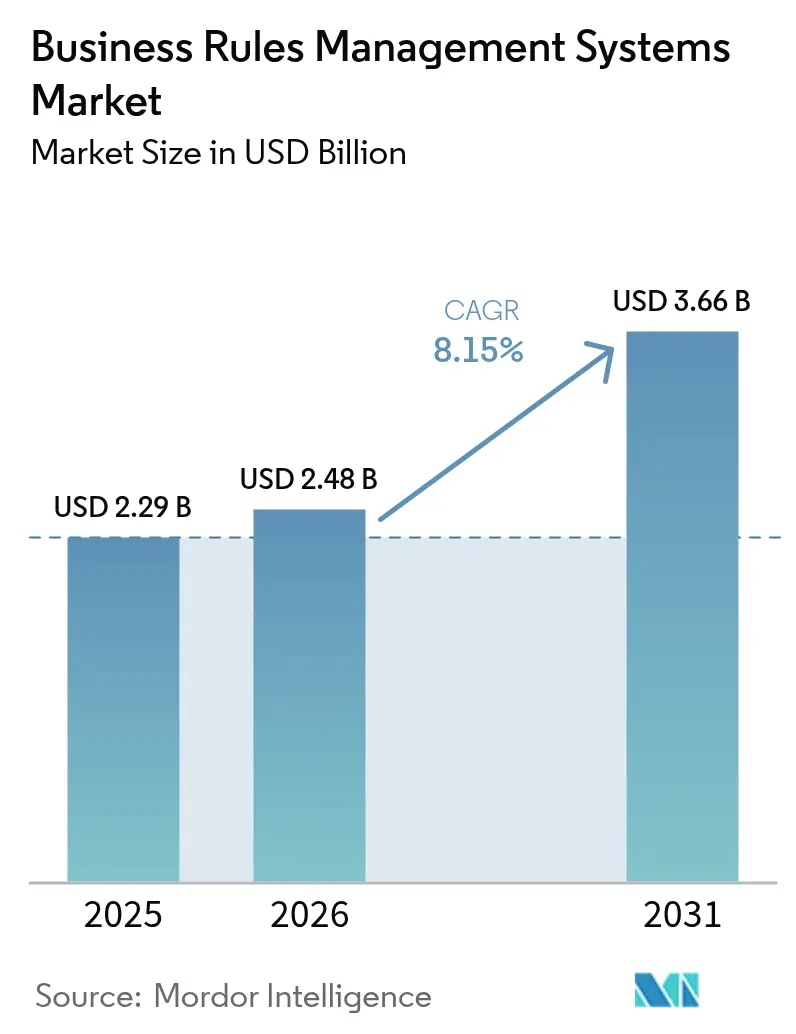
| Market Size (2026) | USD 2.48 Billion |
| Market Size (2031) | USD 3.66 Billion |
| Growth Rate (2026 - 2031) | 8.15 % |
| Fastest Growing Market | Asia Pacific |
| Largest Market | North America |
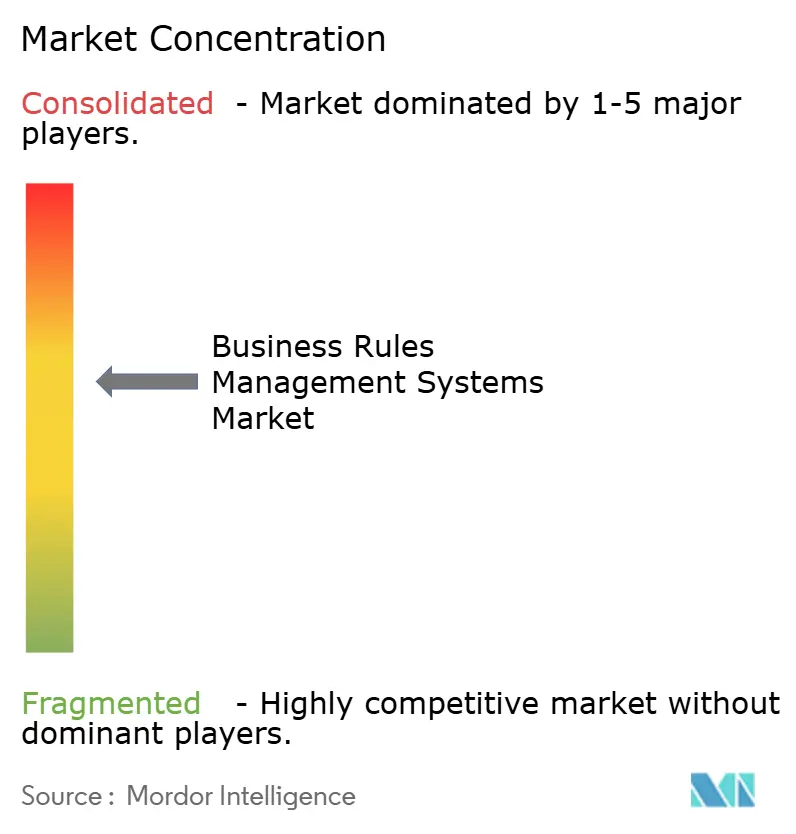
| Market Concentration | Medium |
Major Players *Disclaimer: Major Players sorted in no particular order Image © Mordor Intelligence. Reuse requires attribution under CC BY 4.0. | |
Business Rules Management Systems Market Analysis by Mordor Intelligence
The Business Rules Management Systems market size is expected to grow from USD 2.29 billion in 2025 to USD 2.48 billion in 2026 and is forecast to reach USD 3.66 billion by 2031 at 8.15% CAGR over 2026-2031. Cloud-native rule engines, tighter regulatory oversight, and mounting pressure on enterprises to trim operational costs while safeguarding governance are reinforcing demand. Ongoing migration from embedded code to externalized rules shortens policy update cycles, lets firms respond quickly to market shifts, and improves auditability. Growth is further propelled by low-code tools that let business users author rules directly, by AI-driven decision science that improves rule accuracy, and by the integration of rules with robotic process automation that closes process gaps and reduces manual hand-offs. Vendors that package explainable AI with transparent rule flows are gaining traction as buyers require deterministic logic in regulated environments.
Key Report Takeaways
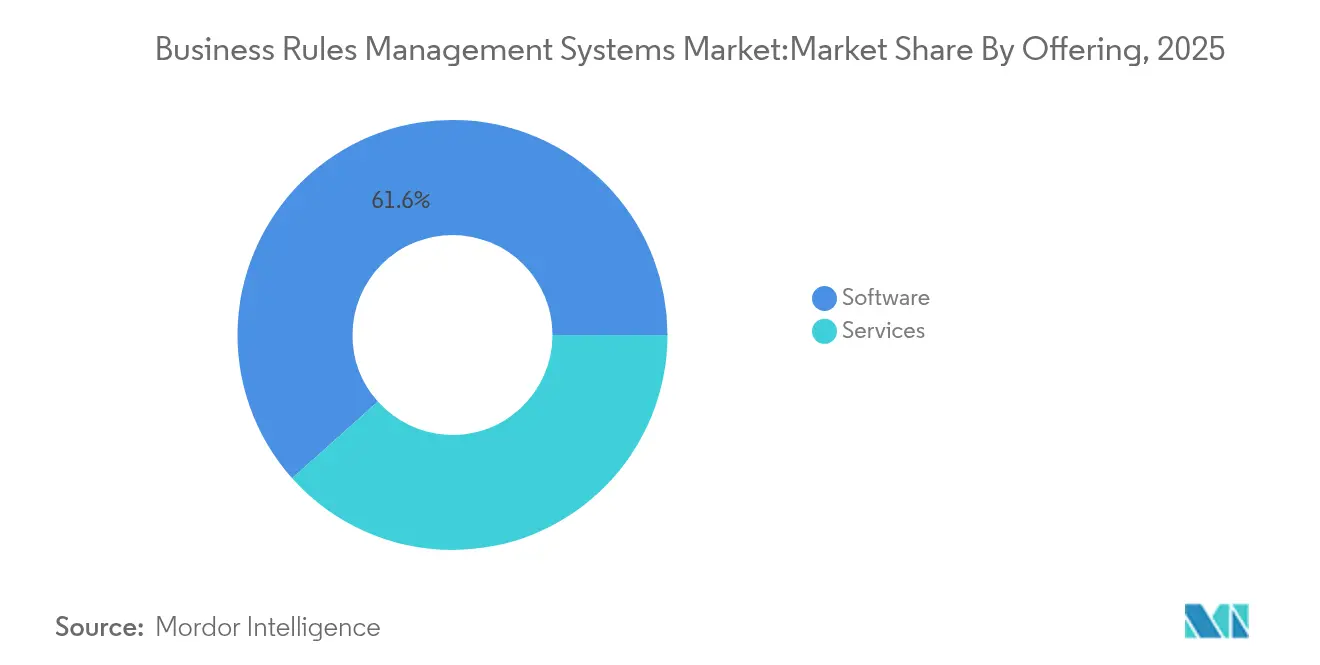
- By offering, software retained 61.60% revenue share in 2025, while services are forecast to expand at a 9.85% CAGR through 2031.
- By organization size, large enterprises held 63.10% of the business rules management systems market share in 2025, whereas small and medium enterprises are set to lead growth at an 11.05% CAGR to 2031.
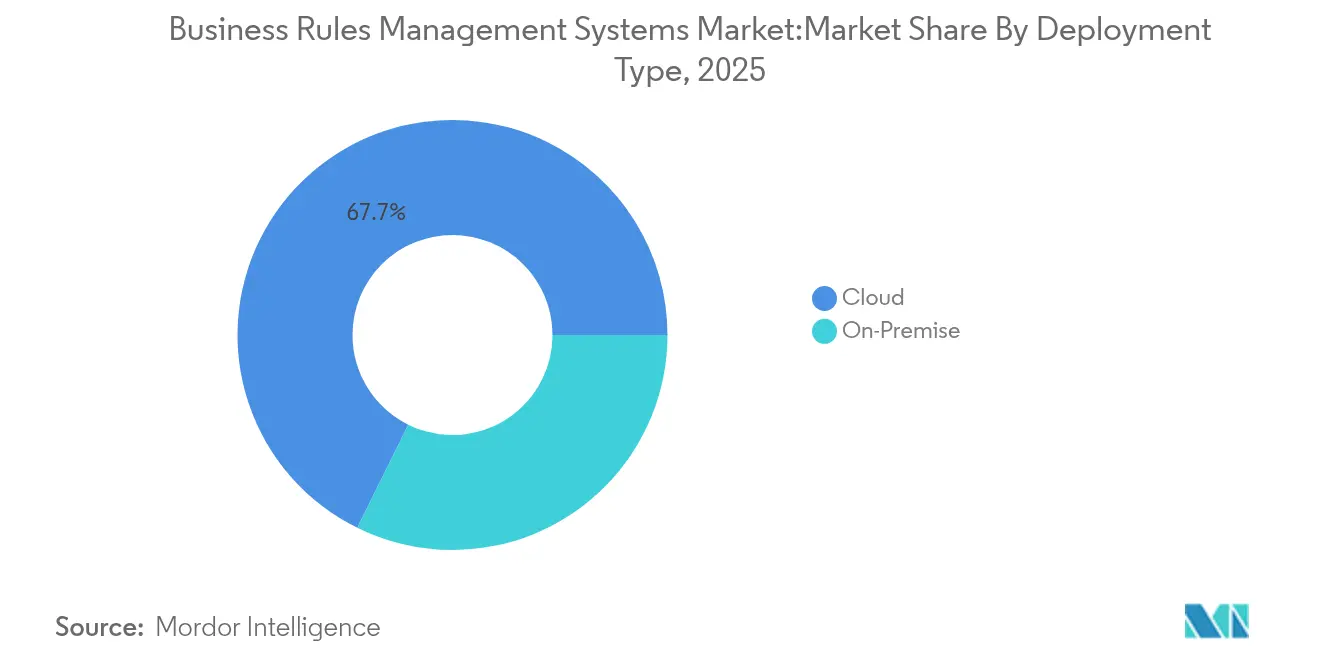
- By deployment, cloud platforms captured 67.70% of the business rules management systems market size in 2025 and are projected to advance at a 9.35% CAGR through 2031.
- By end-user vertical, the BFSI segment accounted for 43.10% of revenue in 2025; Healthcare and Life Sciences is projected to grow at a 10.02% CAGR by 2031.
- By business function, risk and compliance held 50.20% of the business rules management systems market size in 2025, while customer service workloads are rising at an 10.78% CAGR.
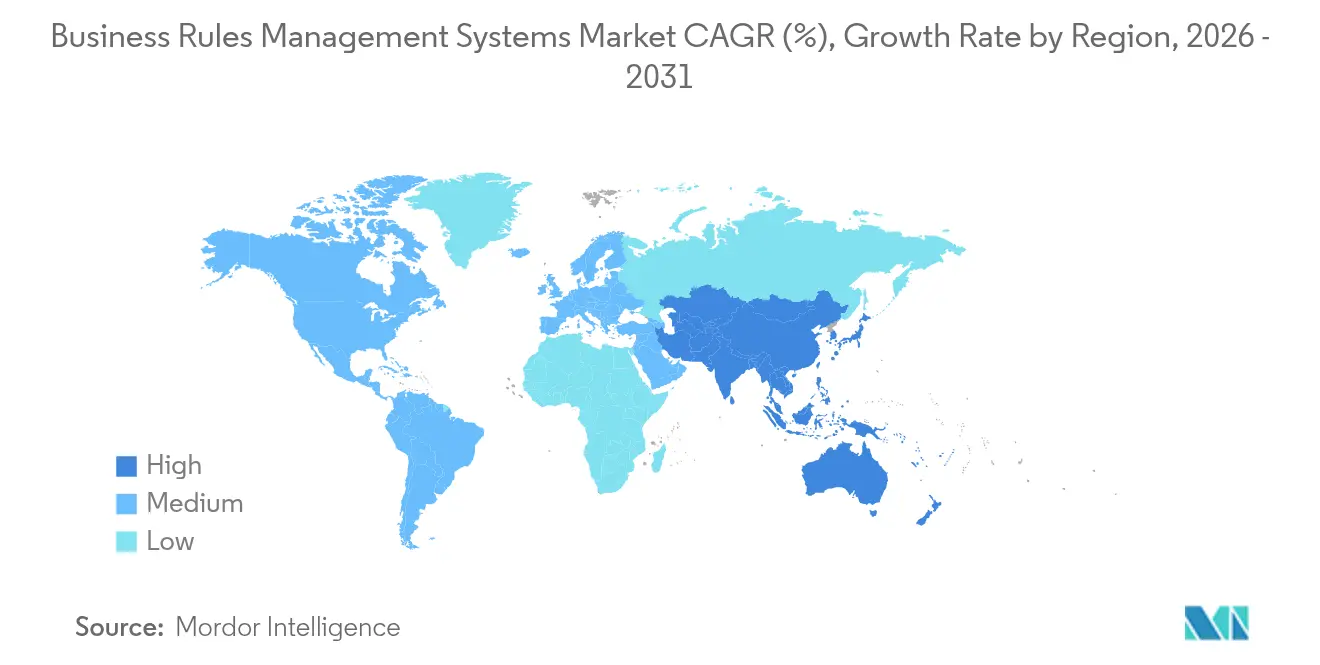
- By geography, North America commanded 37.40% revenue share in 2025, and Asia-Pacific is forecast to post an 10.62% CAGR through 2031.
Note: Market size and forecast figures in this report are generated using Mordor Intelligence’s proprietary estimation framework, updated with the latest available data and insights as of 2026.
Market Trends and Insights
Drivers Impact Analysis of Business Rules Management Systems Market*
| Driver | (~) % Impact on CAGR Forecast | Geographic Relevance | Impact Timeline |
|---|---|---|---|
| Reduced dependency on IT teams for writing rules | +1.3% | North America and Europe lead | Medium term (2-4 years) |
| Increased need to manage regulatory and compliance policy | +1.5% | Global, most acute in BFSI hubs | Short term (≤ 2 years) |
| Rise of low-code/no-code platforms accelerating BRMS adoption | +1.0% | Asia-Pacific core, spill-over to North America | Medium term (2-4 years) |
| Integration with hyper-automation and RPA suites | +0.9% | Global, early adoption in manufacturing | Long term (≥ 4 years) |
| Demand for explainable AI in decisioning | +0.8% | North America and EU, expanding to APAC | Long term (≥ 4 years) |
| Growing cloud-native micro-services architectures | +0.7% | Global, led by cloud-first organizations | Medium term (2-4 years) |
| Source: Mordor Intelligence | |||
Reduced Dependency on IT Teams for Writing Rules
Business units now insist on changing rules without queuing requests for developers, shrinking policy deployment cycles, and cutting compliance lag. Federal Bank, for instance, halved its Know Your Customer update timeline after adopting an automation layer that lets analysts adjust customer identification logic directly. Visual rule designers and natural-language authoring portals in today’s platforms give non-technical staff direct control, which frees scarce IT resources for core engineering tasks. In regulated sectors, this agility neutralizes the risk of late policy rollouts whenever a regulator issues fresh guidance. The shift also builds institutional resilience because business logic no longer sits hard-coded inside legacy applications.
Increased Need to Manage Regulatory and Compliance Policy
Financial institutions absorb more than 500 rule changes a year, and manual mapping of statutes to workflows strains budgets and staff. Automated rule engines translate legal text into executable policies, cutting both interpretation errors and update latency. Regology’s platform monitors global statutes, flags potential impacts, and feeds structured obligations into rule repositories, allowing firms to stay current across multiple jurisdictions. Fines topping billions of USD have proved that non-compliance outweighs system costs, pushing boards to prioritize automated governance. Healthcare providers follow a similar path by converting treatment guidelines into machine-readable logic for clinical decision support.
Rise of Low-Code/No-Code Platforms Accelerating BRMS Adoption
Drag-and-drop canvases and rule templates eliminate heavy development cycles and drop the barrier to entry for smaller firms. Asia-Pacific SMEs leverage these tools to implement decision flows within weeks, supporting the region’s 11.1% CAGR leadership in the business rules management systems market. FICO Blaze Advisor lets analysts craft strategies without coding, cutting deployment costs, and compressing testing timelines. Citizen-developer programs have emerged, distributing rule ownership across departments yet maintaining central oversight for risk.
Integration with Hyper-Automation and RPA Suites
Combining rule engines with process bots creates unattended workflows that span data capture, decisioning, and transaction posting. Sogefi Brazil lifted on-time purchase-order approvals to 97% after embedding rules into an automated workflow that trimmed 5 approval steps while honoring segregation-of-duties policy. Modern microservices architectures fire rules in real time, so bot-driven processes adapt instantly to events such as price swings or supply shortages. Manufacturing hubs use this fusion to automate production scheduling, while finance departments automate straight-through invoice approvals.
Restraints Impact Analysis of Business Rules Management Systems Market*
| Restraint | (~) % Impact on CAGR Forecast | Geographic Relevance | Impact Timeline |
|---|---|---|---|
| Resistance to modern technology in legacy-system-heavy firms | -0.7% | Traditional industries worldwide | Short term (≤ 2 years) |
| Perceived high TCO for enterprise-wide roll-outs | -0.5% | Cost-sensitive and emerging markets | Medium term (2-4 years) |
| Shortage of skilled decision-management architects | -0.4% | Global, acute in specialized domains | Long term (≥ 4 years) |
| Vendor lock-in concerns limiting long-term flexibility | -0.3% | Enterprise markets, multi-vendor environments | Medium term (2-4 years) |
| Source: Mordor Intelligence | |||
Resistance to Modern Technology in Legacy-System-Heavy Firms
Enterprises that rely on decades-old core platforms often distrust rule externalization because existing logic seems stable and well understood. Change management challenges mount when staff worry that automation will devalue institutional knowledge. Integration projects can be costly if legacy code lacks clear documentation, and senior executives may resist risking production stability. Manufacturing plants that run on embedded programmable logic controls illustrate this hesitation, preferring incremental tweaks to wholesale rule extraction.
Perceived High TCO for Enterprise-Wide Roll-Outs
Comprehensive deployments include software fees, integration services, training, and continuous optimization, all of which can exceed initial budget estimates. Legacy-to-BRMS migrations reveal hidden complexity once undocumented rule variants surface. Licensing models linked to transaction volumes may look expensive relative to departmental pilots, especially in emerging markets where capex is scarce. Small firms balance these costs against long-term compliance and efficiency gains, delaying projects until cloud subscription models and shared services narrow the affordability gap.
*Our forecasts treat driver/restraint impacts as directional, not additive. The impact forecasts reflect baseline growth, mix effects, and variable interactions.
Business Rules Management Systems Market Segment Analysis
By Offering:
Services Growth Outpaces Software DominanceServices revenue is expanding at a 9.85% CAGR because enterprises recognize that domain expertise is vital for rule harvesting, testing, and governance. The business rules management systems market relies on consulting partners to translate policy into logic, integrate rule engines with existing applications, and coach citizen developers. Implementation engagements command premium pricing when mistakes could trigger regulatory fines. Continuous optimization retainers are also growing as firms refine rule performance after deployment.Software still represented 61.60% of 2025 revenue, but its growth is modest relative to services. Vendors increasingly bundle low-code design tools and AI-based rule analyzers to retain license value. Yet many buyers view software as a foundation and channel investments toward managed services that ensure uptime, security, and version upgrades. This pattern underscores that the business rules management systems market values outcomes over ownership.

By Organization Size:
SME Acceleration Drives Market DemocratizationSmall and medium enterprises are registering an 11.05% CAGR, reflecting falling entry barriers linked to SaaS delivery. Cloud subscription tiers permit incremental adoption without hardware investments, letting SMEs achieve compliance parity with larger rivals. Vendor marketplaces now offer pre-built rule packs tailored to common use cases such as invoice matching or credit scoring, further simplifying uptake.Large enterprises held 63.10% revenue share in 2025, yet now focus on refining existing deployments. Their priorities include embedding machine learning predictors inside rule flows and applying decision analytics to monitor drift. Multi-region conglomerates demand sophisticated metadata management to govern thousands of rules across jurisdictions. These requirements fuel collaboration with specialized integrators and justify the business rules management systems industry’s consulting expansion.
By Deployment Type:
Cloud Supremacy Reflects Architectural EvolutionCloud platforms captured 67.70% revenue share in 2025 and keep growing at 9.35% because elasticity matches volatile transaction volumes. Organisations avoid over-provisioning by letting platforms autoscale rule evaluations during seasonal peaks. Containerized deployments on Kubernetes shorten release cycles, and serverless endpoints reduce idle costs. The business rules management systems market size attached to the cloud is set to rise as firms modernize application stacks.On-premise engines remain relevant where data residency or ultra-low latency is mandatory, yet even these users adopt hybrid designs. Development and testing often happen in the cloud, with sensitive production rules anchored on private clusters. Red Hat’s event-driven architecture blueprint shows how distributed rule components can stay synchronized under central governance. Edge deployments in manufacturing or logistics hubs process decisions locally to avoid network delays.
By End-User Vertical:
Healthcare Surge Challenges BFSI LeadershipHealthcare and life sciences is the fastest-growing vertical at 10.02% CAGR as clinical guidelines evolve rapidly and require machine-readable execution. Providers deploy rules to flag contraindications, authorize procedures, and ensure compliance with safety regulations. Progress Corticon users reported up to 90% faster development for care-path logic. Real-time decision support raises care consistency and curbs liability exposure.Banking, Financial Services, and Insurance still led with 43.10% revenue share in 2025 because fraud detection, credit adjudication, and regulatory reporting rely on deterministic logic. Growth, however, is plateauing as first-generation engines mature. Manufacturers and government agencies are fresh adopters. Ceará State Government digitized case handling and cut processing time fivefold after centralizing rules. Retailers exploit rules for dynamic pricing and personalized promotions, broadening the business rules management systems market reach.
By Business Function:
Customer Service Automation AcceleratesCustomer service workloads exhibit an 10.78% CAGR as enterprises automate inquiry triage, escalations, and resolution tracking across chat, email, and voice channels. Rule-driven routing ensures consistent policy application regardless of channel and hour. Integration with CRM data lets firms apply context, boosting satisfaction while keeping staffing flat. Predictive analytics and rules combine to trigger proactive outreach before issues peak, reducing churn.Risk and compliance functions accounted for 50.20% of the business rules management systems market size in 2025 and remain foundational. However, they now share the stage with operations and supply chain teams that need rule-based sourcing, inventory, and logistics decisions to navigate volatile markets. Finance departments adopt rules for straight-through invoice approvals, and marketing teams embed decisioning into campaign orchestration. This diversification signals that decision automation has moved from niche to enterprise core.
Geography Analysis
North America Business Rules Management Systems Market
North America led the business rules management systems market with 37.40% revenue share in 2025. Deep regulatory obligations in sectors such as finance and healthcare, combined with a mature culture of process automation, sustain demand. Institutions like NatWest compressed product governance lead times from 4.5 days to under 20 minutes using automated risk oversight. Vendors headquartered in the region provide extensive partner ecosystems and professional services that accelerate adoption.
APAC and EMEA Business Rules Management Systems Market
Asia-Pacific is the fastest-growing territory, posting an 10.62% CAGR through 2031. Government digitalization programs and cloud-first strategies among SMEs drive the uptake of subscription-based rule engines. The Asia-Pacific Trade Facilitation Report projected 11% cost savings from digitized trade procedures, a catalyst for automating customs and logistics decisions. Banks in markets such as Indonesia and the Philippines embed rules to accelerate credit processing, while manufacturers in Vietnam automate supplier qualification.Europe maintains steady expansion as cross-border commerce and stringent data-protection law require transparent, auditable decision systems. Firms adopt explainable AI layered on rule engines to meet audit mandates. Manufacturing clusters implement rules for environmental compliance. Meanwhile, the Middle East and Africa represent emerging whitespace. Energy producers and public agencies modernize workflows through cloud platforms that minimize infrastructure hurdles, indicating long-term upside for the business rules management systems market.
Regulatory Landscape
Regulatory requirements for auditable and traceable automated decision-making are tightening across major BRMS-buying industries. In the European Union, the EU AI Act (Regulation (EU) 2024/1689) elevates expectations for high-risk AI systems around logging, technical documentation, and human oversight, pushing BRMS deployments to preserve decision lineage and keep deterministic rule flows explainable when combined with AI decisioning.
In the United States, agencies are also formalizing machine-readable and security-focused governance that affects BRMS implementations used for reporting and controls. A final joint rule published in the Federal Register on June 25, 2026, to establish interoperable financial regulatory data standards under the Financial Data Transparency Act of 2022 increases the need for standardized, consistent data definitions and reporting logic. NIST publications in 2026, including SP 800-18r2 (June 30, 2026) for security, privacy, and cybersecurity supply chain risk management planning and the IR 8500A initial public draft (May 19, 2026) exploring blockchain-based, machine-processable compliance approaches for software assets, reinforce procurement emphasis on documented controls, traceable change management, and verifiable decision governance.
Value Chain Analysis
The BRMS value chain begins with core platform R&D for rule authoring, decision modeling, and runtime execution, then extends through cloud infrastructure, integration tooling, and domain accelerators such as templates, rule packs, and connectors. Standards and specification layers (for example, OMG SBVR for business rule semantics) shape how rules are defined and shared across business and IT teams. Vendors package governance functions including versioning, approval workflows, audit trails, and testing frameworks, then deliver through enterprise sales, cloud marketplaces, and partner channels.
Downstream, systems integrators and consulting partners are central to rule harvesting from legacy applications. They translate policy into executable logic, integrate BRMS with ERP/CRM/core banking, and establish governance operating models. Recent product activity also points to where value is being added: InRule launched irAuthor Web in March 2026 to provide governed decision modeling with audit trails and version control, while FlexRule Open v11.1 (April 2026) added Decision Asset Management to govern rules, models, and AI-orchestrated assets across the lifecycle. In 2026, OpenRules releases in the v12.0.0 and v12.1.0 range emphasized LLM and AI assistant capabilities for interacting with and testing decision models, expanding usage beyond traditional rule repositories toward AI-connected decision services where security, validation, and traceability become service-led bottlenecks.
Competitive Landscape
The business rules management systems market is moderately concentrated. IBM, Oracle, and SAP capitalize on legacy footprints and broad portfolios, integrating rules with analytics and workflow modules. IBM’s repositioned software catalog now highlights automation and hybrid cloud capabilities, aligning with decisioning demand. Oracle blends rule services into its Fusion middleware to retain database clients, while SAP positions its Business AI roadmap to enrich rule-driven applications.
Specialists such as FICO, Progress Software, and Red Hat target domain or architectural niches. FICO excels in credit risk and fraud, with a robust rule editor for financial institutions. Progress recorded USD 238 million in Q1 2025 revenue, up 29%, and lifted annual guidance on growing automation subscriptions. Red Hat embeds its open-source Drools engine into OpenShift AI to attract developers seeking container-native decision services.
Cloud-native challengers offer flexible pricing and developer-friendly APIs. Their microservice rule components appeal to digital-born firms that dislike monolithic suites. Established vendors respond by rolling out managed services and pursuing acquisitions. Progress acquired ShareFile for USD 875 million to add secure content collaboration, while SAP’s transformation program invests in embedded AI to maintain relevance. Market rivalry is intensifying as platforms converge around hyper-automation, explainable AI, and low-code orchestration.
Business Rules Management Systems Industry Leaders
-
IBM Corporation
-
Fair Isaac Corporation (FICO)
-
Pegasystems Inc.
-
Oracle Corporation
-
SAP SE
- *Disclaimer: Major Players sorted in no particular order
Business Rules Management Systems Market Companies Covered in this Report
- IBM Corporation
- Fair Isaac Corporation (FICO)
- Pegasystems Inc.
- Oracle Corporation
- SAP SE
- Red Hat, Inc.
- Progress Software Corporation
- ACTICO GmbH
- TIBCO Software Inc.
- Software AG
- InRule Technology, Inc.
- Experian plc
- Sapiens International Corporation NV
- Bosch Software Innovations GmbH
- AgilePoint, Inc.
- Decision Management Solutions
- FlexRule Pty Ltd
- Sparkling Logic, Inc.
- OpenRules, Inc.
- Fujitsu Limited
- Newgen Software Technologies Ltd.
- HCL Technologies Ltd.
- Intellileap Solutions
- Signavio GmbH
- BOC Group
- SS&C Technologies (d/b/a DST Systems)
Read Analysis of Business Rules Management Systems Companies
Market Opportunities and Future Outlook
A primary opportunity sits in governed convergence of deterministic rules with AI-assisted decisioning, where buyers need both automation speed and defensible audit trails. Vendor roadmaps and product launches are aligning to this requirement: IBM Operational Decision Manager added support for Model Context Protocol in ODM v9.5.0.1 (December 2025) to connect runtime decision services with AI agents, and Pegasystems made Pega Infinity 26 generally available in June 2026 with AI agents and integrated governance. These moves expand whitespace for BRMS platforms that can enforce policy controls, preserve decision lineage, and keep changes reviewable when AI is incorporated into decision flows.
Legacy modernization and regulated-industry digitization also create openings for services and packaged accelerators that shorten rule extraction and re-platforming cycles. Pegasystems announced integration of Pega Blueprint AI with AWS Transform in June 2026 to extract business rules from legacy COBOL code for cloud-native application design, indicating demand for tooling that converts embedded logic into governed, reusable rule assets. Separately, the push toward security and standardized reporting logic is reinforced by U.S. policy activity in 2026, including the June 25, 2026 final joint rule on interoperable financial regulatory data standards, which favors BRMS implementations that can standardize decision logic and outputs across business units and jurisdictions while maintaining controlled change management.
Recent Industry Developments in Business Rules Management Systems Market
- June 2026: Pegasystems announced general availability of Pega Infinity 26, adding AI agents with integrated governance and an outcomes-based pricing model. The release links agentic automation to policy controls, supporting regulated decision automation use cases where deterministic logic and oversight are required.
- December 2025: IBM released Operational Decision Manager (ODM) v9.5.0.1, adding support for Model Context Protocol (MCP) to integrate runtime decision services with AI agents. This strengthens the connection between BRMS decision services and emerging agent frameworks while keeping decisioning under governed, testable runtime control.
- September 2024: Progress Software completed its USD 875 million acquisition of ShareFile. The deal broadened Progress capabilities around secure content workflows and automation, creating more integration surface for decisioning and rules-driven process automation scenarios.
Business Rules Management Systems Market Report Scope and Research Methodology
Market Definition and Coverage
This market covers business rules management systems that help organizations create, update, test, and run decision rules through a dedicated rules engine, delivered as packaged software or cloud services. Revenue is counted from licenses or subscriptions and standard support updates.
Scope exclusions: We exclude custom rule code embedded inside bespoke applications, workflow tools that do not have a rules engine, and pure professional services revenue.
Segments Covered in This Report
- By Offering
- Software
- Services
- By Organization Size
- Small and Medium Enterprises (SMEs)
- Large Enterprises
- By Deployment Type
- Cloud
- On-Premise
- By End-user Vertical
- BFSI
- Telecommunication and IT
- Retail and E-Commerce
- Manufacturing
- Healthcare and Life Sciences
- Government and Public Sector
- Other End-user Verticals
- By Business Function
- Finance and Accounting
- Operations and Supply Chain
- Sales and Marketing
- Risk and Compliance
- Customer Service
- By Geography
- North America
- United States
- Canada
- Mexico
- South America
- Brazil
- Argentina
- Chile
- Rest of South America
- Europe
- Germany
- United Kingdom
- France
- Italy
- Spain
- Russia
- Rest of Europe
- Asia-Pacific
- China
- India
- Japan
- South Korea
- Singapore
- Malaysia
- Australia
- Rest of Asia-Pacific
- Middle East and Africa
- Middle East
- United Arab Emirates
- Saudi Arabia
- Turkey
- Rest of Middle East
- Africa
- South Africa
- Nigeria
- Egypt
- Rest of Africa
- Middle East
- North America
Data Sources, Market Sizing, and Validation
Desk Research
Desk research is used to set the market perimeter and to anchor demand signals that can be checked year over year. We start with public software spending and digital adoption indicators, then map them to where BRMS is typically purchased, deployed, and renewed.
Sources reviewed include, as examples, the US Census Bureau services statistics, Eurostat ICT and enterprise digitization series, OECD digital economy indicators, UN Comtrade for relevant enterprise software related trade proxies, and patent databases to track rules engine and decision automation activity. We also refer to company filings, investor presentations, reputable press, and procurement and tender notices when they describe licensing, renewals, or rollout timelines. For company-level context, a paid subscription covering company financials and another covering news and financials are used selectively to keep profiles consistent across regions. These desk research sources are not exhaustive, and many other public materials were also reviewed for data collection, validation, and clarification.
Primary Interviews and Surveys
Primary work is used to pressure test what the desk inputs cannot fully explain, especially pricing ranges, renewal behavior, and how buyers classify a BRMS versus adjacent automation tools. We speak with a mix of software providers, system integrators, and enterprise users across key industries, then re-check assumptions by region so the totals reflect how adoption is actually happening.
Distribution of primary research fieldwork respondents
| Company type | Respondent position | Region |
|---|---|---|
| Top tier: 35% | CXOs: 15% | APAC: 44% |
| Mid tier: 50% | Functional/Unit leaders: 29% | EMEA: 32% |
| Smaller Players: 15% | Managers: 56% | Americas: 24% |
Market-Sizing & Forecasting
The core model uses a top-down approach where enterprise software spending and digital transformation demand pools are reconstructed by region, then filtered through BRMS adoption indicators gathered from interviews and public signals. Because buyers often bundle decisioning features inside broader platforms, we keep a clear rule that revenue is counted only when a dedicated rules engine and rule authoring capability are delivered as a productized offering.
To keep the model grounded, inputs include (illustratively) BRMS license or subscription renewal cycles, typical seat or instance based pricing patterns, cloud versus on-premises delivery mix, the share of regulated process use cases that favor traceable decision logic, and the pace of policy change that forces frequent rule updates. Forecasts are produced using scenario analysis, where adoption and pricing trajectories are set by region and then adjusted using expert views on automation budgets and rule governance maturity. Select bottom-up checks are used to corroborate totals, such as sampled vendor revenue disclosures, channel partner direction on deal sizes, and ASP times volume estimates for common buyer cohorts, with gaps handled through conservative interpolation when disclosures are incomplete.
Data Validation & Update Cycle
Validation is done in steps so that errors are caught early and assumptions stay consistent. Model outputs are compared against independent signals like software spend growth, cloud migration pace, and patenting and procurement activity related to rules engines, and then variances are investigated before numbers are signed off.
If an anomaly shows up, such as a region growing faster than the available demand indicators suggest, we re-contact sources and re-check the driver inputs that caused the jump. Reports are refreshed annually, and interim updates are added when material events occur that can change pricing, adoption, or delivery patterns. Before delivery, a final review pass is completed so clients receive the latest updated view.
Mordor Intelligence's Business Rules Management Systems Market Size Compared Against Other Published Estimates
Published market sizes for BRMS often differ because the product perimeter is not treated the same way across studies, and assumptions around pricing and renewals are not always visible. Differences also come from the year used for currency conversion, how cloud subscriptions are annualized, and how frequently the model is refreshed.
Some external figures bundle broad services and adjacent workflow and automation tools into the same total. In Mordor Intelligence, the value is counted only for packaged BRMS software or cloud services that include a dedicated rules engine and rule authoring capability, with custom embedded rule code and pure professional services left out so the demand pool stays consistent.
Benchmark comparison
| Source | Market Size | Gaps in Research Methodology |
|---|---|---|
| Mordor Intelligence | USD 2.29 B (2025) | |
| Industry Newswire A | USD 1.80 B (2025) | Often reports an earlier-snapshot view that emphasizes component splits and can understate cloud subscription annualization, and it may rely on limited vendor coverage for mid-market adoption. |
| Market Bulletin B | USD 1.80 B (2025) | Commonly includes services like implementation and consulting as part of the total, and it can apply aggressive growth assumptions without clearly tying them to renewal cycles and usage based pricing progression. |
The spread in the table is mainly explained by what gets counted as product revenue versus services, and by how subscription value is annualized in the selected year. By keeping the inputs tied to repeatable checks like renewal behavior, delivery mix, and region-level adoption signals, we can give a balanced number that is easier to trace back to clear assumptions.
Key Questions Answered in the Report
What is the current value of the business rules management systems market?
The market reached USD 2.48 billion in 2026 and is projected to climb to USD 3.66 billion by 2031 at an 8.15% CAGR.
Which segment grows fastest in the business rules management systems market?
Services revenue is expanding at a 9.85% CAGR as enterprises rely on consulting and managed services for complex rule deployments.
Why are SMEs accelerating adoption of business rules technology?
SaaS pricing, low-code tools, and pre-configured rule packs remove large upfront costs, enabling SMEs to automate decisions at an 11.05% CAGR.
How does cloud deployment influence the business rules management systems market size?
Cloud platforms hold 67.70% revenue share and are growing at 9.35% because they offer elastic capacity and simplified upgrades.
What industries drive future growth?
Healthcare and life sciences lead future expansion at a 10.02% CAGR, while BFSI maintains the largest share based on risk and compliance use cases.
Which regions show strongest momentum?
Asia-Pacific is the fastest-growing region with an 10.62% CAGR, fueled by government digitalization programs and SME cloud adoption.