
| Study Period | 2017 - 2030 |
| Base Year For Estimation | 2024 |
| Forecast Data Period | 2025 - 2030 |
| Market Size (2025) | USD 25.69 Billion |
| Market Size (2030) | USD 30.91 Billion |
| CAGR (2025 - 2030) | 3.77 % |
| Market Concentration | High |
Major Players*Disclaimer: Major Players sorted in no particular order |


Business Jet Market Analysis
The Business Jet Market size is estimated at 25.69 billion USD in 2025, and is expected to reach 30.91 billion USD by 2030, growing at a CAGR of 3.77% during the forecast period (2025-2030).
The business jet industry is experiencing significant transformation driven by fleet modernization initiatives and changing ownership patterns. As of 2022, approximately one-third of the operational business jet fleet is over 10 years old, prompting operators and charter providers to invest heavily in fleet modernization programs. This aging fleet phenomenon has catalyzed a wave of technological upgrades and efficiency improvements across the jet industry. The ownership structure of the industry reveals interesting patterns, with 86% of business jets being wholly owned, while 12% operate under fractional ownership models, indicating a strong preference for complete asset control among operators.
The industry landscape is characterized by strong market consolidation and manufacturer specialization. The top five business jet manufacturers Cessna, Gulfstream Aerospace Corporation, Embraer, Bombardier, and Cirrus Aircraft collectively command 76% of the total active business jet fleet globally. This concentration of market power has led to increased competition in terms of technological innovation and service offerings. Manufacturers are focusing on developing more fuel-efficient aircraft with enhanced range capabilities and improved cabin comfort to meet evolving customer demands.
The infrastructure supporting the business aviation market continues to expand, with significant investments in maintenance, repair, and overhaul (MRO) facilities worldwide. In 2023, major developments include Bombardier's establishment of a new service center at Abu Dhabi International Airport, marking a significant expansion of maintenance capabilities in the Middle East. These infrastructure investments are crucial for supporting the projected delivery of approximately 6,700 new business jets during the 2023-2030 period, ensuring adequate maintenance and support services for the growing fleet.
The industry is witnessing a shift in aircraft design and capabilities, with manufacturers focusing on larger cabin sizes and increased range capabilities. The current fleet composition reflects these preferences, with large jets accounting for 45% of the global fleet, followed by light jets at 41%, and mid-size jets comprising 13%. This distribution indicates a strong market preference for aircraft that can accommodate more passengers and operate over longer distances, reflecting the evolving needs of private jet industry customers who increasingly require aircraft capable of intercontinental travel while maintaining high levels of comfort and productivity.
Global Business Jet Market Trends
The HNWI population is booming and is expected to be the biggest growth driver for the market
- HNWIs have over USD 1 million in liquid financial assets, while UHNWIs have a net worth of at least USD 30 million. From 2017 to 2022, there was a surge of around 90% in the HNWI population in the region. In 2022, the number of HNWIs in Asia-Pacific increased by 2% compared to 2020.
- Japan witnessed a growth rate of 15% in 2022. The slow growth of the HNWI population in major countries has affected the overall wealth growth in Asia-Pacific. In China, the increase in average wealth led to more than 70% in the number of millionaires. Asia-Pacific is emerging as the leading destination for wealth management and private banking globally, driven by the growing wealth in the region, the increasing HNWI population, and its need for financial advice.
- Factors such as a change in political leadership and low consumption during the pandemic impacted the Japanese Stock market, Nikkei 225, and hampered the growth of HNWIs in the country. Developing countries such as India, Vietnam, and Thailand witnessed growth in HNWIs compared to the leading Asia-Pacific countries. In 202, India witnessed a growth of over 292% in its HNWI population. Thailand and Vietnam witnessed a growth of around 21% and 13%, respectively. High liquidity support by central banks, supportive domestic policy, and stability in the stock markets aided the growth of HNWIs in these countries. Technology, industrial conglomerates, energy, and real estate were the major sectors that accounted for most of the Asia-Pacific HNWI population.
-By-Country,-Number-of-HNWIs,-Asia-Pacific,-2017---2030.svg)
Understand The Key Trends Shaping This Market
Download PDF
OTHER KEY INDUSTRY TRENDS COVERED IN THE REPORT
- Rise in the HNWI population acting as the major growth driver for the market
- Rise in the HNWI population is acting as the major growth driver for the market
- Oil and gas and real estate were the major industries that boosted the growth of HNWIs in the Middle East
- The trend of migration in South America's HNWI population has been witnessed in the last several years
Segment Analysis: Body Type
Large Jet Segment in Business Jet Market
The large business jets segment dominates the global business jet market, accounting for approximately 82% of the total market value in 2024. This segment's prominence is driven by the increasing demand from high-net-worth individuals (HNWIs) and ultra-high-net-worth individuals (UHNWIs) who prefer premium quality and convenient jets with large and personalized spaces. The segment is also experiencing the highest growth rate in the market, projected to grow at around 4% through 2029. The growth is primarily attributed to the rising equity markets and government stimulus measures that have led to an increase in HNWI wealth, particularly in regions like North America and Europe. Large business jets are especially popular for intercontinental travel and long-range business operations, offering superior comfort, advanced technology integration, and enhanced cabin customization options that cater to the sophisticated needs of corporate executives and wealthy individuals.
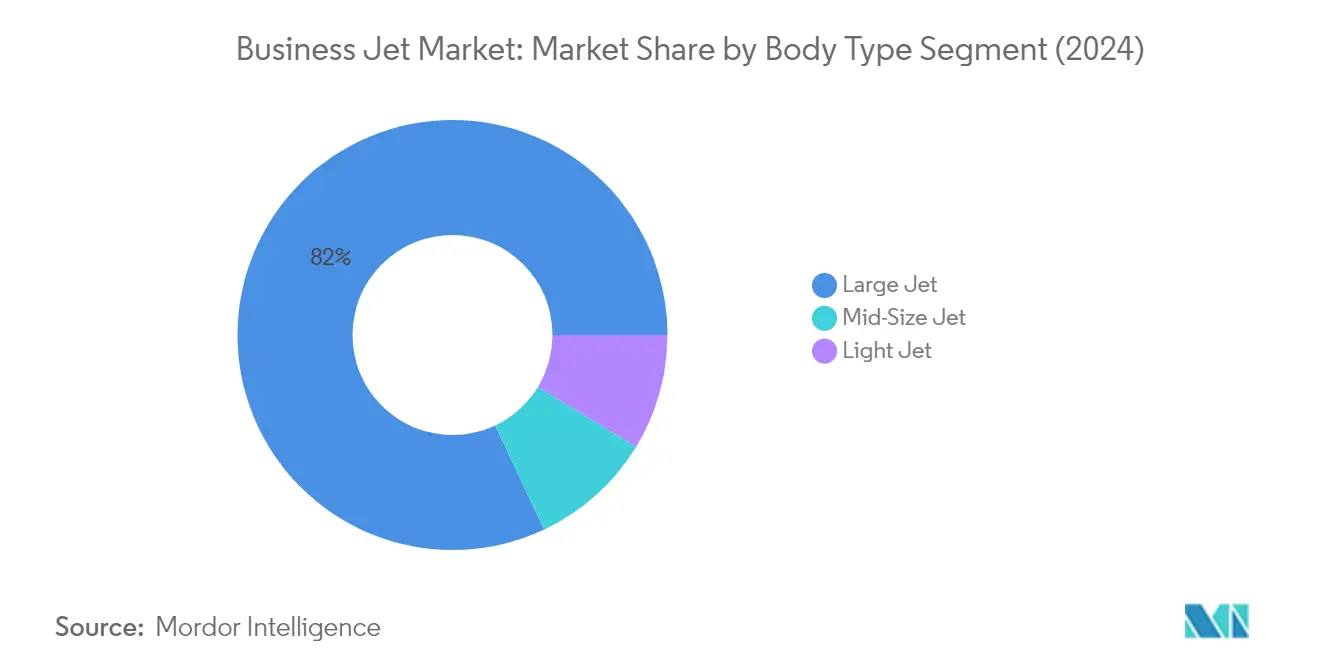
Remaining Segments in Body Type
The light jet and mid-size jet segments represent important niches in the private jet market, collectively accounting for the remaining market share. Light jets serve as an entry point for many first-time private jet owners and are particularly popular among small business owners and entrepreneurs due to their cost-effectiveness and efficiency for shorter routes. These aircraft are especially prevalent in regions with developed networks of smaller airports. Mid-size jets occupy a sweet spot in the business aircraft market, combining the speed and cabin amenities of heavy jets with the lower operating costs of lighter jets, making them particularly attractive for transcontinental flights and medium-range business operations. Both segments continue to see technological advancements in fuel efficiency and cabin comfort, maintaining their appeal to specific customer segments with distinct operational requirements.
Business Jet Market Geography Segment Analysis
Business Jet Market in Asia-Pacific
The Asia-Pacific business jet market demonstrates significant growth potential, driven by increasing economic development and rising demand for private aviation services. Countries like China, India, Japan, and Singapore represent key markets in the region, with varying levels of market maturity and growth trajectories. The region has witnessed substantial investments in aviation infrastructure, particularly in Southeast Asian nations like Malaysia, Thailand, and Indonesia. The presence of dedicated MRO facilities and regional aviation centers has further strengthened the business aviation market across the Asia-Pacific region.
Business Jet Market in China
China dominates the Asia-Pacific business jet market, holding approximately 35% market share in 2024. As the largest operator of business jets in Asia-Pacific, China's government considers general aviation a strategic emerging industry. The country has significantly expanded its aviation infrastructure by adding numerous general aviation airports, demonstrating the government's commitment to developing private aviation. The large jet segment is experiencing particularly rapid growth, driven by the increasing number of high-net-worth individuals (HNWIs) in the country and their preference for long-range large-cabin jets.
Business Jet Market in Singapore
Singapore emerges as the fastest-growing market in the Asia-Pacific region, with a projected growth rate of approximately 7% during 2024-2029. The country's strategic position as a major hub for MRO services globally has attracted significant investments from major business jet manufacturers. The pandemic has created a trend in private flying among the ultra-wealthy population in the region, contributing to increased procurement of business aircraft. The country's well-developed aviation infrastructure and business-friendly environment continue to attract international operators and high-net-worth individuals.
Business Jet Market in Europe
Europe's business jet market demonstrates robust growth, supported by its sophisticated aviation infrastructure and strong demand from both corporate and private sectors. The region benefits from a well-established network of airports, FBOs, and maintenance facilities across countries like Germany, France, the UK, and Italy. The market has shown remarkable resilience post-pandemic, with an increased focus on private aviation solutions among high-net-worth individuals and corporate clients.
Business Jet Market in United Kingdom
The United Kingdom leads the European business jet market, commanding approximately 25% market share in 2024. The country serves as a vital center for international business and finance, with London being a crucial hub for business aviation market activities. The UK's business aviation sector benefits from a diverse fleet composition and a strong presence of charter operators. The concentration of high-net-worth individuals and corporate headquarters in London and other major cities continues to drive demand for business aviation services.
Business Jet Market in Russia
Russia represents the fastest-growing market in Europe, with a projected growth rate of approximately 17% during 2024-2029. Despite recent challenges, the country maintains ambitious plans for business aviation market development, including the construction of large-scale business aviation terminals and infrastructure improvements. The market shows particular strength in the large-cabin segment, reflecting the preference for sophisticated, long-range aircraft among Russian operators.
Business Jet Market in Middle East and Africa
The Middle East and Africa region presents a dynamic market for business jets, characterized by strong demand from oil-rich Gulf nations and emerging African economies. The region has witnessed substantial investments in aviation infrastructure, particularly in the UAE, Saudi Arabia, and Qatar. The market shows a distinct preference for large-cabin and ultra-long-range aircraft, reflecting the region's requirements for intercontinental travel capabilities.
Business Jet Market in Qatar
Qatar emerges as the largest market in the Middle East and Africa region, supported by its robust economy and strategic location. The country's business aviation market benefits from significant investments in infrastructure and strong demand from both government and private sectors. The preference for large-cabin and long-range business jets reflects the luxury and comfort requirements of Qatar's ultra-high-net-worth individuals and corporate clients.
Business Jet Market in Saudi Arabia
Saudi Arabia represents the fastest-growing market in the Middle East and Africa region, driven by ambitious economic diversification plans and increasing private sector participation. The kingdom's aviation sector benefits from substantial investments in infrastructure and growing demand from both government and private sectors. The market shows particular strength in the large jet segment, reflecting the preferences of Saudi Arabia's growing population of ultra-high-net-worth individuals.
Business Jet Market in North America
North America maintains its position as the world's largest business jet market, characterized by mature infrastructure and a diverse operator base. The region benefits from extensive networks of airports, maintenance facilities, and support services across the United States, Canada, and Mexico. The United States leads the regional market as the largest country, while Canada demonstrates the fastest growth rate. The market shows strong demand across all aircraft categories, from light jets to ultra-long-range aircraft, reflecting the diverse needs of North American operators.
Business Jet Market in South America
The South American business jet market shows promising growth potential, driven by increasing business activities and growing wealth in major economies. Brazil dominates the regional market as both the largest and fastest-growing country, followed by significant contributions from Chile and Colombia. The region demonstrates a particular preference for light jets due to regional travel patterns and infrastructure capabilities, though demand for larger aircraft continues to grow among ultra-high-net-worth individuals and corporate operators.
Get Analysis on Important Geographic Markets
Download PDF
Business Jet Industry Overview
Top Companies in Business Jet Market
The business jet market is characterized by continuous product innovation and strategic expansion initiatives by major players. Business jet manufacturers are focusing on developing technologically advanced aircraft with enhanced range capabilities, fuel efficiency, and luxurious cabin configurations to meet evolving customer preferences. Companies are strengthening their global presence through expanded service networks, maintenance facilities, and strategic partnerships with regional operators. There has been a notable trend in launching new aircraft models targeting specific market segments, from light jets to ultra-long-range business aircraft. Market leaders are investing in sustainable aviation technologies and digital solutions while expanding their maintenance, repair, and overhaul (MRO) capabilities worldwide. The industry has witnessed significant agreements with charter operators and fleet management companies, indicating a shift towards more flexible ownership models and enhanced service offerings.
Consolidated Market Led By Global Players
The business jet market exhibits a highly consolidated structure dominated by established global manufacturers with extensive production capabilities and comprehensive service networks. These major players leverage their strong brand recognition, technological expertise, and extensive distribution channels to maintain their market positions. The industry is characterized by high barriers to entry due to substantial capital requirements, stringent regulatory compliance needs, and the necessity for advanced technological capabilities. While some regional players maintain a significant presence in specific market segments, the overall landscape is controlled by large aerospace conglomerates with diverse product portfolios.
The market has witnessed limited merger and acquisition activity, with companies focusing more on organic growth and strategic partnerships rather than consolidation. Major manufacturers are increasingly emphasizing vertical integration to maintain control over critical components and technologies. The competitive dynamics are shaped by long-term relationships with suppliers, certification requirements, and the ability to provide comprehensive aftermarket support. Companies are also establishing strategic alliances with technology providers and regional partners to enhance their market reach and service capabilities.
Innovation and Service Network Drive Success
Success in the business jet market increasingly depends on manufacturers' ability to innovate while maintaining operational efficiency and customer service excellence. Corporate jet manufacturers must focus on developing aircraft that offer superior performance, reduced environmental impact, and enhanced connectivity features to meet evolving customer demands. Building and maintaining a robust global service network is crucial for supporting the growing fleet and ensuring customer satisfaction. Manufacturers need to invest in digital technologies for both aircraft systems and customer support while developing sustainable aviation solutions to address environmental concerns.
Market players must adapt to changing ownership models and customer preferences, including the rising popularity of charter services and fractional ownership programs. Success factors include the ability to offer flexible financing solutions, comprehensive maintenance packages, and seamless customer experience across all touchpoints. Companies need to navigate complex regulatory environments while maintaining cost competitiveness and production efficiency. The development of strategic partnerships with technology providers, service organizations, and regional operators remains crucial for expanding market presence and enhancing service capabilities. Future success will depend on balancing innovation with operational excellence while maintaining strong relationships with key stakeholders across the value chain.
Business Jet Market Leaders
-
Bombardier Inc.
-
Dassault Aviation
-
Embraer
-
General Dynamics Corporation
-
Textron Inc.
- *Disclaimer: Major Players sorted in no particular order

Need More Details on Market Players and Competiters?
Download PDF
Business Jet Market News
- October 2023: Textron Aviation announced that it entered a purchase agreement with Fly Alliance for up to 20 Cessna Citation business jets, with options for 16 additional aircraft. Fly Alliance is expected to use the aircraft for its luxury private jet charter operations. It expected the delivery of the first aircraft, an XLS Gen2, in 2023.
- June 2023: Gulfstream Aerospace Corp. announced today the further expansion of its completions and outfitting operations at St. Louis Downtown Airport. With this latest expansion, Gulfstream is expected to increase completion operations at the site while modernizing its existing spaces by adding new, state-of-the-art equipment and tooling, representing a total capital investment of USD 28.5 million.
- June 2023: Gulfstream Aerospace Corp. announced the super-midsize Gulfstream G280 has been cleared for operations at France’s Airport of the Gulf of Saint-Tropez located in La Môle. The aircraft recently flew several takeoff and landing demonstrations at the short-field airport.
Free With This Report
We provide a complimentary and exhaustive set of data points on global and regional metrics that present the fundamental structure of the industry. Presented in the form of 45+ free charts, the section covers data on commercial aircraft deliveries by manufacturer, backlogs of commercial aircraft, active military aircraft fleet by type of aircraft, overall business jets and helicopters fleet by manufacturer and also classified by type of ownership.


Business Jet Market Report - Table of Contents
1. EXECUTIVE SUMMARY & KEY FINDINGS
2. REPORT OFFERS
3. INTRODUCTION
- 3.1 Study Assumptions & Market Definition
- 3.2 Scope of the Study
- 3.3 Research Methodology
4. KEY INDUSTRY TRENDS
-
4.1 High-net-worth Individual (hnwi)
- 4.1.1 Asia-Pacific
- 4.1.2 Europe
- 4.1.3 Middle East and Africa
- 4.1.4 North America
- 4.1.5 South America
- 4.2 Regulatory Framework
- 4.3 Value Chain Analysis
5. MARKET SEGMENTATION (includes market size in Value in USD and Volume, Forecasts up to 2030 and analysis of growth prospects)
-
5.1 Body Type
- 5.1.1 Large Jet
- 5.1.2 Light Jet
- 5.1.3 Mid-Size Jet
-
5.2 Region
- 5.2.1 Asia-Pacific
- 5.2.1.1 Australia
- 5.2.1.2 China
- 5.2.1.3 India
- 5.2.1.4 Indonesia
- 5.2.1.5 Japan
- 5.2.1.6 Malaysia
- 5.2.1.7 Philippines
- 5.2.1.8 Singapore
- 5.2.1.9 South Korea
- 5.2.1.10 Thailand
- 5.2.1.11 Rest of Asia-Pacific
- 5.2.2 Europe
- 5.2.2.1 France
- 5.2.2.2 Germany
- 5.2.2.3 Italy
- 5.2.2.4 Netherlands
- 5.2.2.5 Russia
- 5.2.2.6 Spain
- 5.2.2.7 Turkey
- 5.2.2.8 UK
- 5.2.2.9 Rest of Europe
- 5.2.3 Middle East and Africa
- 5.2.3.1 Algeria
- 5.2.3.2 Egypt
- 5.2.3.3 Qatar
- 5.2.3.4 Saudi Arabia
- 5.2.3.5 South Africa
- 5.2.3.6 United Arab Emirates
- 5.2.3.7 Rest of Middle East and Africa
- 5.2.4 North America
- 5.2.4.1 Canada
- 5.2.4.2 Mexico
- 5.2.4.3 United States
- 5.2.4.4 Rest of North America
- 5.2.5 South America
- 5.2.5.1 Brazil
- 5.2.5.2 Chile
- 5.2.5.3 Colombia
- 5.2.5.4 Rest of South America
6. COMPETITIVE LANDSCAPE
- 6.1 Key Strategic Moves
- 6.2 Market Share Analysis
- 6.3 Company Landscape
-
6.4 Company Profiles
- 6.4.1 Airbus SE
- 6.4.2 Bombardier Inc.
- 6.4.3 Cirrus Design Corporation
- 6.4.4 Dassault Aviation
- 6.4.5 Embraer
- 6.4.6 General Dynamics Corporation
- 6.4.7 Honda Motor Co., Ltd.
- 6.4.8 Pilatus Aircraft Ltd
- 6.4.9 Textron Inc.
- 6.4.10 The Boeing Company
- *List Not Exhaustive
7. KEY STRATEGIC QUESTIONS FOR AVIATION CEOS
8. APPENDIX
-
8.1 Global Overview
- 8.1.1 Overview
- 8.1.2 Porter’s Five Forces Framework
- 8.1.3 Global Value Chain Analysis
- 8.1.4 Market Dynamics (DROs)
- 8.2 Sources & References
- 8.3 List of Tables & Figures
- 8.4 Primary Insights
- 8.5 Data Pack
- 8.6 Glossary of Terms
You Can Purchase Parts Of This Report. Check Out Prices For Specific Sections
Get Price Break-up Now
List of Tables & Figures
- Figure 1:
- POPULATION OF HIGH-NET-WORTH INDIVIDUAL (HNWI) BY COUNTRY, NUMBER OF HNWIS, ASIA-PACIFIC, 2017 - 2030
- Figure 2:
- POPULATION OF HIGH-NET-WORTH INDIVIDUAL (HNWI) BY COUNTRY, NUMBER OF HNWIS, EUROPE, 2017 - 2030
- Figure 3:
- POPULATION OF HIGH-NET-WORTH INDIVIDUAL (HNWI) BY COUNTRY, NUMBER OF HNWIS, MIDDLE EAST AND AFRICA, 2017 - 2030
- Figure 4:
- POPULATION OF HIGH-NET-WORTH INDIVIDUAL (HNWI) BY COUNTRY, NUMBER OF HNWIS, NORTH AMERICA, 2017 - 2030
- Figure 5:
- POPULATION OF HIGH-NET-WORTH INDIVIDUAL (HNWI) BY COUNTRY, NUMBER OF HNWIS, SOUTH AMERICA, 2017 - 2030
- Figure 6:
- NUMBER OF NEW AIRCRAFT DELIVERIES, VOLUME, GLOBAL, 2017 - 2030
- Figure 7:
- NUMBER OF NEW AIRCRAFT DELIVERIES, USD, GLOBAL, 2017 - 2030
- Figure 8:
- BUSINESS JETS DELIVERIES BY BODY TYPE, VOLUME, GLOBAL, 2017 - 2030
- Figure 9:
- BUSINESS JETS DELIVERIES BY BODY TYPE, USD, GLOBAL, 2017 - 2030
- Figure 10:
- BUSINESS JETS DELIVERIES BY BODY TYPE, VOLUME %, GLOBAL, 2017 VS 2023 VS 2030
- Figure 11:
- BUSINESS JETS DELIVERIES BY BODY TYPE, VALUE %, GLOBAL, 2017 VS 2023 VS 2030
- Figure 12:
- GLOBAL BUSINESS JET MARKET, BY LARGE JET, UNITS, 2017 - 2030
- Figure 13:
- GLOBAL BUSINESS JET MARKET, BY LARGE JET, USD, 2017 - 2030
- Figure 14:
- GLOBAL BUSINESS JET MARKET, BY BODY TYPE, USD, %, 2023 VS 2030
- Figure 15:
- GLOBAL BUSINESS JET MARKET, BY LIGHT JET, UNITS, 2017 - 2030
- Figure 16:
- GLOBAL BUSINESS JET MARKET, BY LIGHT JET, USD, 2017 - 2030
- Figure 17:
- GLOBAL BUSINESS JET MARKET, BY BODY TYPE, USD, %, 2023 VS 2030
- Figure 18:
- GLOBAL BUSINESS JET MARKET, BY MID-SIZE JET, UNITS, 2017 - 2030
- Figure 19:
- GLOBAL BUSINESS JET MARKET, BY MID-SIZE JET, USD, 2017 - 2030
- Figure 20:
- GLOBAL BUSINESS JET MARKET, BY BODY TYPE, USD, %, 2023 VS 2030
- Figure 21:
- BUSINESS JETS DELIVERIES BY REGION, VOLUME, GLOBAL, 2017 - 2030
- Figure 22:
- BUSINESS JETS DELIVERIES BY REGION, USD, GLOBAL, 2017 - 2030
- Figure 23:
- BUSINESS JETS DELIVERIES BY REGION, VOLUME %, GLOBAL, 2017 VS 2023 VS 2030
- Figure 24:
- BUSINESS JETS DELIVERIES BY REGION, VALUE %, GLOBAL, 2017 VS 2023 VS 2030
- Figure 25:
- BUSINESS JETS DELIVERIES BY COUNTRY, VOLUME, ASIA-PACIFIC, 2017 - 2030
- Figure 26:
- BUSINESS JETS DELIVERIES BY COUNTRY, USD, ASIA-PACIFIC, 2017 - 2030
- Figure 27:
- BUSINESS JETS DELIVERIES BY COUNTRY, VOLUME %, ASIA-PACIFIC, 2017 VS 2023 VS 2030
- Figure 28:
- BUSINESS JETS DELIVERIES BY COUNTRY, VALUE %, ASIA-PACIFIC, 2017 VS 2023 VS 2030
- Figure 29:
- GLOBAL BUSINESS JET MARKET, BY AUSTRALIA, UNITS, 2017 - 2030
- Figure 30:
- GLOBAL BUSINESS JET MARKET, BY AUSTRALIA, USD, 2017 - 2030
- Figure 31:
- BUSINESS JETS DELIVERIES SHARE, VALUE, %, AUSTRALIA, 2023 VS 2030
- Figure 32:
- GLOBAL BUSINESS JET MARKET, BY CHINA, UNITS, 2017 - 2030
- Figure 33:
- GLOBAL BUSINESS JET MARKET, BY CHINA, USD, 2017 - 2030
- Figure 34:
- BUSINESS JETS DELIVERIES SHARE, VALUE, %, CHINA, 2023 VS 2030
- Figure 35:
- GLOBAL BUSINESS JET MARKET, BY INDIA, UNITS, 2017 - 2030
- Figure 36:
- GLOBAL BUSINESS JET MARKET, BY INDIA, USD, 2017 - 2030
- Figure 37:
- BUSINESS JETS DELIVERIES SHARE, VALUE, %, INDIA, 2023 VS 2030
- Figure 38:
- GLOBAL BUSINESS JET MARKET, BY INDONESIA, UNITS, 2017 - 2030
- Figure 39:
- GLOBAL BUSINESS JET MARKET, BY INDONESIA, USD, 2017 - 2030
- Figure 40:
- BUSINESS JETS DELIVERIES SHARE, VALUE, %, INDONESIA, 2023 VS 2030
- Figure 41:
- GLOBAL BUSINESS JET MARKET, BY JAPAN, UNITS, 2017 - 2030
- Figure 42:
- GLOBAL BUSINESS JET MARKET, BY JAPAN, USD, 2017 - 2030
- Figure 43:
- BUSINESS JETS DELIVERIES SHARE, VALUE, %, JAPAN, 2023 VS 2030
- Figure 44:
- GLOBAL BUSINESS JET MARKET, BY MALAYSIA, UNITS, 2017 - 2030
- Figure 45:
- GLOBAL BUSINESS JET MARKET, BY MALAYSIA, USD, 2017 - 2030
- Figure 46:
- BUSINESS JETS DELIVERIES SHARE, VALUE, %, MALAYSIA, 2023 VS 2030
- Figure 47:
- GLOBAL BUSINESS JET MARKET, BY PHILIPPINES, UNITS, 2017 - 2030
- Figure 48:
- GLOBAL BUSINESS JET MARKET, BY PHILIPPINES, USD, 2017 - 2030
- Figure 49:
- BUSINESS JETS DELIVERIES SHARE, VALUE, %, PHILIPPINES, 2023 VS 2030
- Figure 50:
- GLOBAL BUSINESS JET MARKET, BY SINGAPORE, UNITS, 2017 - 2030
- Figure 51:
- GLOBAL BUSINESS JET MARKET, BY SINGAPORE, USD, 2017 - 2030
- Figure 52:
- BUSINESS JETS DELIVERIES SHARE, VALUE, %, SINGAPORE, 2023 VS 2030
- Figure 53:
- GLOBAL BUSINESS JET MARKET, BY SOUTH KOREA, UNITS, 2017 - 2030
- Figure 54:
- GLOBAL BUSINESS JET MARKET, BY SOUTH KOREA, USD, 2017 - 2030
- Figure 55:
- BUSINESS JETS DELIVERIES SHARE, VALUE, %, SOUTH KOREA, 2023 VS 2030
- Figure 56:
- GLOBAL BUSINESS JET MARKET, BY THAILAND, UNITS, 2017 - 2030
- Figure 57:
- GLOBAL BUSINESS JET MARKET, BY THAILAND, USD, 2017 - 2030
- Figure 58:
- BUSINESS JETS DELIVERIES SHARE, VALUE, %, THAILAND, 2023 VS 2030
- Figure 59:
- GLOBAL BUSINESS JET MARKET, BY REST OF ASIA-PACIFIC, UNITS, 2017 - 2030
- Figure 60:
- GLOBAL BUSINESS JET MARKET, BY REST OF ASIA-PACIFIC, USD, 2017 - 2030
- Figure 61:
- BUSINESS JETS DELIVERIES SHARE, VALUE, %, REST OF ASIA-PACIFIC, 2023 VS 2030
- Figure 62:
- BUSINESS JETS DELIVERIES BY COUNTRY, VOLUME, EUROPE, 2017 - 2030
- Figure 63:
- BUSINESS JETS DELIVERIES BY COUNTRY, USD, EUROPE, 2017 - 2030
- Figure 64:
- BUSINESS JETS DELIVERIES BY COUNTRY, VOLUME %, EUROPE, 2017 VS 2023 VS 2030
- Figure 65:
- BUSINESS JETS DELIVERIES BY COUNTRY, VALUE %, EUROPE, 2017 VS 2023 VS 2030
- Figure 66:
- GLOBAL BUSINESS JET MARKET, BY FRANCE, UNITS, 2017 - 2030
- Figure 67:
- GLOBAL BUSINESS JET MARKET, BY FRANCE, USD, 2017 - 2030
- Figure 68:
- BUSINESS JETS DELIVERIES SHARE, VALUE, %, FRANCE, 2023 VS 2030
- Figure 69:
- GLOBAL BUSINESS JET MARKET, BY GERMANY, UNITS, 2017 - 2030
- Figure 70:
- GLOBAL BUSINESS JET MARKET, BY GERMANY, USD, 2017 - 2030
- Figure 71:
- BUSINESS JETS DELIVERIES SHARE, VALUE, %, GERMANY, 2023 VS 2030
- Figure 72:
- GLOBAL BUSINESS JET MARKET, BY ITALY, UNITS, 2017 - 2030
- Figure 73:
- GLOBAL BUSINESS JET MARKET, BY ITALY, USD, 2017 - 2030
- Figure 74:
- BUSINESS JETS DELIVERIES SHARE, VALUE, %, ITALY, 2023 VS 2030
- Figure 75:
- GLOBAL BUSINESS JET MARKET, BY NETHERLANDS, UNITS, 2017 - 2030
- Figure 76:
- GLOBAL BUSINESS JET MARKET, BY NETHERLANDS, USD, 2017 - 2030
- Figure 77:
- BUSINESS JETS DELIVERIES SHARE, VALUE, %, NETHERLANDS, 2023 VS 2030
- Figure 78:
- GLOBAL BUSINESS JET MARKET, BY RUSSIA, UNITS, 2017 - 2030
- Figure 79:
- GLOBAL BUSINESS JET MARKET, BY RUSSIA, USD, 2017 - 2030
- Figure 80:
- BUSINESS JETS DELIVERIES SHARE, VALUE, %, RUSSIA, 2023 VS 2030
- Figure 81:
- GLOBAL BUSINESS JET MARKET, BY SPAIN, UNITS, 2017 - 2030
- Figure 82:
- GLOBAL BUSINESS JET MARKET, BY SPAIN, USD, 2017 - 2030
- Figure 83:
- BUSINESS JETS DELIVERIES SHARE, VALUE, %, SPAIN, 2023 VS 2030
- Figure 84:
- GLOBAL BUSINESS JET MARKET, BY TURKEY, UNITS, 2017 - 2030
- Figure 85:
- GLOBAL BUSINESS JET MARKET, BY TURKEY, USD, 2017 - 2030
- Figure 86:
- BUSINESS JETS DELIVERIES SHARE, VALUE, %, TURKEY, 2023 VS 2030
- Figure 87:
- GLOBAL BUSINESS JET MARKET, BY UK, UNITS, 2017 - 2030
- Figure 88:
- GLOBAL BUSINESS JET MARKET, BY UK, USD, 2017 - 2030
- Figure 89:
- BUSINESS JETS DELIVERIES SHARE, VALUE, %, UK, 2023 VS 2030
- Figure 90:
- GLOBAL BUSINESS JET MARKET, BY REST OF EUROPE, UNITS, 2017 - 2030
- Figure 91:
- GLOBAL BUSINESS JET MARKET, BY REST OF EUROPE, USD, 2017 - 2030
- Figure 92:
- BUSINESS JETS DELIVERIES SHARE, VALUE, %, REST OF EUROPE, 2023 VS 2030
- Figure 93:
- BUSINESS JETS DELIVERIES BY COUNTRY, VOLUME, MIDDLE EAST AND AFRICA, 2017 - 2030
- Figure 94:
- BUSINESS JETS DELIVERIES BY COUNTRY, USD, MIDDLE EAST AND AFRICA, 2017 - 2030
- Figure 95:
- BUSINESS JETS DELIVERIES BY COUNTRY, VOLUME %, MIDDLE EAST AND AFRICA, 2017 VS 2023 VS 2030
- Figure 96:
- BUSINESS JETS DELIVERIES BY COUNTRY, VALUE %, MIDDLE EAST AND AFRICA, 2017 VS 2023 VS 2030
- Figure 97:
- GLOBAL BUSINESS JET MARKET, BY ALGERIA, UNITS, 2017 - 2030
- Figure 98:
- GLOBAL BUSINESS JET MARKET, BY ALGERIA, USD, 2017 - 2030
- Figure 99:
- BUSINESS JETS DELIVERIES SHARE, VALUE, %, ALGERIA, 2023 VS 2030
- Figure 100:
- GLOBAL BUSINESS JET MARKET, BY EGYPT, UNITS, 2017 - 2030
- Figure 101:
- GLOBAL BUSINESS JET MARKET, BY EGYPT, USD, 2017 - 2030
- Figure 102:
- BUSINESS JETS DELIVERIES SHARE, VALUE, %, EGYPT, 2023 VS 2030
- Figure 103:
- GLOBAL BUSINESS JET MARKET, BY QATAR, UNITS, 2017 - 2030
- Figure 104:
- GLOBAL BUSINESS JET MARKET, BY QATAR, USD, 2017 - 2030
- Figure 105:
- BUSINESS JETS DELIVERIES SHARE, VALUE, %, QATAR, 2023 VS 2030
- Figure 106:
- GLOBAL BUSINESS JET MARKET, BY SAUDI ARABIA, UNITS, 2017 - 2030
- Figure 107:
- GLOBAL BUSINESS JET MARKET, BY SAUDI ARABIA, USD, 2017 - 2030
- Figure 108:
- BUSINESS JETS DELIVERIES SHARE, VALUE, %, SAUDI ARABIA, 2023 VS 2030
- Figure 109:
- GLOBAL BUSINESS JET MARKET, BY SOUTH AFRICA, UNITS, 2017 - 2030
- Figure 110:
- GLOBAL BUSINESS JET MARKET, BY SOUTH AFRICA, USD, 2017 - 2030
- Figure 111:
- BUSINESS JETS DELIVERIES SHARE, VALUE, %, SOUTH AFRICA, 2023 VS 2030
- Figure 112:
- GLOBAL BUSINESS JET MARKET, BY UNITED ARAB EMIRATES, UNITS, 2017 - 2030
- Figure 113:
- GLOBAL BUSINESS JET MARKET, BY UNITED ARAB EMIRATES, USD, 2017 - 2030
- Figure 114:
- BUSINESS JETS DELIVERIES SHARE, VALUE, %, UNITED ARAB EMIRATES, 2023 VS 2030
- Figure 115:
- GLOBAL BUSINESS JET MARKET, BY REST OF MIDDLE EAST AND AFRICA, UNITS, 2017 - 2030
- Figure 116:
- GLOBAL BUSINESS JET MARKET, BY REST OF MIDDLE EAST AND AFRICA, USD, 2017 - 2030
- Figure 117:
- BUSINESS JETS DELIVERIES SHARE, VALUE, %, REST OF MIDDLE EAST AND AFRICA, 2023 VS 2030
- Figure 118:
- BUSINESS JETS DELIVERIES BY COUNTRY, VOLUME, NORTH AMERICA, 2017 - 2030
- Figure 119:
- BUSINESS JETS DELIVERIES BY COUNTRY, USD, NORTH AMERICA, 2017 - 2030
- Figure 120:
- BUSINESS JETS DELIVERIES BY COUNTRY, VOLUME %, NORTH AMERICA, 2017 VS 2023 VS 2030
- Figure 121:
- BUSINESS JETS DELIVERIES BY COUNTRY, VALUE %, NORTH AMERICA, 2017 VS 2023 VS 2030
- Figure 122:
- GLOBAL BUSINESS JET MARKET, BY CANADA, UNITS, 2017 - 2030
- Figure 123:
- GLOBAL BUSINESS JET MARKET, BY CANADA, USD, 2017 - 2030
- Figure 124:
- BUSINESS JETS DELIVERIES SHARE, VALUE, %, CANADA, 2023 VS 2030
- Figure 125:
- GLOBAL BUSINESS JET MARKET, BY MEXICO, UNITS, 2017 - 2030
- Figure 126:
- GLOBAL BUSINESS JET MARKET, BY MEXICO, USD, 2017 - 2030
- Figure 127:
- BUSINESS JETS DELIVERIES SHARE, VALUE, %, MEXICO, 2023 VS 2030
- Figure 128:
- GLOBAL BUSINESS JET MARKET, BY UNITED STATES, UNITS, 2017 - 2030
- Figure 129:
- GLOBAL BUSINESS JET MARKET, BY UNITED STATES, USD, 2017 - 2030
- Figure 130:
- BUSINESS JETS DELIVERIES SHARE, VALUE, %, UNITED STATES, 2023 VS 2030
- Figure 131:
- GLOBAL BUSINESS JET MARKET, BY REST OF NORTH AMERICA, UNITS, 2017 - 2030
- Figure 132:
- GLOBAL BUSINESS JET MARKET, BY REST OF NORTH AMERICA, USD, 2017 - 2030
- Figure 133:
- BUSINESS JETS DELIVERIES SHARE, VALUE, %, REST OF NORTH AMERICA, 2023 VS 2030
- Figure 134:
- BUSINESS JETS DELIVERIES BY COUNTRY, VOLUME, SOUTH AMERICA, 2017 - 2030
- Figure 135:
- BUSINESS JETS DELIVERIES BY COUNTRY, USD, SOUTH AMERICA, 2017 - 2030
- Figure 136:
- BUSINESS JETS DELIVERIES BY COUNTRY, VOLUME %, SOUTH AMERICA, 2017 VS 2023 VS 2030
- Figure 137:
- BUSINESS JETS DELIVERIES BY COUNTRY, VALUE %, SOUTH AMERICA, 2017 VS 2023 VS 2030
- Figure 138:
- GLOBAL BUSINESS JET MARKET, BY BRAZIL, UNITS, 2017 - 2030
- Figure 139:
- GLOBAL BUSINESS JET MARKET, BY BRAZIL, USD, 2017 - 2030
- Figure 140:
- BUSINESS JETS DELIVERIES SHARE, VALUE, %, BRAZIL, 2023 VS 2030
- Figure 141:
- GLOBAL BUSINESS JET MARKET, BY CHILE, UNITS, 2017 - 2030
- Figure 142:
- GLOBAL BUSINESS JET MARKET, BY CHILE, USD, 2017 - 2030
- Figure 143:
- BUSINESS JETS DELIVERIES SHARE, VALUE, %, CHILE, 2023 VS 2030
- Figure 144:
- GLOBAL BUSINESS JET MARKET, BY COLOMBIA, UNITS, 2017 - 2030
- Figure 145:
- GLOBAL BUSINESS JET MARKET, BY COLOMBIA, USD, 2017 - 2030
- Figure 146:
- BUSINESS JETS DELIVERIES SHARE, VALUE, %, COLOMBIA, 2023 VS 2030
- Figure 147:
- GLOBAL BUSINESS JET MARKET, BY REST OF SOUTH AMERICA, UNITS, 2017 - 2030
- Figure 148:
- GLOBAL BUSINESS JET MARKET, BY REST OF SOUTH AMERICA, USD, 2017 - 2030
- Figure 149:
- BUSINESS JETS DELIVERIES SHARE, VALUE, %, REST OF SOUTH AMERICA, 2023 VS 2030
- Figure 150:
- MOST ACTIVE COMPANIES, NUMBER OF STRATEGIC MOVES, GLOBAL, 2018-2023
- Figure 151:
- MOST ADOPTED STRATEGIES, COUNT, GLOBAL, 2018 - 2023
- Figure 152:
- MAJOR PLAYERS REVENUE SHARE (%), GLOBAL
Business Jet Industry Segmentation
Large Jet, Light Jet, Mid-Size Jet are covered as segments by Body Type. Asia-Pacific, Europe, Middle East and Africa, North America, South America are covered as segments by Region.| Body Type | Large Jet | ||
| Light Jet | |||
| Mid-Size Jet | |||
| Region | Asia-Pacific | Australia | |
| China | |||
| India | |||
| Indonesia | |||
| Japan | |||
| Malaysia | |||
| Philippines | |||
| Singapore | |||
| South Korea | |||
| Thailand | |||
| Rest of Asia-Pacific | |||
| Europe | France | ||
| Germany | |||
| Italy | |||
| Netherlands | |||
| Russia | |||
| Spain | |||
| Turkey | |||
| UK | |||
| Rest of Europe | |||
| Middle East and Africa | Algeria | ||
| Egypt | |||
| Qatar | |||
| Saudi Arabia | |||
| South Africa | |||
| United Arab Emirates | |||
| Rest of Middle East and Africa | |||
| North America | Canada | ||
| Mexico | |||
| United States | |||
| Rest of North America | |||
| South America | Brazil | ||
| Chile | |||
| Colombia | |||
| Rest of South America | |||
Need A Different Region or Segment?
Customize Now
Market Definition
- Aircraft Type - General Aviation includes aircraft used for corporate aviation, business aviation and other aerial works.
- Sub-Aircraft Type - Business Jets which are private jets and are designed to carry small groups of people and are used for various roles are included in this study.
- Body Type - Light Jets, Mid-Size Jets, and Large Jets according to their ability to carry passengers and flying distance ranges have been included under this study.
| Keyword | Definition |
|---|---|
| IATA | IATA stands for the International Air Transport Association, a trade organization composed of airlines around the world that has an influence over the commercial aspects of flight. |
| ICAO | ICAO stands for International Civil Aviation Organization, a specialized agency of the United Nations that supports aviation and navigation around the globe. |
| Air Operator Certificate (AOC) | A certificate granted by a National Aviation Authority permitting the conduct of commercial flying activities. |
| Certificate Of Airworthiness (CoA) | A Certificate Of Airworthiness (CoA) is issued for an aircraft by the civil aviation authority in the state in which the aircraft is registered. |
| Gross Domestic Product (GDP) | Gross domestic product (GDP) is a monetary measure of the market value of all the final goods and services produced in a specific time period by countries. |
| RPK (Revenue Passenger Kilometres) | The RPK of an airline is the sum of the products obtained by multiplying the number of revenue passengers carried on each flight stage by the stage distance - it is the total number of kilometers traveled by all revenue passengers. |
| Load Factor | The load factor is a metric used in the airline industry that measures the percentage of available seating capacity that has been filled with passengers. |
| Original Equipment Manufacturer (OEM) | An original equipment manufacturer (OEM) traditionally is defined as a company whose goods are used as components in the products of another company, which then sells the finished item to users. |
| International Transportation Safety Association (ITSA) | International Transportation Safety Association (ITSA) is an international network of heads of independent safety investigation authorities (SIA). |
| Available Seats Kilometre (ASK) | This metric is calculated by multiplying Available Seats (AS) in one flight, defined above, multiplied by the distance flown. |
| Gross Weight | The fully-loaded weight of an aircraft, also known as “takeoff weight,” which includes the combined weight of passengers, cargo, and fuel. |
| Airworthiness | The ability of an aircraft, or other airborne equipment or system, to operate in flight and on the ground without significant hazard to aircrew, ground crew, passengers or to other third parties. |
| Airworthiness Standards | Detailed and comprehensive design and safety criteria applicable to the category of aeronautical product (aircraft, engine or propeller). |
| Fixed Base Operator (FBO) | A business or organization that operates at an airport. An FBO provides aircraft operating services like maintenance, fueling, flight training, charter services, hangaring, and parking. |
| High Net worth Individuals (HNWIs) | High Net worth Individuals (HNWIs) are individuals with over USD 1 million in liquid financial assets. |
| Ultra High Net worth Individuals (UHNWIs) | Ultra High Net worth Individuals (UHNWIs) are individuals with over USD 30 million in liquid financial assets. |
| Federal Aviation Administration (FAA) | The division of the Department of Transportation is concerned with aviation. It operates Air Traffic Control and regulates everything from aircraft manufacturing to pilot training to airport operations in the United States. |
| EASA (European Aviation Safety Agency) | The European Aviation Safety Agency is a European Union agency established in 2002 with the task of overseeing civil aviation safety and regulation. |
| Airborne Warning and Control System (AW&C) aircraft | Airborne Warning and Control System (AEW&C) aircraft is equipped with a powerful radar and on-board command and control center to direct the armed forces. |
| The North Atlantic Treaty Organization (NATO) | The North Atlantic Treaty Organization (NATO), also called the North Atlantic Alliance, is an intergovernmental military alliance between 30 member states – 28 European and two North American. |
| Joint Strike Fighter (JSF) | Joint Strike Fighter (JSF) is a development and acquisition program intended to replace a wide range of existing fighter, strike, and ground attack aircraft for the United States, the United Kingdom, Italy, Canada, Australia, the Netherlands, Denmark, Norway, and formerly Turkey. |
| Light Combat Aircraft (LCA) | A light combat aircraft (LCA) is a light, multirole jet/turboprop military aircraft, commonly derived from advanced trainer designs, designed for engaging in light combat. |
| Stockholm International Peace Research Institute (SIPRI) | Stockholm International Peace Research Institute (SIPRI) is an international institute that provides data, analysis, and recommendations for armed conflict, military expenditure, and arms trade as well as disarmament and arms control. |
| Maritime Patrol Aircraft (MPA) | A maritime patrol aircraft (MPA), also known as maritime reconnaissance aircraft is a fixed-wing aircraft designed to operate for long durations over water in maritime patrol roles, in particular, anti-submarine warfare (ASW), anti-ship warfare (AShW), and search and rescue (SAR). |
| Mach Number | The Mach number is defined as the ratio of true airspeed to the speed of sound at the altitude of a given aircraft. |
| Stealth Aircraft | Stealth is a Common term applied to low observable (LO) technology and doctrine, that makes an aircraft near invisible to radar, infrared or visual detection. |
Need More Details on Market Definition?
Ask a Question
Research Methodology
Mordor Intelligence follows a four-step methodology in all our reports.
- Step-1: Identify Key Variables: In order to build a robust forecasting methodology, the variables and factors identified in Step-1 are tested against available historical market numbers. Through an iterative process, the variables required for market forecast are set and the model is built on the basis of these variables.
- Step-2: Build a Market Model: Market-size estimations for the historical and forecast years have been provided in revenue and volume terms. For sales conversion to volume, the average selling price (ASP) is kept constant throughout the forecast period for each country, and inflation is not a part of the pricing.
- Step-3: Validate and Finalize: In this important step, all market numbers, variables and analyst calls are validated through an extensive network of primary research experts from the market studied. The respondents are selected across levels and functions to generate a holistic picture of the market studied.
- Step-4: Research Outputs: Syndicated Reports, Custom Consulting Assignments, Databases & Subscription Platforms

Get More Details On Research Methodology
Download PDF


