
Bus Seat Market Size and Share
Market Overview
| Study Period | 2020 - 2031 |
|---|---|
| Market Size (2026) | USD 15.74 Billion |
| Market Size (2031) | USD 20.49 Billion |
| Growth Rate (2026 - 2031) | 5.42 % |
| Fastest Growing Market | Middle East and Africa |
| Largest Market | Asia-Pacific |
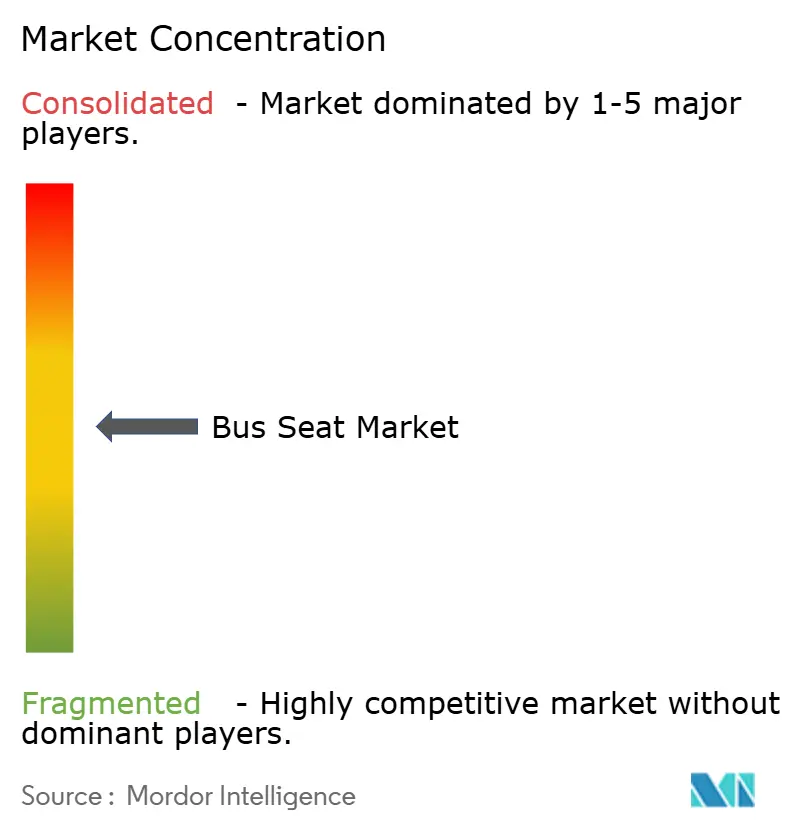
| Market Concentration | Medium |
Major Players *Disclaimer: Major Players sorted in no particular order Image © Mordor Intelligence. Reuse requires attribution under CC BY 4.0. | |
Bus Seat Market Analysis by Mordor Intelligence
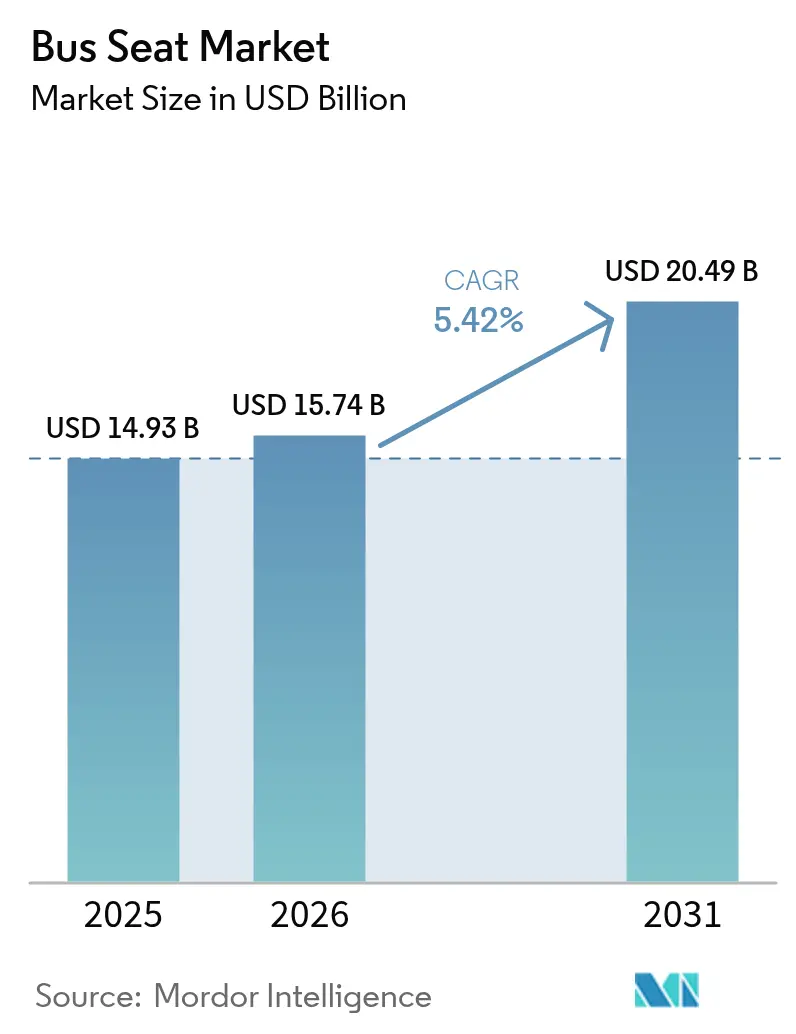
The Bus Seat Market size is expected to grow from USD 14.93 billion in 2025 to USD 15.74 billion in 2026 and is forecast to reach USD 20.49 billion by 2031 at 5.42% CAGR over 2026-2031. Electrification mandates, smart-city transit investments, and rising passenger-comfort expectations are reshaping specifications across transit, coach, and school applications, making lightweight frames and modular accessories central to product roadmaps. Operators are steadily rolling out electric bus fleets that demand lower-mass seating solutions to protect vehicle range. At the same time, megacity authorities allocate larger capital budgets to premium interiors that lure commuters away from ride-hailing.
Key Report Takeaways
- By seat type, standard seats held 53.12% of the bus seat market share in 2025, while recliner seats are set to grow at an 8.78% CAGR through 2031.
- By component, frame parts accounted for 48.05% of revenue in 2025; smart accessories and sensors represent the fastest growth at an 11.08% CAGR.
- By bus type, transit/city buses held the largest position with 50.63% of the bus seat market share in 2025, while electric transit buses are set to record the fastest 12.28% CAGR through 2031.
- By seating capacity, the 41-70 segment captured 56.88% of the bus seat market size in 2025 and is advancing at a 14.34% CAGR to 2031.
- By end-use, OEM fitment controlled 75.64% of installations in 2025; the aftermarket is expanding at a 10.45% CAGR through 2031.
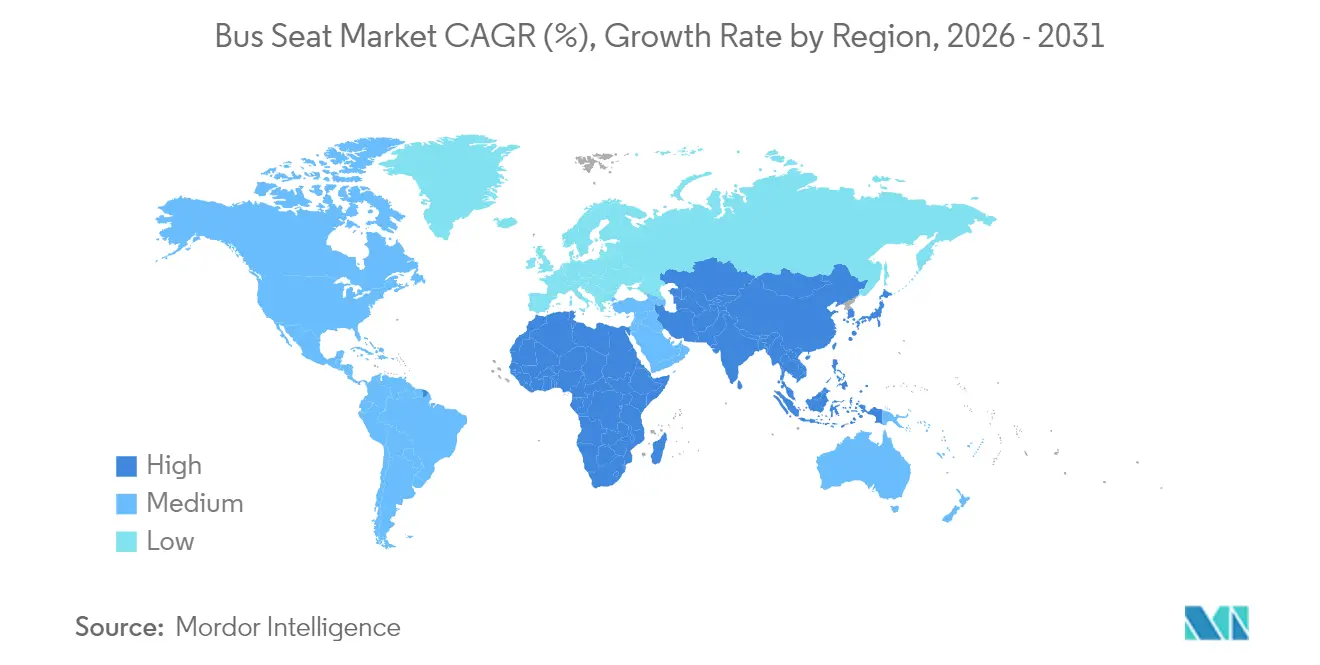
- By geography, Asia-Pacific led with 41.92% revenue share in 2025; Africa is projected to post the fastest 7.18% CAGR to 2031.
Note: Market size and forecast figures in this report are generated using Mordor Intelligence’s proprietary estimation framework, updated with the latest available data and insights as of 2026.
Market Trends and Insights
Drivers Impact Analysis of Bus Seat Market*
| Driver | (~) % Impact on CAGR Forecast | Geographic Relevance | Impact Timeline |
|---|---|---|---|
| Surge in e-bus and electric-school-bus | +1.2% | Global, with APAC and North America leading | Medium term (2-4 years) |
| Rising public-transport CAPEX | +0.9% | APAC core, spill-over to MEA and South America | Long term (≥ 4 years) |
| Stricter seat-safety and fire-retardancy | +0.7% | Europe and North America, expanding to emerging markets | Short term (≤ 2 years) |
| Comfort-driven OEM spec upgrades | +0.8% | Global, premium segments in developed markets | Medium term (2-4 years) |
| AI-enabled occupancy monetisation | +0.6% | North America and EU, pilot programs in APAC | Medium term (2-4 years) |
| 3-D-printed lightweight metal frames | +0.4% | Global, early adoption in Europe and North America | Long term (≥ 4 years) |
| Source: Mordor Intelligence | |||
Surge in E-Bus and Electric-School-Bus Procurements
Electric bus roll-outs are redefining weight budgets, prompting seat designs that trim every kilogram to protect battery range. Capacity segments vary: buses below 40 seats grow at a robust CAGR, while 41-70 seaters expand at 14.91% CAGR. Blue Bird reported that electric school buses now generate almost one tenth of revenue and command average transaction prices above USD 300,000, triple a diesel equivalent.
Rising Public-Transport CAPEX in Megacities
Urban congestion and air-quality targets push megacity planners toward higher CAPEX for bus fleets with premium interiors. Asia-Pacific remains the growth engine, with the regional bus seat market projected to post an 8.33% CAGR between 2025 and 2030, aided by China, India, and Southeast Asia. Authorities routinely specify USB charging, climate-control vents, and ergonomic cushions to retain riders. The 41-70 capacity range dominates because it balances throughput and maneuverability on congested streets. North American city-bus deliveries reached 4,349 units in 2023, a 7% year-over-year increase compared to 2022.
Stricter Seat-Safety and Fire-Retardancy Mandates
The United Nations Economic Commission for Europe reinforced seat strength and anchorage rules in Regulation No. 17 and introduced new child safety provisions, tightening OEM compliance schedules. Fire-retardancy legislation spurs R&D into bio-based foams, such as Woodbridge’s TrimVisible Bio, which embeds biogenic carbon while meeting flammability tests.[1]Woodbridge Group, “Woodbridge Launches TrimVisible Bio Seating Foam,” woodbridgegroup.com Suppliers with certified test facilities accelerate product refresh cycles, capturing share when regional makers struggle to fund recertification.
Comfort-Driven OEM Spec Upgrades
Operators turn to comfort features as a competitive lever against ride-sharing. Recliner seats already record an 8.95% CAGR, supported by innovations like Toyota Boshoku’s 77-degree full-recline model that blends massage, heating, and ventilation functions in September 2023.[2]Toyota Boshoku Corporation, “Fiscal 2024 Results Presentation,” toyota-boshoku.com Smart accessories grow even faster, embedding sensors that feed occupancy analytics and personalized HVAC controls. Modular designs let transit agencies retrofit older fleets without wholesale seat swaps, supporting the aftermarket surge.
Restraints Impact Analysis of Bus Seat Market*
| Restraint | (~) % Impact on CAGR Forecast | Geographic Relevance | Impact Timeline |
|---|---|---|---|
| Steel and polyurethane price volatility | -0.8% | Global, acute in emerging markets | Short term (≤ 2 years) |
| High tooling costs | -0.6% | Global, particularly impacting specialized segments | Medium term (2-4 years) |
| UNECE R80 crash-compliance delays | -0.4% | Emerging markets in APAC, Africa, and South America | Medium term (2-4 years) |
| Forthcoming micro-plastic emission rules | -0.3% | Europe and North America, expanding globally | Long term (≥ 4 years) |
| Source: Mordor Intelligence | |||
Steel and Polyurethane Price Volatility
Raw material price instability is compressing margins and forcing manufacturers to implement dynamic pricing strategies that strain long-term OEM contracts. Polyurethane price spikes ripple through the upholstery slice, pressing suppliers to hedge or substitute recycled and bio-based chemistries. Vertically integrated players insulate earnings by securing long-term contracts, while small firms face cash-flow stress that may hasten consolidation.
High Tooling Costs for Low-Volume Variants
Customized seats for child safety or paratransit niches incur heavy tooling charges that rarely amortize across tiny volumes. Manufacturers respond with modular understructures and 3D-printed brackets that cut tooling lead times, though unit economics remain challenging. Market entrants must license existing platforms or confine portfolios to high-volume transit models to maintain profitability.
*Our forecasts treat driver/restraint impacts as directional, not additive. The impact forecasts reflect baseline growth, mix effects, and variable interactions.
Bus Seat Market Segment Analysis
By Seat Type:
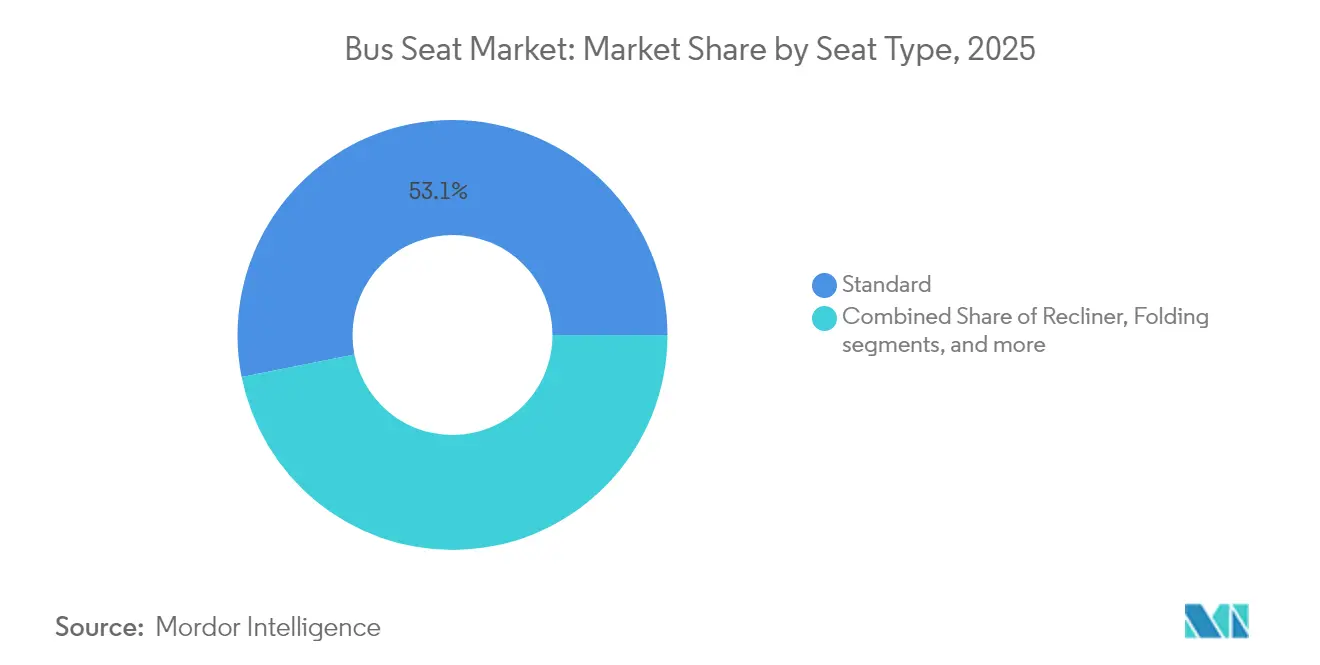
Recliners sustain premium momentumStandard seats controlled 53.12% of the bus seat market 2025, anchored by cost-sensitive urban operators. Recliners held a decent share and are slated for an exponentially growth with a CAGR of 8.78%, transforming intercity and higher-end transit services. Folding seats cater to flexible shuttle operations, whereas driver/operator designs include suspension and adjustment features that raise unit value. Integrated child seats remain niche but gain regulatory tailwinds from UNECE rules. The premium shift lifts average selling prices and magnifies the bus seat market size for recliner offerings, particularly in corridors where airlines and ride-hailing compete for passengers. Suppliers investing in full-recline mechanisms and massage systems enjoy pricing power and closer alignment with OEM differentiation strategies.
The bus seat industry must comply with rising crash-worthiness tests, so recliner frames now blend high-strength steel and aluminum to meet UNECE R80 while staying within mass limits. OEMs promote layouts that mix standard and premium rows, letting agencies upsell comfort tiers without redesigning floor plans.


By Component:
Smart accessories accelerate innovationFrame assemblies accounted for 48.05% of 2025 revenue because every seat begins with a rigid structure, while smart accessories and sensors represent the fastest growth at an 11.08% CAGR through 2031. Automatic passenger-counting systems achieve more than 98% accuracy, letting agencies adjust headways for higher fare yield. Such data-rich functionality lets suppliers bundle analytics subscriptions, creating recurring revenue beyond physical hardware and expanding the bus seat market.
3D-printed titanium or aluminum brackets trim up to 350 kg from a 50-seat bus, extending electric range without compromising UNECE crash standards. Frame suppliers collaborate with additive-manufacturing firms to merge lattice structures that deliver stiffness only where necessary, curbing raw-material tonnage and carbon footprints. Upholstery makers add antimicrobial coatings and recyclable textiles to comply with forthcoming European micro-plastic rules.
By Bus Type:
Electric transit lifts specification levelsTransit buses represented 50.63% of revenue in 2025; electrification is lifting both demand and technical sophistication within that segment. Coaches held more than two fifth of the share, emphasizing recliner cushions and extra-wide armrests that command premium fares. School buses stood to grow at 11.64% CAGR but outpaced the overall bus seat market is projected to grow at a robust CAGR, underpinned by federal incentives that fund electric fleet upgrades in more than 1,500 U.S. districts. Electric models fetch higher seating budgets because lighter frames translate directly into extended battery range.
Shuttle formats prioritize folding and quick-release layouts that convert passenger space for luggage or wheelchairs. Suppliers that standardize mounting rails across all bus types streamline OEM integration and shorten retrofit downtimes.
By Seating Capacity:
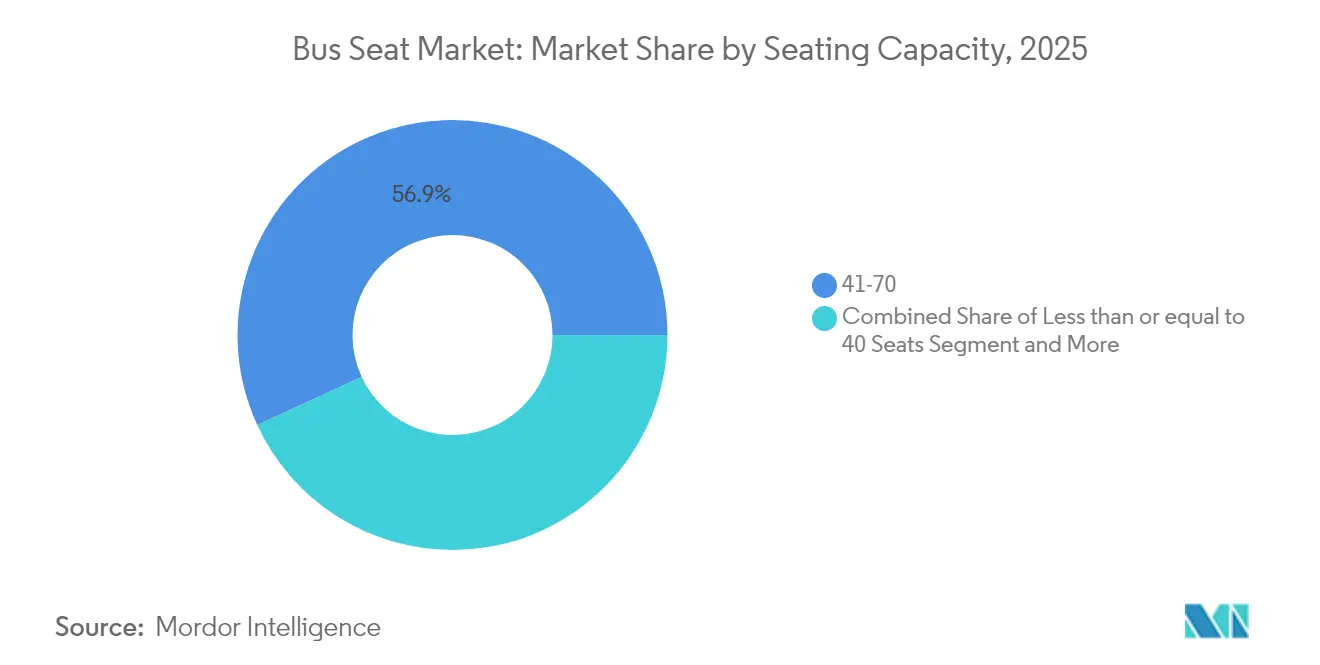
Medium-capacity buses dominate growthThe 41-70 seat bracket controlled 56.88% of 2025 revenue and is growing at 14.34% CAGR, confirming that midsize buses match urban density without the maneuvering penalties of articulated giants. This bracket also anchors the largest bus seat market size, creating scale advantages for suppliers focused on modular frames. Buses with 40 or fewer seats favor rural and shuttle duties. The over-70 tier mostly includes bus rapid transit corridors where seat robustness outweighs comfort extras.
Medium-capacity electric models appear in Australian and South Korean procurement pipelines, further lifting seat volumes in the 31-40 and 41-70 brackets. Suppliers that certify seat layouts across multiple chassis shorten OEM launch cycles, locking in longer supply contracts.
By End-Use:
Aftermarket growth outpaces OEM volumesOEM installations accounted for 75.64% of shipments in 2025 because factory fitment guarantees seat-to-floor compatibility and preserves full-vehicle warranty coverage. The aftermarket, in contrast, held more than two fifth of volumes but is expanding at a 10.45% CAGR through 2031 as operators postpone new-bus purchases and instead modernize existing fleets.
Refurbishment programs illustrate the trend. Volvo offers turnkey overhauls that renew interiors, exteriors, and seating while retaining safety certifications.The surge in retrofit activity is widening the bus seat market share for specialist installers and parts distributors, especially in regions where budget constraints delay fleet replacement cycles.
Geography Analysis
APAC Bus Seat Market
Asia-Pacific dominated the bus seat market with 41.92% share in 2025 and is set to log a decent CAGR, driven by India’s Smart Cities Mission, continued Chinese urbanization, and Southeast Asia’s rapid fleet electrification. Chinese e-bus sales have cooled since 2017, but the production base remains pivotal, giving seat suppliers scale and export leverage. Japan’s commuter surveys show more than 80% of residents use buses, mostly on short trips, prompting operators to focus on comfort upgrades instead of capacity additions. Diverse regulatory frameworks—from India’s AIS-052 to China’s GB standards—reward seat makers with multi-standard certification portfolios.
Europe and North America Bus Seat Market
Europe held more than two fifth of share in 2025, as fleet renewals converge with zero-emission mandates. Strict UNECE R80 and fire-retardancy rules impose test costs that hinder low-cost entrants, creating a premium climate for established suppliers. Government subsidies target low-carbon technology, encouraging agencies to specify lighter frames and recycled textiles. North America followed closely, lifted by the U.S. Infrastructure Investment and Jobs Act and Canada’s Zero-Emission Transit Fund. Electric school bus allocations provide steady seat volumes that emphasize child-restraint systems and weight-optimized frames.
Africa and South America Bus Seat Market
Africa grows at 7.18% CAGR as cities like Lagos and Nairobi invest in bus rapid transit corridors, although budgets still prioritize cost over premium features. Local assembly programs in South Africa and Egypt create demand for standardized, easily sourced seating. South America's Brazil has robust chassis industry offering regional sourcing advantages. Economic volatility keeps operators price-sensitive, so suppliers win tenders with durable standard seats that meet UNECE crash norms at competitive cost.

Regulatory Landscape
Bus seating specifications are shaped by a layered safety-and-materials framework that varies by vehicle category and region. In international markets aligned with UNECE-type approvals, UN Regulation No. 80 governs seat and seat-anchorage approvals for large passenger vehicles (M2/M3), while UN Regulation No. 118 sets burning-behavior requirements for interior materials used in certain M3 bus classes. UN Regulation No. 17 also applies for seats and head restraints in categories where R80 is not applicable. Suppliers typically respond by prioritizing certified anchorage designs, documented crash-performance test data, and material flammability evidence, which raises the value of in-house or partner testing ahead of OEM nominations.
In the United States, NHTSA administers FMVSS No. 207 (seating systems) and FMVSS No. 222 (school bus passenger seating and crash protection), and regulatory maintenance activity can shift verification work and documentation requirements. One notable update is the NHTSA final rule effective July 6, 2026 revising FMVSS No. 207 by removing obsolete requirements and exempting side-facing seats and certain bus passenger seats from specific force-testing provisions. This refocuses compliance attention on the still-applicable performance areas and school-bus-specific requirements under FMVSS No. 222. Elsewhere, China applies flame-resistance requirements for commercial bus interior materials under JT/T 1095-2022, while Australia references occupant-protection provisions in ADR 68/00 for buses, including seatbelt anchorage and seat-strength considerations for higher-reference-height seats.
Competitive Landscape
The bus seat market shows moderate fragmentation. Zhengzhou Yutong, Daimler, Xiamen King Long, Volkswagen, Marcopolo, and Toyota collectively command about 40% of global bus sales, which steers seat supplier strategies toward either scale consolidation or niche technology specialization. Toyota Boshoku produced 8.57 million vehicle seats in fiscal 2024, up 9.4% year over year, illustrating the output needed to serve worldwide OEMs.
Product differentiation pivots on lightweighting, sustainability, and connected features. FORVIA presented a commercial-vehicle seat family that cuts lifecycle CO₂ emissions up to 40% versus baseline products, aligning with OEM Scope 3 targets. Lear introduced ComfortMax technology that warms or cools 40% faster and halves component counts, lowering mass and assembly time. Seat makers also explore AI-enabled occupancy monetization platforms that turn hardware into data services, creating stickier revenue streams.
Midsize suppliers hedge commodity risk by integrating upstream foam molding or metal stamping, ensuring control over critical cost drivers. Others pivot to retrofit kits that upgrade aging fleets with USB ports, antimicrobial upholstery, and seatbelt status lights, capturing aftermarket growth without direct competition from OEM-linked giants. The impending European micro-plastic directive on seat foams adds urgency to bio-based research pipelines, potentially reshaping supplier hierarchies as new materials reach scale.
Bus Seat Industry Leaders
Toyota Boshoku Corporation
Grammer AG
Commercial Vehicle Group Inc.
Franz Kiel GmbH
Freedman Seating Company
- *Disclaimer: Major Players sorted in no particular order
Bus Seat Market Companies Covered in this Report
- Toyota Boshoku Corporation
- Grammer AG
- Commercial Vehicle Group Inc.
- Franz Kiel GmbH
- Freedman Seating Company
- Harita Seating Systems Ltd
- Magna International Inc.
- Lear Corporation
- NHK Spring Co.
- Pinnacle Industries Ltd
- RECARO Automotive
- Gentherm Inc.
- Adient PLC
- Faurecia SE (FORVIA)
- TACHI-S Co. Ltd
- Vogelsitze GmbH
- Isringhausen GmbH & Co. KG
- Bharat Seats Limited
- Minda Industries Ltd
- Prakash Seating Private Ltd

Market Opportunities and Future Outlook
Lightweighting and circular-material choices are creating room for seat makers that can pair safety compliance with mass reduction for electric buses, while also meeting interior fire-behavior requirements. The evidence in the report already points to active R&D and product direction in bio-based foams and low-toxicity chemistries, including Woodbridge's TrimVisible Bio seating foam positioned to meet flammability tests. It also highlights electronics-heavy upgrades, such as thermal-comfort features and sensor-enabled accessories that support occupancy analytics and modular retrofits. Because OEM fitment leads installations in 2025, suppliers that standardize mounting interfaces and package modular electronics and trim kits can support both factory programs and interior refresh cycles without requiring full seat changeovers.
Capacity additions and new vehicle programs also create near-term seat content opportunities across transit and shuttle formats. In June 2026, Solaris Bus & Coach inaugurated a new production hall in Sroda Wielkopolska, Poland, adding capacity of about 500 vehicles per year, which should expand the pipeline for compliant seating systems and validated trim materials in a key European manufacturing hub. At the same time, material suppliers continue to showcase recyclable and monomaterial seat concepts, such as Covestro's autonomous electric minibus concept featuring recyclable TPU monomaterial seats (February 2026). This supports an opportunity for seat OEMs and tier suppliers to redesign upholstery and foam stacks for recyclability while maintaining fire and durability performance, particularly for electrified fleets.
Recent Industry Developments in Bus Seat Market
- July 2026: Toyota Boshoku Corporation began construction of a new automotive seat manufacturing plant in Toyota City, Aichi Prefecture, with operations planned to start in January 2029. The investment adds to long-term seating capacity and industrial capability in Japan, with relevance to bus-seat suppliers through shared platforms, materials, and manufacturing know-how across commercial and passenger seating programs.
- April 2025: Lippert (LCI Industries) acquired Chicago-based Freedman Seating Company, expanding Lippert's portfolio in seating solutions spanning bus, rail, marine, and commercial vehicles. The deal consolidates North American seating capabilities under a larger engineered-components group, supporting broader customer access and potential scale benefits in sourcing, manufacturing, and product development.
- September 2024: Grammer AG unveiled the NEW REGIO passenger seat at InnoTrans, emphasizing sustainable materials and modular styling aimed at regional rail and bus fleets. The launch reflects continued product differentiation around modularity and sustainability, aligning with operator needs for configurable interiors and refurbishment-friendly seat architectures.


Bus Seat Market Report Scope and Research Methodology
Market Definition and Coverage
This market covers the revenue generated from seats used in buses, including the seat structure and passenger-facing materials, across OEM fitment and replacement demand, tracked in USD for the study period.
Scope exclusions: Excludes seats meant for rail cars, passenger cars, and aircraft, along with interior items not sold as part of a seat assembly (such as flooring, lighting, and HVAC).
Segments Covered in This Report
- By Seat Type
- Standard
- Recliner
- Folding
- Driver/Operator
- Integrated Child
- By Component
- Frame (Steel, Al, and Mg)
- Upholstery (Fabric, Vinyl, and Leather)
- Accessories (Armrest, Seat-belt, Trim, and Sensors)
- By Bus Type
- Transit / City
- Coach / Intercity
- School
- Shuttle & Others
- By Seating Capacity
- Less than or equal to 40 Seats
- 41 to 70 Seats
- More than 70 Seats
- By End-Use
- OEM Fitment
- Aftermarket / Retro-fit
- By Geography
- North America
- United States
- Canada
- Rest of North America
- South America
- Brazil
- Argentina
- Rest of South America
- Europe
- Germany
- United Kingdom
- France
- Italy
- Spain
- Rest of Europe
- Asia-Pacific
- China
- India
- Japan
- South Korea
- Rest of Asia-Pacific
- Middle East and Africa
- Saudi Arabia
- United Arab Emirates
- Turkey
- South Africa
- Rest of Middle East and Africa
- North America
Data Sources, Market Sizing, and Validation
Desk Research
Desk work started with public signals that explain bus production, fleet renewal, and usage intensity. We referenced sources such as national transport departments and statistical offices, International Organization of Motor Vehicle Manufacturers (OICA) releases, UN Comtrade customs data for seat and related component trade flows, and World Bank indicators tied to urban mobility and income levels.
For market structure and pricing logic, we also reviewed annual reports, investor presentations, and product catalogs of bus seat manufacturers and key bus OEMs, along with procurement notices and tender portals where seat requirements are described. Patent databases were checked to understand adoption of features like recline mechanisms, lightweight frames, and fire-retardant upholstery. These desk sources are illustrative only, and many other public documents were reviewed to collect, validate, and clarify inputs.
Primary Interviews and Surveys
Primary work focused on filling the gaps that public data does not fully answer, especially seat content per bus, replacement cycles, and how average selling prices move by bus type and comfort level. We spoke with seat makers, component suppliers, bus OEM contacts, fleet operators, and distributors across major regions. After consolidating those inputs, we used them to confirm assumptions and adjust the final model when desk signals looked inconsistent.
Distribution of primary research fieldwork respondents
| Company type | Respondent position | Region |
|---|---|---|
| Top tier: 34% | CXOs: 14% | APAC: 45% |
| Mid tier: 52% | Functional/Unit leaders: 38% | EMEA: 32% |
| Smaller Players: 14% | Managers: 48% | Americas: 23% |
Market-Sizing & Forecasting
Sizing was built using top-down and bottom-up logic. The top-down side reconstructs the demand pool from bus production and active fleet signals, then applies seat content per vehicle by bus type and seating capacity, followed by an OEM versus retrofit split that was refined through interviews.
To keep totals realistic, we corroborated results with selective bottom-up checks, such as sample supplier revenue splits, channel feedback on aftermarket volumes, and sampled ASP time estimates tied to unit volumes for standard and recliner seats. Where direct reporting was missing, gaps were handled by using nearby country ratios (fleet size, replacement frequency, and import intensity), then rechecking against expert inputs.
Forecasting relied on scenario analysis supported by a simple multivariate regression layer. The key drivers included bus output trends, urban public transport funding signals, fleet age and refurbishment rates, safety and fire-retardant compliance needs, and material cost pass-through patterns for upholstery and frames. Assumptions were kept consistent across regions through a single currency conversion timing and an explicit inflation and ASP progression step.
Data Validation & Update Cycle
Validation was done through multiple checks so the model did not depend on one data stream. Outputs were compared against independent indicators like bus production totals, seat import and export movements, and operator refurbishment activity, then any large variances were investigated and corrected before sign-off.
A second analyst review was performed to challenge key inputs, especially seat content per bus, OEM versus retrofit shares, and regional ASPs. The study is refreshed annually, and interim updates are triggered when there are material events, such as shifts in public transit procurement, major capacity additions, or sharp raw material price moves. Before delivery, we run a final refresh pass so clients receive the latest updated view.
Mordor Intelligence's Bus Seat Market Sizing Compared With Other Published Estimates
It is normal to see different market sizes published for bus seats, even when the topic name looks the same. Differences usually come from what each publisher counts as a bus seat, which year is treated as the current base, and how replacement demand is handled versus only new bus builds.
Key gaps also come from pricing logic and geography coverage. Some estimates lean heavily on broad vehicle seating totals, while others narrow it to public transit only, and currency timing can further shift USD values when local inflation is high.
Benchmark comparison
| Source | Market Size | Gaps in Research Methodology |
|---|---|---|
| Mordor Intelligence | USD 15.74 B (2026) | |
| Industry Publisher A | USD 14.94 B (2024) | Uses a different base year and often blends comfort and mechanism categories without clearly separating OEM fitment from retrofit volumes, which can shift unit-to-value conversions when ASPs vary by bus type. |
| Industry Publisher B | USD 12.95 B (2024) | Anchors the model on a narrower set of component and seat-type buckets and may apply a single average price curve across regions, which can understate markets where high-comfort and coach seating has a higher share. |
The spread mainly comes from base-year choice and how retrofit demand and seat content per bus are counted. Once those two levers are made explicit, the market math becomes easier to follow and replicate, which is the approach applied by Mordor Intelligence.


Key Questions Answered in the Report
What is the current size of the bus seat market?
The Bus Seat Market stands at USD 15.74 billion in 2026 and is projected to reach nearly USD 20.49 billion by 2031.
Which region dominates the bus seat market?
Asia-Pacific leads with 41.92 % revenue share in 2025, propelled by large-scale public-transport investments and electric bus manufacturing capacity.
Why are recliner seats growing so quickly?
Operators adopt recliner seats to differentiate services with premium comfort, driving an 8.78 % CAGR through 2031 as intercity and higher-end transit compete with ride-share and airlines.
How does electrification influence seat design?
Electric buses need lighter seats to protect battery range, pushing suppliers toward aluminum, magnesium, and carbon-fiber frames and weight-efficient accessories.
What drives aftermarket demand in the bus seat market?
Aging fleets and procurement delays push operators to refurbish existing buses, giving the retrofit segment a 10.45 % CAGR through 2031.
How are regulations affecting seat materials?
Stricter fire-retardancy and micro-plastic rules in Europe and North America spur innovation in bio-based foams and recyclable fabrics, favoring suppliers with advanced R&D.
Page last updated on:


 Your data is secure and never sold or shared.


