
Burn Ointment Market Size and Share
Market Overview
| Study Period | 2020 - 2031 |
|---|---|
| Market Size (2026) | USD 1.2 Billion |
| Market Size (2031) | USD 1.59 Billion |
| Growth Rate (2026 - 2031) | 5.86 % |
| Fastest Growing Market | Asia Pacific |
| Largest Market | North America |
| Market Concentration | Medium |
Major Players *Disclaimer: Major Players sorted in no particular order Image © Mordor Intelligence. Reuse requires attribution under CC BY 4.0. | |
Burn Ointment Market Analysis by Mordor Intelligence
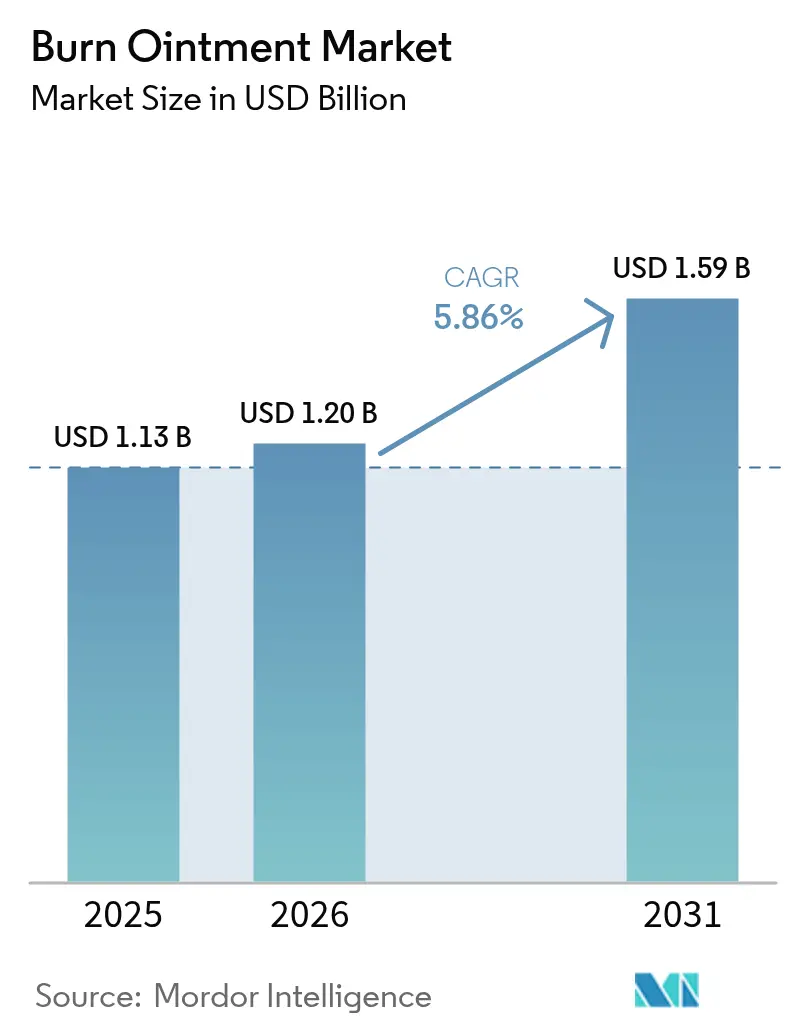
The burn ointment market size is expected to grow from USD 1.13 billion in 2025 to USD 1.2 billion in 2026 and is forecast to reach USD 1.59 billion by 2031 at 5.86% CAGR over 2026-2031. Commercial demand rises as lithium-ion battery explosions, vaping-related injuries, and industrial mishaps widen the pool of outpatient burn cases. Surgeons and combat medics alike now prefer silver-based antimicrobials that counter biofilm-forming organisms, and defense agencies fund rapid-response formulations for field deployment. FDA reclassification of topical antimicrobials into higher-risk classes nudges manufacturers toward stringent validation pathways that favor firms with robust clinical data. At the same time, digital pharmacies extend product reach, and telemedicine guides home users through evidence-based treatment regimens that cut overall care costs.
Key Report Takeaways
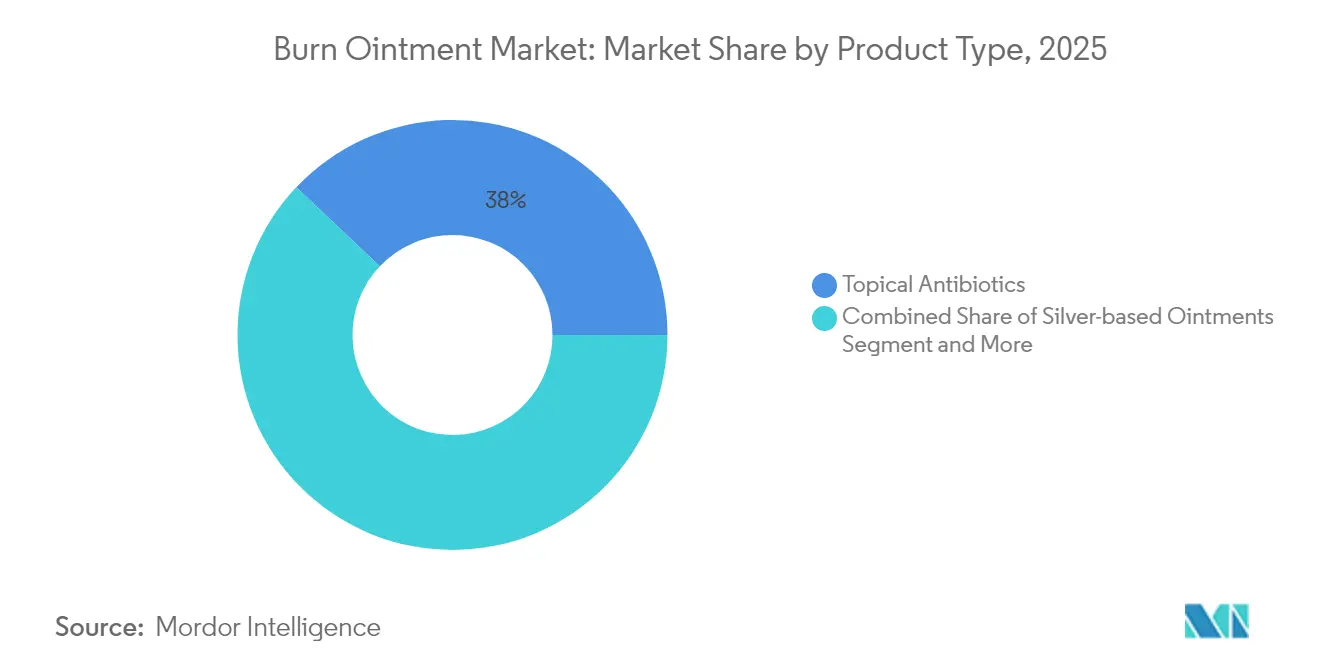
- By product type, topical antibiotics held 37.95% of burn ointment market share in 2025; silver-based variants are projected to register an 8.13% CAGR through 2031.
- By burn depth, first-degree injuries accounted for 46.05% of demand in 2025, while third-degree cases are expected to post a 7.41% CAGR to 2031.
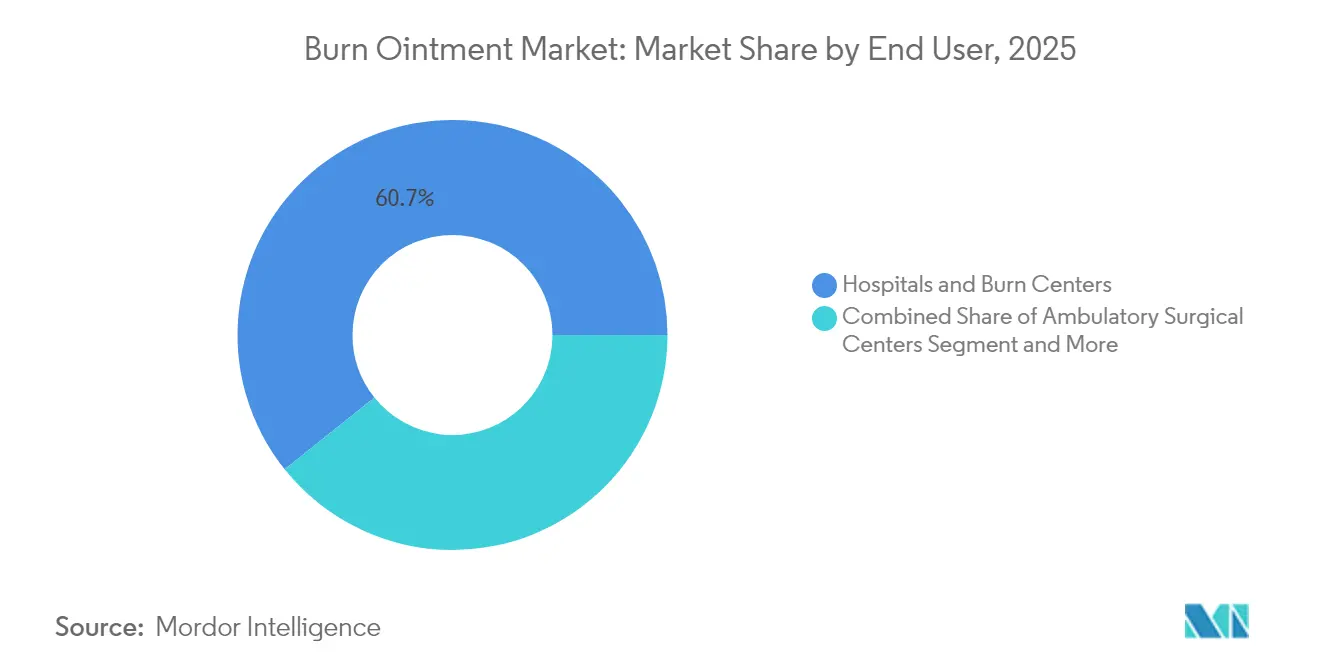
- By end user, hospitals and burn centers commanded 60.74% of the burn ointment market size in 2025, whereas home healthcare is expanding at a 7.06% CAGR.
- By distribution channel, hospital pharmacies led with 45.35% share of the burn ointment market size in 2025, yet online pharmacies are set to grow at 11.08% CAGR through 2031.
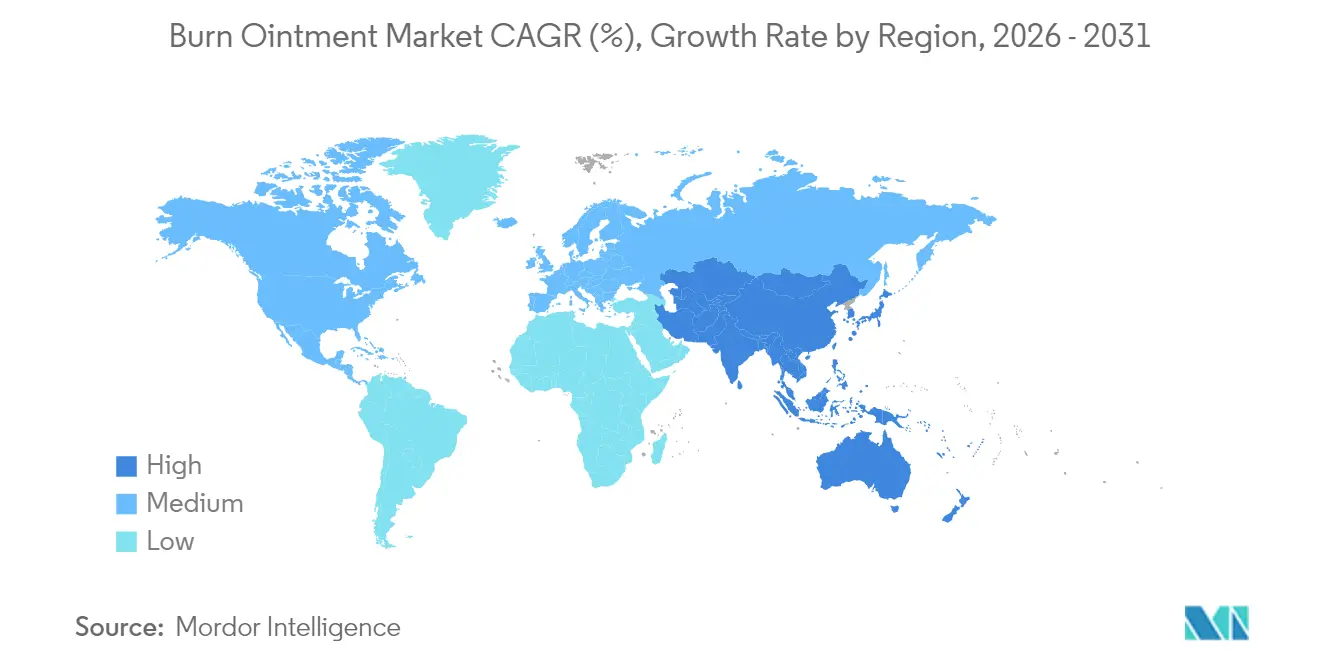
- By geography, North America contributed 37.55% of global revenue in 2025, while Asia-Pacific is advancing at an 8.68% CAGR on the back of health-system modernization.
Note: Market size and forecast figures in this report are generated using Mordor Intelligence’s proprietary estimation framework, updated with the latest available data and insights as of 2026.
Market Trends and Insights
Drivers Impact Analysis of Burn Ointment Market*
| Driver | (~) % Impact on CAGR Forecast | Geographic Relevance | Impact Timeline |
|---|---|---|---|
| Rising Incidence Of Burn Injuries In LMICs | +1.8% | Asia-Pacific, Africa, Latin America | Medium term (2-4 years) |
| Growing Patient Awareness & Access To Advanced Treatment | +1.2% | Global, with concentration in North America & Europe | Long term (≥ 4 years) |
| Rapid Adoption Of Silver-Based Antimicrobial Ointments | +1.5% | Global | Short term (≤ 2 years) |
| Military Field-Use Procurement For Combat Burns | +0.8% | North America, Europe, select APAC | Medium term (2-4 years) |
| Lithium-Battery & Vaping Explosions Increasing Outpatient Burns | +0.6% | North America, Europe, developed APAC | Short term (≤ 2 years) |
| Nanotechnology-Enabled Sustained-Release Formulations | +0.9% | North America, Europe, Japan | Long term (≥ 4 years) |
| Source: Mordor Intelligence | |||
Rising Incidence of Burn Injuries in LMICs
Fire-related mortality remains high in low- and middle-income countries where only a third of hospitals run dedicated burn wards[1]Judith Lindert, “State of Burns Management in Africa,” PubMed, pubmed.ncbi.nlm.nih.gov. Urbanization raises household fuel hazards, and factory expansion heightens industrial accidents that demand rapid topical intervention. India’s health-care outlay rose 12.59% in 2025, enabling state hospitals to stock multipurpose antimicrobial gels for rural outreach programs. Governments now bundle burn ointment procurement with trauma-care kits distributed to community clinics. This structural demand lifts baseline volumes for manufacturers that supply value-priced packs while licensing core technology from multinational partners. As emergency departments report shorter patient stays, low-cost formulations become a stop-gap between first aid and referral care, which fuels the burn ointment market.
Growing Patient Awareness & Access to Advanced Treatment
Telehealth portals teach patients to distinguish between superficial and partial-thickness burns and to begin self-application of medicated creams within hours of injury. Payers in the United States reimburse skin-substitute grafts only after 4 weeks of failed conservative therapy, a policy that indirectly stimulates early topical care using higher-end formulations. Social-media campaigns led by burn-survivor foundations spotlight faster healing times linked to silver and sustained-release nanogels, shaping consumer perception of product efficacy. Europe’s outpatient clinics now schedule digital follow-ups rather than inpatient stays, cutting overhead costs and cementing the role of the burn ointment industry in value-based care models.
Rapid Adoption of Silver-Based Antimicrobial Ointments
Laboratory tests show silver ions disrupt bacterial DNA replication and break down biofilm matrices responsible for 65% of chronic infections[2]M. Regulski et al., “Anti-Biofilm Efficacy of Wound Care Products,” DOI.ORG. The U.S. military adopted silver-impregnated dressings more than a decade ago, reporting fewer wound debridements and lower transport-related complications in combat settings. FDA clearance of silver-sol gel for first- and second-degree burns validates next-generation colloidal platforms and boosts physician confidence in premium ointments. Hospitals in Japan mandate silver dressings in pediatric burn protocols to reduce nosocomial infections, a policy that influences regional procurement standards. With antibiotic resistance rising, formulators blend nanosilver with natural anti-inflammatories such as curcumin to widen therapeutic appeal without compromising cost targets.
Military Field-Use Procurement for Combat Burns
The Military Burn Research Program earmarked USD 650 million in 2025 for decontamination gels and shelf-stable dressings that function in austere environments. The U.S. Department of Defense placed a USD 75 million order with Smith+Nephew for negative-pressure wound therapy systems that integrate silver-based gels, establishing a high-volume channel for advanced formulations. NATO drills now stock modular burn kits with self-activating chemopack dressings designed for rapid casualty evacuation, setting new performance benchmarks. Small domestic suppliers partner with global primes to secure cybersecurity-compliant supply chains, thereby accelerating technology transfer to civilian trauma centers. Military validation shortens the adoption curve in commercial markets as insurers regard combat-proven products as clinically superior, bolstering the burn ointment market.
Restraints Impact Analysis of Burn Ointment Market*
| Restraint | (~) % Impact on CAGR Forecast | Geographic Relevance | Impact Timeline |
|---|---|---|---|
| Antibiotic Resistance & Local Side-Effects | -1.4% | Global, particularly acute in hospital settings | Short term (≤ 2 years) |
| High Cost Of Advanced Silver/Biologic Therapies | -1.1% | LMICs, price-sensitive segments globally | Medium term (2-4 years) |
| Regulatory Re-Classification Of Topical Antimicrobials | -0.9% | North America, Europe, regulated markets | Short term (≤ 2 years) |
| Silver Supply-Chain Price Volatility | -0.5% | Global manufacturing, cost-sensitive applications | Medium term (2-4 years) |
| Source: Mordor Intelligence | |||
Antibiotic Resistance & Local Side-Effects
A global study across 65 hospitals found that 32.4% of burn patients received systemic antibiotics within a week of injury, fueling resistance in Pseudomonas and Acinetobacter strains. Clinicians are cautious about prolonged topical antibiotic use because of contact dermatitis risks that delay re-epithelialization. In Rwanda, a pediatric case of pan-drug-resistant Pseudomonas raised alarm over cross-border pathogen spread. Hospitals respond by rotating antiseptic classes and integrating cold-plasma therapy, reducing dependence on conventional ointments. These limitations dampen usage volumes and place a ceiling on the burn ointment market until alternative formulations overcome resistance hurdles.
High Cost of Advanced Silver/Biologic Therapies
Nanoparticle suspensions and biologic gels cost up to eight times more than generic antibiotic creams, straining procurement budgets in LMICs where burn incidence is highest. Medicare rules demand four weeks of failed standard care before reimbursing advanced grafts, delaying adoption of complementary premium ointments. Manufacturers face expensive Good Manufacturing Practice audits for biologic-infused products, a burden passed on to consumers. Cost constraints push public hospitals toward bulk purchasing of older antiseptic formulations, slowing penetration of next-generation gels. Subsidy programs remain limited, keeping the burn ointment market bifurcated between high-income and resource-constrained regions.
*Our forecasts treat driver/restraint impacts as directional, not additive. The impact forecasts reflect baseline growth, mix effects, and variable interactions.
Burn Ointment Market Segment Analysis
By Product Type:
Silver-Based Innovation Outpaces Traditional AntibioticsTopical antibiotics dominated revenue with a 37.95% burn ointment market share in 2025, underpinned by clinical familiarity and low unit cost. Silver creams, however, are set to chart an 8.13% CAGR to 2031 as hospitals shift protocols toward broad-spectrum coverage that counters biofilm formation. Iodine products retain relevance for deep or contaminated burns because of their oxidative kill mechanism but record slower growth on account of staining and cytotoxicity concerns. Carbon-dot carrier systems developed in 2025 extend active release over three days, which reduces nursing time and improves patient comfort.
Competitive differentiation hinges on patentable delivery matrices rather than the active ingredient itself. Firms embed silver ions within hydrocolloid layers that swell on contact with exudate, controlling moisture while releasing metal over 48–72 hours. Combo formulations that marry silver with lidocaine cater to emergency responders needing infection management and analgesia in one step. Regulatory upgrades mean Class III silver gels must now include data on microbial resistance trajectories, prompting richer post-market surveillance programs. As advanced products gain approvals, premium pricing contributes outsize dollar growth even if volume gains trail traditional creams. The interplay of efficacy, compliance, and cost will shape the long-term competitive fabric of the burn ointment market.


By Depth of Burn:
Third-Degree Treatment Complexity Drives Premium DemandSuperficial first-degree burns remained common, capturing 46.05% of 2025 sales value because of their high frequency in domestic settings. Yet third-degree burns are projected to register a 7.41% CAGR as complex trauma from industrial blasts, chemical spills, and military actions requires high-value topical care. These full-thickness injuries demand moisture control, antimicrobial coverage, and regenerative support, making them suitable candidates for bioactive gels laced with growth factor mimetics.
Treatment pathways now emphasize debridement within three days followed by sustained-release ointment application to curtail infection and speed graft readiness. Formulators researching exosome-like vesicles seek to trigger collagen deposition without fibroblast overstimulation that leads to hypertrophic scarring. Hospitals deploy advanced imaging to map wound depth and guide dosage amounts, improving cost efficiency for premium products. The burn ointment market size for third-degree applications thus outpaces unit shipments because of double-digit price points. As defense agencies refine battlefield protocols, third-degree burn solutions built for military use may trickle into civilian trauma centers, broadening the revenue base.
By End User:
Home Healthcare Acceleration Reflects Treatment DecentralizationHospitals and specialized burn centers contributed 60.74% of the burn ointment market size in 2025 owing to their role in managing moderate and severe cases. Home healthcare, advancing at a 7.06% CAGR, benefits from rising patient confidence in telemedicine guidance and from insurers rewarding lower-cost care settings.
Ambulatory surgery centers (ASCs) bridge traditional inpatient care and home recovery, offering same-day excision and topical dressing before discharge. Manufacturers tailor packaging with color-coded dosing cues and QR codes linking to instructional videos, enhancing adherence in non-clinical environments. As value-based reimbursement penalizes readmissions, hospitals supply patients with multi-day kits to minimize infection flare-ups. The burn ointment market thus extends beyond institutional procurement into direct-to-consumer channels, broadening revenue streams.
By Distribution Channel:
Digital Transformation Accelerates Online Pharmacy GrowthHospital pharmacies commanded 45.35% of 2025 sales, reflecting bulk purchases aligned with formulary protocols. Online pharmacies, forecast to grow 11.08% annually, capitalize on doorstep delivery, discrete packaging, and algorithm-driven product recommendations. Retail chains integrate click-and-collect lockers that merge digital convenience with instant pickup, sustaining relevance amid e-commerce expansion.
E-prescribing platforms automatically route burn ointment prescriptions to preferred networks that offer real-time stock verification. Pricing transparency online exerts downward pressure on brick-and-mortar mark-ups, prompting chain pharmacies to launch subscription models for chronic wound patients. Regulatory bodies are drafting cross-border e-pharmacy rules to clamp down on counterfeit topical agents, thereby bolstering trust in licensed platforms. As digital adoption matures, manufacturers invest in search-optimized content to capture direct traffic and to position premium lines as first-choice solutions in the burn ointment market.
Geography Analysis
North America Burn Ointment Market
North America, with its 37.55% share, remains the largest regional contributor, leveraging advanced trauma systems, broad insurance coverage, and sustained military R&D funding that validates premium burn ointment protocols. United States procurement channels continue to funnel cutting-edge silver-based products into civilian hospitals after demonstrating efficacy on the battlefield. Canada’s single-payer model negotiates national tenders that favor cost-effective generics yet still allocates budget for pediatric burn units deploying bioactive gels. Mexico’s private hospitals import U.S. formulations as medical tourism grows, thereby widening the regional distribution footprint.
APAC and Europe Burn Ointment Market
Asia-Pacific is the fastest-growing cluster, registering an 8.68% CAGR through 2031 as healthcare modernization programs unlock capital budgets for burn centers. India’s state insurance schemes introduced in 2024 reimburse topical silver for high-risk patients, boosting baseline demand. China’s provincial governments co-fund wound-care innovation hubs that incubate local nanogel start-ups, which tap domestic e-commerce platforms for rapid scale. Southeast Asian economies, grappling with industrial corridor fires and domestic cooking accidents, import mid-tier antimicrobial creams that balance cost and performance. Japan introduces performance-based reimbursement that rewards faster epithelialization, pushing hospitals toward sustained-release platforms. France adds silver-based gels to mandatory emergency-room stocks following guidance from its national public health agency. Eastern European markets lean on EU structural funds to renovate trauma facilities, creating incremental demand for staple antibiotic creams.
MEA and South America Burn Ointment Market
The Middle East and Africa remain underpenetrated yet promising. Gulf nations procure advanced biologic gels for expatriate-dense construction zones where burns from gas explosions are prevalent. North African countries collaborate with non-governmental organizations to distribute basic antimicrobial ointments at public clinics, improving first-aid response times. Sub-Saharan markets adopt mobile-health apps that direct patients to community burn units stocked with single-use sachets, enhancing treatment reach despite infrastructure constraints. South America sees moderate uptake, with Brazil investing in regional skin banks that will underpin longer-term demand for infection-control ointments. Collectively, these geographic nuances ensure that the burn ointment market continues its steady global climb.

Regulatory Landscape
Burn ointments and adjacent burn-wound products sit across multiple regulatory routes depending on the claims and technology. In the United States, the US Food and Drug Administration (FDA) covers OTC drug monograph compliance for standard burn-relief actives, as well as device and biologics pathways for advanced wound products used in burn care. Common topical burn-relief and analgesic products can fall under an OTC monograph framework with defined ingredient and labeling requirements. Higher-risk antimicrobial or advanced wound indications can also require more stringent submissions, including 510(k) for Class II devices with Special Controls, and premarket approval routes for Class III categories when applicable.
In the burn treatment workflow, negative pressure wound therapy (NPWT) systems used alongside topical antimicrobials are regulated as medical devices under FDA classification frameworks. For example, NPWT under 21 CFR 878.4780 is classified as Class II with Special Controls, which affects evidence expectations and supplier quality-system readiness. These route differences shape portfolio strategy for global manufacturers that sell both topical products and integrated wound-care systems. As companies bring new wound dressings and NPWT platforms to market through FDA clearances, validation, labeling, and post-market compliance requirements increasingly influence speed-to-market, support hospital formularies, and align with burn-center protocols. This environment favors suppliers able to run multi-pathway regulatory programs, pair topical offerings with regulated device platforms, and support traceability and anti-counterfeit controls in regulated e-pharmacy channels.
Competitive Landscape
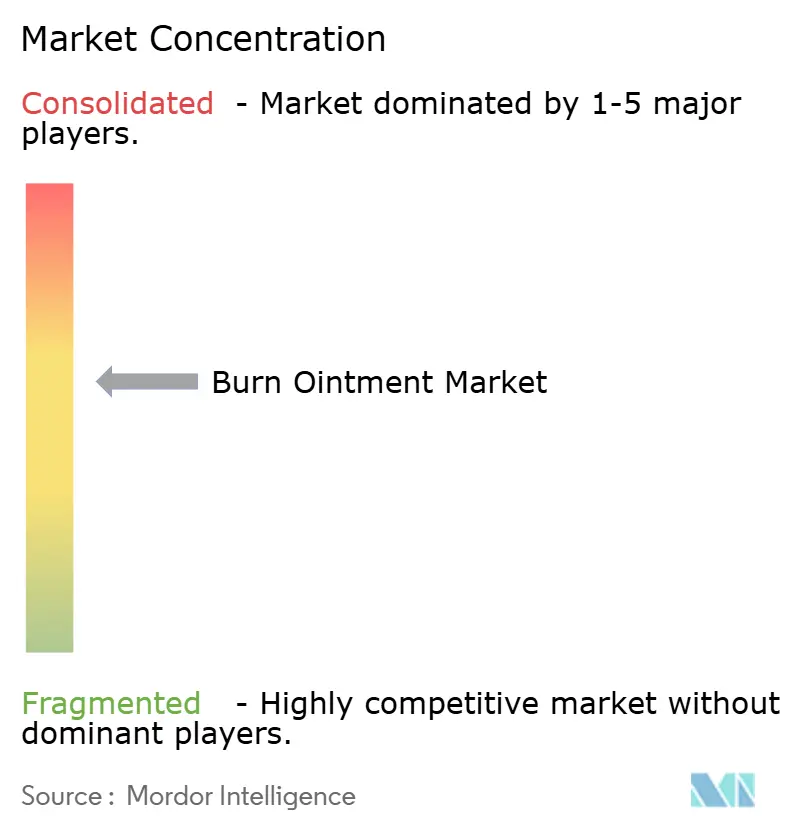
The burn ointment market is moderately concentrated, with the top five companies collectively holding significant share in 2024. Large incumbents such as Smith+Nephew, Convatec, and Mölnlycke leverage global distribution channels and clinical trial infrastructure to maintain competitive advantage. Regulatory re-classification places compliance burdens on small firms, prompting consolidation or license partnerships with established players. Technology differentiation centers on nanocarrier design, moisture-responsive matrices, and dual-action formulations that fuse antimicrobial and regenerative properties.
Strategic moves underscore this focus. Smith+Nephew’s USD 75 million defense contract supplies negative-pressure systems paired with silver gels, securing volume and validating product performance in extreme conditions. Convatec dedicates a quarter of its 2025 R&D budget to sustained-release platforms that reduce dressing changes, aiming to cut nursing labor hours in high-cost markets. Avita Medical launched Cohealyx in 2025, combining exosome technology with topical delivery to accelerate re-epithelialization, positioning itself in the emerging bio-regenerative niche.
Pipeline acquisitions further shape the landscape. Multinationals scout start-ups with AI-driven wound-diagnostic tools to bundle hardware and consumables. Cross-licensing deals in Japan and South Korea bring localized manufacturing that meets rising regional demand while hedging against currency swings. As silver spot prices fluctuate, leading firms negotiate bulk supply agreements and invest in recycling programs that reclaim metal from production waste, protecting margins. Overall, competition turns on the ability to marry regulatory prowess with tangible clinical outcomes, ensuring continued evolution of the burn ointment market.
Burn Ointment Industry Leaders
Solventum Corporation
Smith & Nephew PLC
Johnson & Johnson
ConvaTec Group PLC
Cardinal Health Inc.
- *Disclaimer: Major Players sorted in no particular order
Burn Ointment Market Companies Covered in this Report
- Solventum Corporation
- Smiths Group
- Johnson & Johnson
- Convatec
- Cardinal Health
- GlaxoSmithKline
- Pfizer
- Cipla
- Sun Pharmaceuticals Industries
- Perrigo Company
- Mankind Pharma
- DeRoyal Industries
- Molnlycke Health Care
- Leo Pharma
- Medline Industries
- B. Braun
- Acelity (KCI)
- Integra LifeSciences
- Morepen
- Trio Lifescience Pvt. Ltd.

Market Opportunities and Future Outlook
White space remains at the intersection of outpatient burn care, advanced wound management, and digital distribution. Growth in home care, reinforced by telemedicine-supported self-care, creates room for burn ointment makers to differentiate with simpler dosing, improved tolerability (including concerns around dermatitis and topical antibiotic overuse), and evidence packages that help products stay on protocol in hospitals and burn centers. The market also has a practical commercialization avenue through bundled care pathways, as hospitals often combine topical antimicrobials with advanced dressings and NPWT where indicated. That mix supports co-marketing, kit-based procurement, and protocol-driven utilization.
Recent industry activity shows how adjacent platform launches can change burn-care pathways and pull through topical use. In May 2026, Smith+Nephew secured FDA 510(k) clearance (K260646) for the RENASYS EDGE NPWT system, and in March 2026 it launched ALLEVYN COMPLETE CARE foam dressings. Together, these moves reinforce integrated wound-care portfolios used in burn management alongside topical agents. For burn ointment suppliers, they point to opportunities in compatibility testing (ointment-dressing interactions), education for combined regimens across hospital and home settings, and channel expansion through online pharmacies and e-prescribing workflows, where regulatory-compliant labeling and clear instructions reduce misuse and improve adherence.
Recent Industry Developments in Burn Ointment Market
- May 2026: Smith+Nephew drives progress in chronic wound care with ALLEVYN COMPLETE CARE Dressing and RENASYS EDGE tNPWT set to launch at EWMA 2026. The update highlights advances in advanced wound care that can influence burn ointment treatment protocols, shaping post-burn care pathways. It expands the integrated wound-care portfolio, potentially boosting adoption of adjunct burn care products.
- March 2026: Smith+ Nephew launches ALLEVYN COMPLETE CARE Foam Dressing. The new foam dressing broadens product options for burn and wound management. It strengthens leadership in advanced wound dressings, influencing burn ointment usage patterns.
- January 2026: Solventum introduces V.A.C. Peel and Place Dressing in the United Kingdom. NPWT-dressing integration may affect post-burn wound care pathways. It signals convergence of wound therapy platforms with burn care workflows, potential demand spillover into burn ointment products.


Burn Ointment Market Report Scope and Research Methodology
Market Definition and Coverage
For this study, we define the burn ointment market as the revenue generated from topical ointment products used to manage burn injuries by soothing skin, supporting healing, and reducing infection risk across retail and clinical purchase channels.
Scope exclusions: This sizing excludes non-ointment burn dressings, devices, and hospital procedures, and it also excludes general skin-care creams that are not positioned or used for burn treatment.
Segments Covered in This Report
- By Product Type
- Topical Antibiotics
- Silver-based Ointments
- Iodine-based Ointments
- Combination / Others
- By Depth of Burn
- First-degree (Minor) Burns
- Second-degree (Partial Thickness) Burns
- Third-degree (Full Thickness) Burns
- By End User
- Hospitals & Burn Centers
- Ambulatory Surgical Centers
- Home Healthcare Settings
- By Distribution Channel
- Hospital Pharmacies
- Retail Pharmacies & Drug Stores
- Online Pharmacies
- Geography
- North America
- United States
- Canada
- Mexico
- Europe
- Germany
- United Kingdom
- France
- Italy
- Spain
- Rest of Europe
- Asia-Pacific
- China
- Japan
- India
- South Korea
- Australia
- Rest of Asia-Pacific
- Middle East and Africa
- GCC
- South Africa
- Rest of Middle East and Africa
- South America
- Brazil
- Argentina
- Rest of South America
- North America
Data Sources, Market Sizing, and Validation
Desk Research
Desk work started with public health and injury signals, which helped set realistic demand boundaries before we modeled volumes. We reviewed sources such as the World Health Organization for burn burden context and the US Centers for Disease Control and Prevention for injury and care setting indicators, plus similar national health agencies where burn incidence reporting is available.
To ground the commercial side, we also used sources such as US FDA drug and product information pages for topical product context and, where applicable, US Customs and trade statistics for cross-checking movement of relevant topical preparations. Peer-reviewed clinical literature on burn care practices was used to understand product use rates. Company annual reports, investor materials, and reputable press coverage were used to understand product focus and geographic exposure, and we used a paid subscription for company financials and another for patent lookups selectively to fill gaps for smaller entities and formulation activity. The sources listed here are not exhaustive, and we checked many other public references to validate data points and clarify assumptions.
Primary Interviews and Surveys
Primary checks were run through interviews and short surveys with a mix of manufacturers, distributors, clinicians, and pharmacy channel participants to test demand assumptions and pricing logic in real purchase settings. These discussions also helped confirm which burn severities typically drive ointment usage, how often reapplication happens, and how channel mix varies across key regions that shape overall consumption.
Distribution of primary research fieldwork respondents
| Company type | Respondent position | Region |
|---|---|---|
| Top tier: 30% | CXOs: 12% | APAC: 41% |
| Mid tier: 55% | Functional/Unit leaders: 35% | EMEA: 33% |
| Smaller Players: 15% | Managers: 53% | Americas: 26% |
Market-Sizing & Forecasting
We sized the market using a top-down demand pool build that starts from burn incidence signals and then narrows them into the portion that is likely to be treated with an ointment in each care setting. Once the treated pool was defined, revenue was built by applying a practical usage profile (average packs per episode, reapplication frequency, and typical therapy duration) and then converting volumes into value using average selling price ranges that we stress-tested in primary discussions.
To keep outputs realistic, we corroborated the model with selective bottom-up approximations such as supplier revenue disclosures where available, distributor and pharmacy channel checks on brand mix, and sampled ASP times volume calculations for common pack sizes. Inputs tracked closely included burn case mix by severity (mild versus deeper burns), share treated in outpatient versus inpatient settings, retail versus hospital channel split, pack-size and application guidance that influences consumption, and price movements driven by inflation and ingredient availability. Forecasts were developed using scenario analysis, where the core case is guided by expected burn incidence trends, access to care, and pricing progression patterns confirmed by expert feedback. The upside and downside cases test faster or slower shifts in channel mix and ASP changes. Where bottom-up signals were incomplete, we handled gaps by applying conservative coverage ratios and then adjusting them only when multiple independent interview checks aligned.
Data Validation & Update Cycle
Model outputs were checked against independent signals so that results stayed tied to a believable treated-demand pool. We compared implied per-capita consumption and regional spend patterns with burn burden directionally, and we also reviewed whether the channel split and pricing bands matched what interviewees see in day-to-day purchasing.
Variance checks were completed at each step, including year-on-year growth sanity checks, currency conversion timing checks, and outlier review for regions showing unusual jumps. Before sign-off, the work goes through multi-step internal review, and re-contacts are triggered when a key assumption shifts or when a new data point conflicts with the existing model. Reports are refreshed annually, with interim updates when material events occur, and a final pass is done close to delivery so clients receive the most recent view.
Mordor Intelligence's Burn Ointment Market Market Size Compared With Other Published Estimates
Published market sizes for burn ointment can vary even when the same end use is being discussed, because each publisher sets a different boundary for what counts as an ointment and how the treated burn pool is constructed. Differences also come from how pricing is averaged across channels and how quickly assumptions are refreshed when clinical use patterns or retail pricing shifts.
Key gaps usually show up in scope and in the way volume is converted to value, especially when adjacent burn care items get included or when ASP is applied as a single global average. By tracking treated-episode volumes, price bands by channel, and annual refresh triggers, Mordor Intelligence keeps the estimate centered on ointment-only revenue rather than mixing in broader burn care categories or one-time price snapshots.
Benchmark comparison
| Source | Market Size | Gaps in Research Methodology |
|---|---|---|
| Mordor Intelligence | USD 1.20 B (2026) | |
| Market Tracker A | USD 1.06 B (2024) | Uses an earlier base year and often applies a single blended ASP across channels, which can understate value where hospital and pharmacy pricing differ meaningfully. |
| Industry Bulletin B | USD 1.19 B (2024) | Reported value is tied to a shorter forecast window and can reflect broader topical burn treatment revenue depending on product inclusion rules, which shifts the total versus ointment-only counting. |
The spread in the table is mainly explained by base-year choice and the inclusion boundary around what is counted as burn ointment revenue. When the treated burn pool, pack usage, and channel-specific pricing are made explicit, the estimate becomes easier to replicate and simpler to update as conditions change.


Key Questions Answered in the Report
What is the current burn ointment market size and expected growth rate?
The burn ointment market size is USD 1.2 billion in 2026 and is projected to grow at a 5.86% CAGR to reach USD 1.59 billion by 2031.
Why are silver-based formulations gaining traction?
Silver ions disrupt biofilms and show effectiveness against antibiotic-resistant bacteria, prompting hospitals and military units to adopt these products rapidly.
Which region is expanding the fastest in the burn ointment market?
Asia-Pacific is forecast to advance at an 8.68% CAGR through 2031, driven by healthcare infrastructure investments in countries such as India and China.
How does FDA reclassification affect manufacturers?
Many antimicrobial creams now require higher-risk regulatory submissions, raising development costs and favoring firms with established compliance teams.
What distribution channels are growing quickest?
Online pharmacies are expected to post an 11.08% CAGR through 2031 as consumers favor digital convenience and home delivery options.
Page last updated on:


 Your data is secure and never sold or shared.


