
Bulletproof Glass Market Size and Share
Market Overview
| Study Period | 2021 - 2031 |
|---|---|
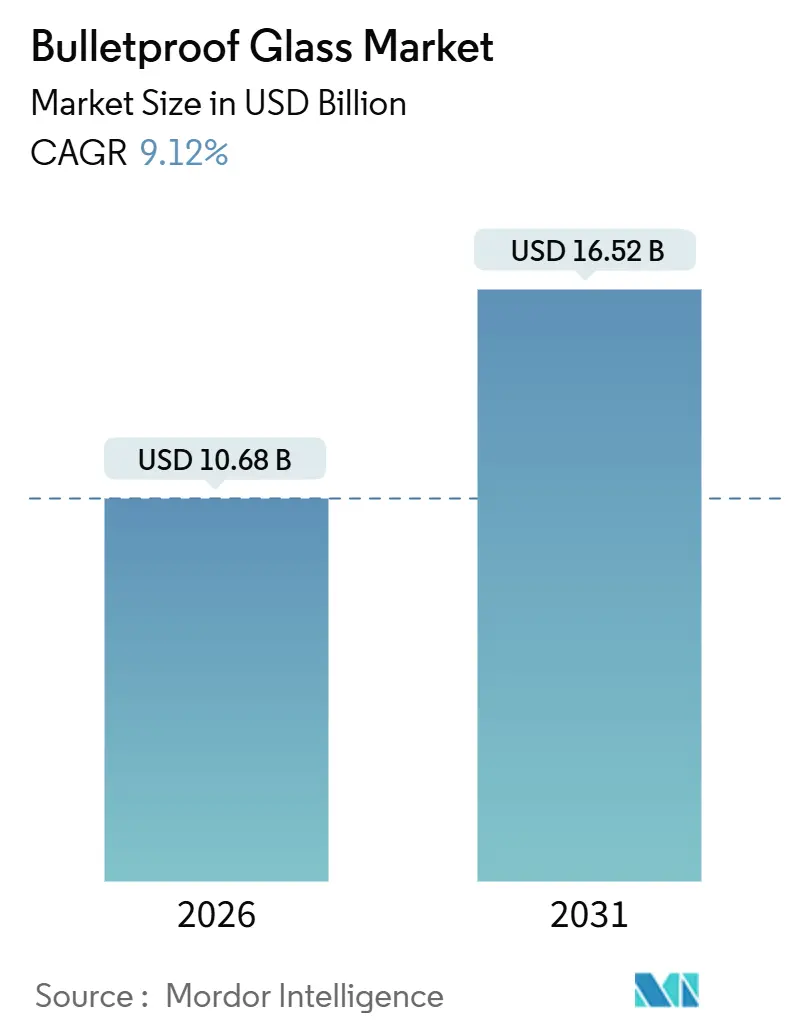
| Market Size (2026) | USD 10.68 Billion |
| Market Size (2031) | USD 16.52 Billion |
| Growth Rate (2026 - 2031) | 9.12 % |
| Fastest Growing Market | Asia Pacific |
| Largest Market | North America |
| Market Concentration | Medium |
Major Players *Disclaimer: Major Players sorted in no particular order Image © Mordor Intelligence. Reuse requires attribution under CC BY 4.0. | |
Bulletproof Glass Market Analysis by Mordor Intelligence
The Bulletproof Glass Market size is estimated at USD 10.68 billion in 2026, and is expected to reach USD 16.52 billion by 2031, at a CAGR of 9.12% during the forecast period (2026-2031). Rising defense modernization, climate-resilient construction mandates, and the electrification of armored vehicles are reinforcing demand, while polymer-ceramic hybrids promise meaningful weight savings. Solid acrylic dominated 2025 volumes because of its optical clarity and cost advantage, yet customer preference is shifting toward polycarbonate and glass-clad polycarbonate that deliver multi-hit protection with lighter laminates. Automakers are embedding ballistic glazing at the factory level to capture margin, and public-sector buyers are aligning safety and sustainability targets by specifying recycled-content laminates. The bulletproof glass market is therefore transitioning from reactive procurement toward proactive infrastructure hardening and mobility integration.
Key Report Takeaways
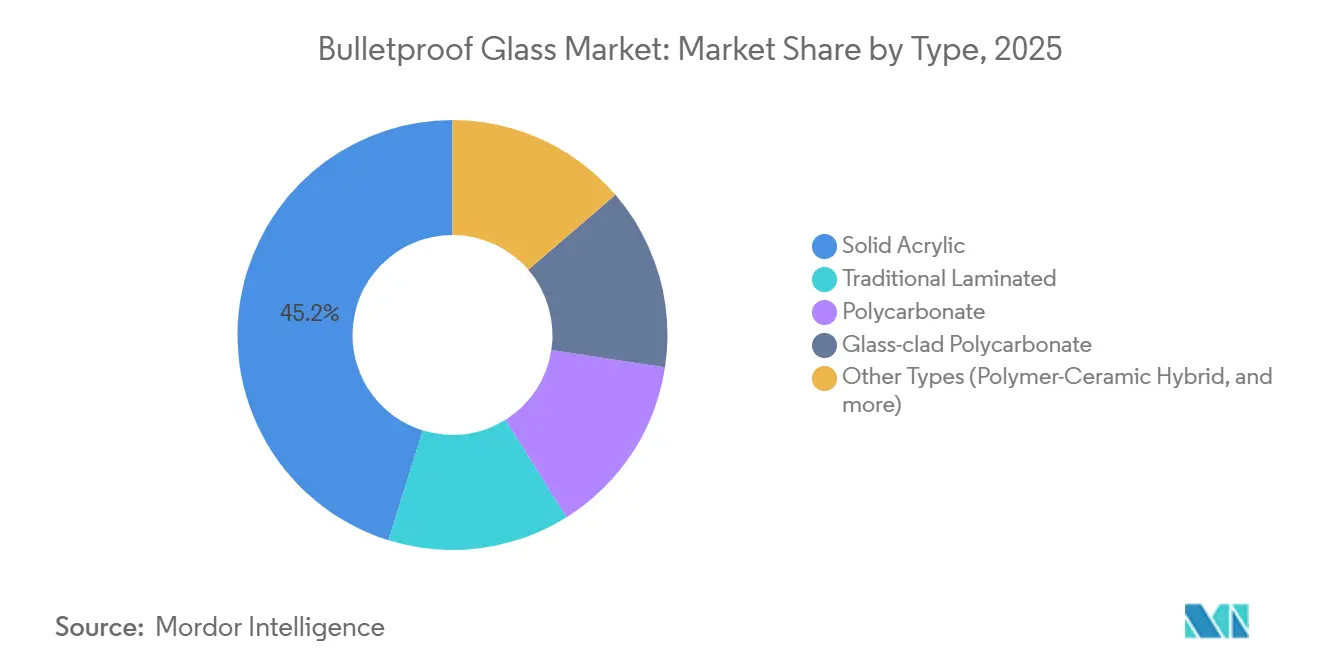
- By type, Solid Acrylic led with 45.19% of the bulletproof glass market share in 2025, while Polycarbonate is forecast to expand at a 10.21% CAGR to 2031.
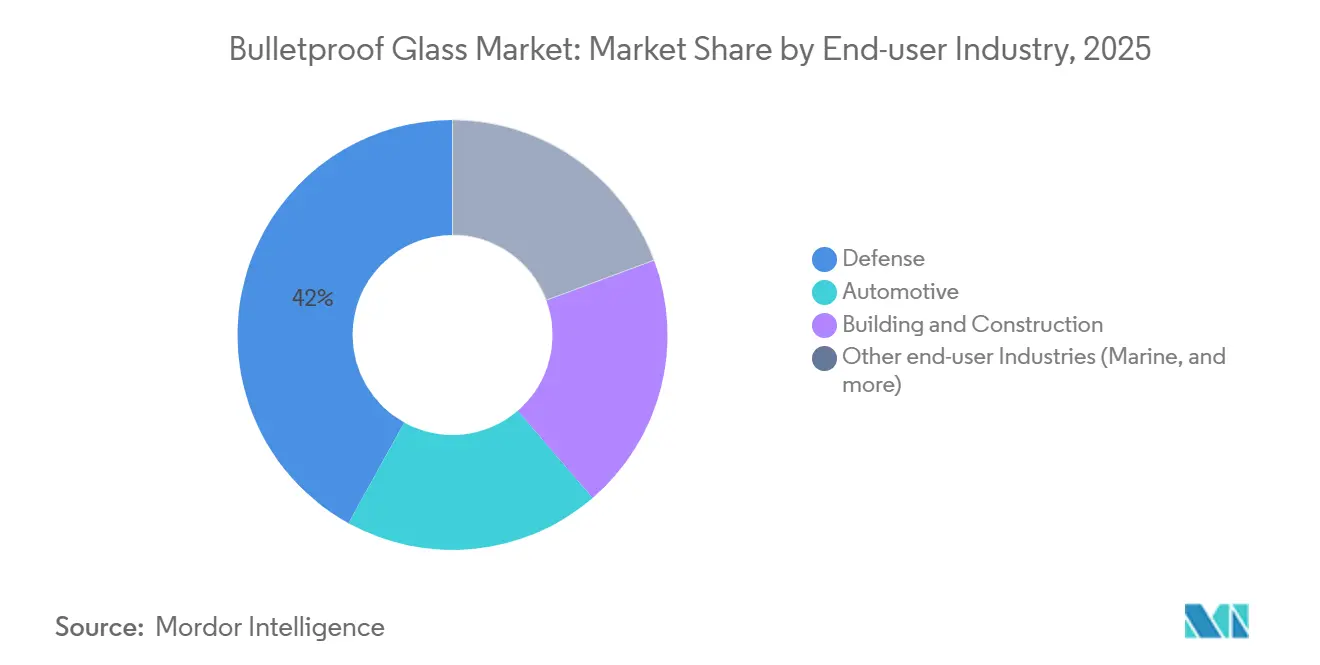
- By end-user industry, the Defense segment held 41.97% of the bulletproof glass market share in 2025, whereas the Automotive segment records the fastest CAGR at 11.92% through 2031.
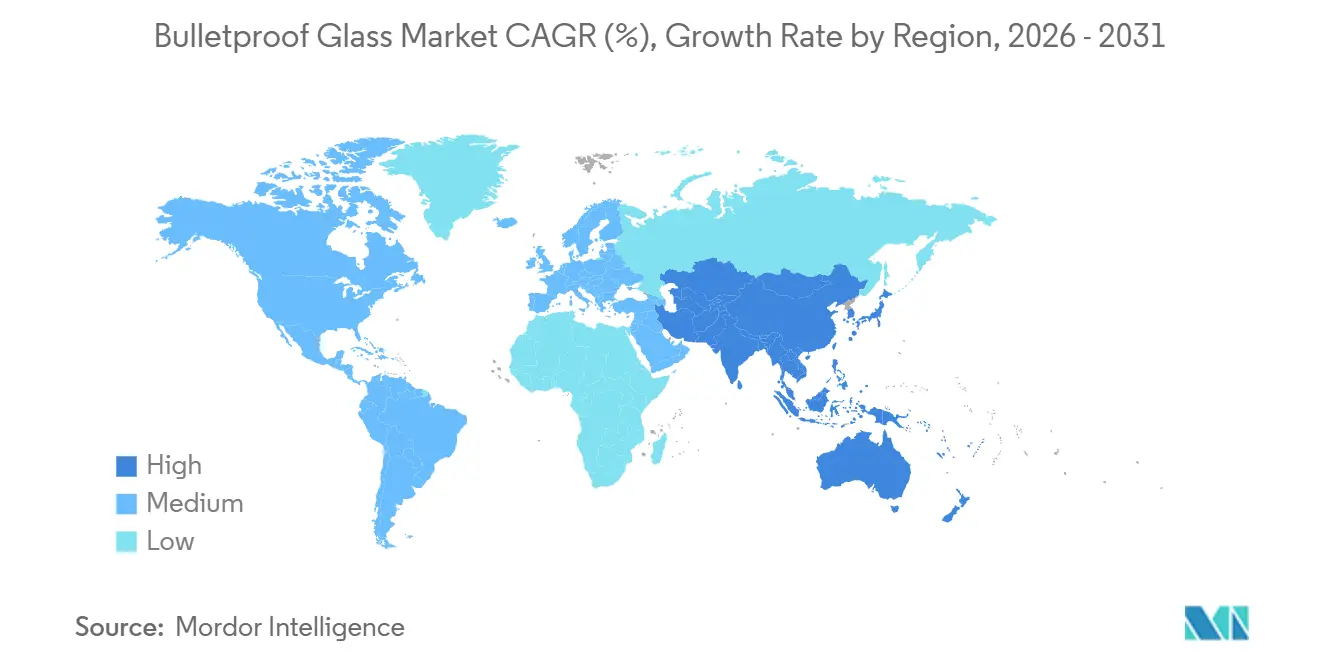
- By geography, North America accounted for 39.18% of the bulletproof glass market size in 2025, yet Asia Pacific is projected to grow at a 12.17% CAGR over the same period.
Note: Market size and forecast figures in this report are generated using Mordor Intelligence’s proprietary estimation framework, updated with the latest available data and insights as of January 2026.
Market Trends and Insights
Drivers Impact Analysis of Bulletproof Glass Market*
| Driver | (~) % Impact on CAGR Forecast | Geographic Relevance | Impact Timeline |
|---|---|---|---|
| Escalating global defense and homeland-security spending | +2.8% | North America, Europe, Middle East | Medium term (2-4 years) |
| Increasing infrastructure development in high-risk urban areas | +2.1% | China, India, Middle East, South America | Long term (≥ 4 years) |
| Growing utilization in luxury and armored vehicles | +1.9% | North America, Europe, Saudi Arabia, UAE | Short term (≤ 2 years) |
| Mandatory ballistic-facade codes in climate-resilient buildings | +1.5% | United States, Europe, China | Long term (≥ 4 years) |
| Rising demand for multi-threat transparent armor in electric public-transport fleets | +0.9% | China, India, United States | Medium term (2-4 years) |
| Source: Mordor Intelligence | |||
Escalating Global Defense and Homeland-Security Spending
Transparent-armor budgets are climbing as militaries favor survivability upgrades over new platforms. The US Army allocated USD 108 million in fiscal 2026 for its Vehicle Protection System, prioritizing retrofit kits that lighten legacy fleets[1]. The FBI issued a USD 45 million tender in 2025 for NIJ Level III shields and panels. The UK Ministry of Defence’s GBP 76 million framework, awarded in November 2025, focuses on VR7–VR9 civilian-profile vehicles. Weight limits in electric drivetrains are pushing the adoption of glass-clad polycarbonate and polymer-ceramic hybrids, with the US Navy SBIR funding lightweight laminates that cut mass by 25% against STANAG 4569 Level 3a threats.
Increasing Infrastructure Development in High-Risk Urban Areas
Megacities are embedding ballistic glazing in curtain walls to satisfy insurance and public-safety requirements. China’s JGJ 113-2015 mandates laminated safety glass in high-footfall buildings, and Shanghai extends the rule to façades taller than 24 m[2]. India’s Central Reserve Police Force specifies bulletproof vehicles for Z and Z Special protectees, driving retrofits of sedans and SUVs. In the United States, FEMA’s ASCE 7-22 tornado provisions and ASTM impact tests now overlap with ballistic standards, allowing a single laminate to meet windborne-debris and small-arms threats.
Growing Utilization in Luxury and Armored Vehicles
OEMs are bundling factory armor to retain value. BMW launched the i7 Protection in 2024, the first electric sedan verified to VPAM VR10, integrating 1,750 kg of armor while maintaining a 236-mile range. General Motors Defense unveiled the Suburban Shield in 2025 to serve diplomatic fleets. The US State Department widened its USD 400 million armored-EV contract beyond Tesla, prompting Ford and Rivian to lock in ballistic-glass supply. Middle-East VIP buyers routinely request VR7–VR9 protection, sustaining demand for lighter polycarbonate laminates.
Mandatory Ballistic-Facade Codes in Climate-Resilient Buildings
Government funding ties safe-room projects to stricter glazing rules. FEMA P-361 requires tornado-missile resistance, and ICC 500-2023 is compulsory for federally backed community shelters. The DoD’s UFC 4-010-01 bans fragment-retention films and stipulates a minimum of 6 mm polycarbonate or laminated glass on new federal buildings. Europe is harmonizing EN 1063 ballistic and EN 13124 blast standards, enabling single-product compliance. These codes trigger retrofits of pre-2020 facilities, boosting replacement demand.
Restraints Impact Analysis of Bulletproof Glass Market*
| Restraint | (~) % Impact on CAGR Forecast | Geographic Relevance | Impact Timeline |
|---|---|---|---|
| High raw-material and processing costs | −1.4% | Europe, North America | Short term (≤ 2 years) |
| Limited availability of skilled installers | −0.8% | North America, Europe, Asia-Pacific cities | Medium term (2-4 years) |
| Energy-intensive manufacturing process | −0.6% | Europe, North America, China | Long term (≥ 4 years) |
| Source: Mordor Intelligence | |||
High Raw-Material and Processing Costs
Polycarbonate spot prices ranged from USD 2,810 / t in North America to USD 1,810 / t in China for optical grades in 2025, while BPA-free resins carry a 12–18% premium. Autoclave bonding consumes up to 200 kWh / m², and TPU bonding adds 10–15% more energy. Recycled cullet cuts float-glass energy by 25%, but the post-consumer supply is limited outside Europe.
Limited Availability of Skilled Installers
AGMT certification demands 7,500 hours of field practice and quadrennial renewal, creating a lag between demand spikes and workforce supply. Improper edge sealing can reduce ballistic performance by up to 30%. Robotics trimmed lay-up errors but requires USD 0.5–1.5 million per line, limiting uptake by smaller glaziers.
*Our forecasts treat driver/restraint impacts as directional, not additive. The impact forecasts reflect baseline growth, mix effects, and variable interactions.
Bulletproof Glass Market Segment Analysis
By Type:
Polycarbonate Gains on Weight-Critical ApplicationsSolid acrylic held 45.19% of 2025 demand due to 92% light transmission and lower raw material cost. Polycarbonate is forecast to grow 10.21% annually through 2031 as defense and automotive buyers prioritize lighter, multi-hit laminates. Laminated glass remains prevalent in building façades that need blast retention, although its 40–60 kg/m² weight and interlayer aging limit use in mobile platforms. Glass-clad polycarbonate balances clarity and toughness but carries a 15–20% cost premium. Polymer-ceramic hybrids, including spinel and AlON strike faces, currently contribute under 5% of volume yet deliver 20–30% thickness savings, signaling future diffusion into automotive and aerospace fleets.
Demand for polycarbonate underscores the bulletproof glass market transition toward materials that reduce vehicle payload penalties without compromising NIJ Level III or VPAM VR7 standards. The bulletproof glass market size for polycarbonate laminates is projected to outpace acrylic by late-decade as factory-armored EVs and lightweight retrofit kits gain traction. Emerging TPU nanocomposites further lift spall strength by 34% compared with baseline TPU, extending service life and lowering replacement costs.

By End-User Industry:
Automotive Outpaces Defense on EV IntegrationDefense accounted for 41.97% of 2025 consumption, supported by multi-year military programs, yet growth remains single-digit amid budget plateaus. Automotive is set to advance at 11.92% CAGR through 2031 as OEMs like BMW and General Motors install ballistic packages at the assembly line to capture premium pricing. The bulletproof glass market share for factory-armored EVs is rising after the US State Department opened its USD 400 million contract to all domestic brands. Building and construction contribute roughly one-quarter of demand, anchored by FEMA and Chinese façade regulations.
Beyond core segments, marine, aerospace, and public transit consume niche volumes but grow double digits as they validate polymer-ceramic hybrids in weight-sensitive settings. The bulletproof glass industry is therefore broadening from defense-centric procurement to diversified mobility and infrastructure applications.
Geography Analysis
North America Bulletproof Glass Market
North America led the bulletproof glass market with 39.18% share in 2025 as US federal demand, including a USD 108 million Vehicle Protection System budget and a USD 45 million FBI tender, buoyed volumes. FEMA’s dual-threat glazing rules are aligning disaster-resilient and ballistic requirements, allowing suppliers to amortize certification costs across construction and defense projects. The broadened State Department EV framework has catalyzed domestic supply chains, while Canada and Mexico add incremental automotive retrofits.
APAC Bulletproof Glass Market
Asia-Pacific is the fastest-growing region at a 12.17% CAGR. China enforces JGJ 113-2015, fueling laminated façade upgrades across megacities, and Fuyao Glass committed USD 400 million to Illinois, plus CNY 9.1 billion to new domestic float lines aimed at new-energy-vehicle glazing. India’s 200-person VIP protection roster sustains armored-SUV retrofits. Japan and South Korea invest in transparent-ceramic R&D that promises 20–30% weight savings for next-generation infantry vehicles.
Europe, Middle East and South America Bulletproof Glass Market
In Europe, the UK’s GBP 76 million protected vehicle framework prioritizes low-profile electric SUVs. AGC’s January 2025 acquisition of SGT Germany and its October 2025 photovoltaic-glass recycling pilot illustrate incumbent moves toward vertical integration and lower-carbon float furnaces. EU ETS carbon pricing pressures margins yet accelerates recycled-content laminates. Saudi Arabia, UAE, and Brazil round out global pockets investing in ballistic façades for government and commercial assets.
Value Chain Analysis
The bulletproof glass value chain starts with upstream inputs, including float glass (silica sand, soda ash, limestone), polymer sheets and interlayers (notably polycarbonate and PVB), and specialty materials for advanced laminates such as ceramic strike faces (spinel and AlON) and TPU-based bonding layers. Production is centered on precision cutting, lay-up, and high-pressure autoclave bonding, followed by edge sealing, finishing, and ballistic testing and certification to NIJ, VPAM, EN 1063, or STANAG-related requirements depending on end use. Midstream value is increasingly captured by converters that can deliver multi-hit, lightweight glass-clad polycarbonate stacks, and by players with robotic bonding lines that reduce defects, but require significant capital investment.
Downstream, products flow through two main routes: direct supply to vehicle OEMs (including factory-armored programs), and project-based supply through façade contractors, security integrators, and specialty glazing distributors for government buildings, banks, and critical infrastructure. Bottlenecks are concentrated in materials and processing capacity. Industry reporting in March 2026 cited extended lead times of roughly 4 to 6 weeks for standard tempered glass amid tight allocations, while PVB interlayer pricing was reported up about 15% year over year, reinforcing the importance of long-term supply contracts, supplier diversification, and regionalized sourcing for delivery and certification continuity.
Competitive Landscape
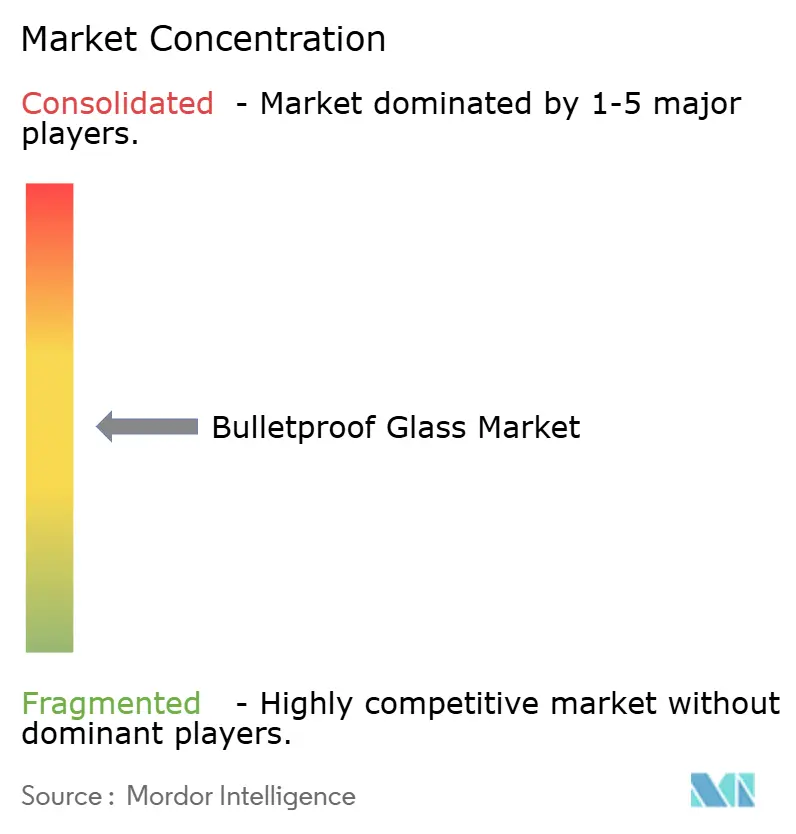
The bulletproof glass market is moderately concentrated. Process innovation is eclipsing scale as a differentiator. Saint-Gobain patented a sapphire-glass-polycarbonate laminate achieving 85% light transmission at 72.78 kg/m², aiming at electric-vehicle and aerospace niches. NxLite debuted low-emissivity coatings on polycarbonate that halve the weight versus glass while passing ASTM impact tests. Installer bottlenecks and energy costs invite disruption. Robotic bonding lines reduce labor needs but demand heavy capex, motivating smaller entrants to offer modular, pre-certified panels.
Bulletproof Glass Industry Leaders
-
Saint-Gobain
-
Guardian Industries
-
AGC Inc.
-
SCHOTT
-
Nippon Sheet Glass Co., Ltd.
- *Disclaimer: Major Players sorted in no particular order
Bulletproof Glass Market Companies Covered in this Report
- AGC Inc.
- AGP Group
- Armass Glass
- Armortex
- Binswanger Glass
- Centigon Security Group
- Fuyao Glass Industry Group Co., Ltd.
- Guardian Industries
- Isoclima S.p.A.
- Nippon Sheet Glass Co., Ltd.
- PPG Industries, Inc.
- Saint-Gobain
- SCHOTT AG
- TAIWAN GLASS IND. CORP.
- Total Security Solutions
- Trulite
Market Opportunities and Future Outlook
A key opportunity area is multifunctional, multi-threat glazing that consolidates ballistic resistance with adjacent performance needs such as fire protection, forced-entry resistance, and façade durability. Product direction is visible in recent commercial offerings, including AGC Glass Europe launching Pyrobel 16 BR4NS and Pyrobel 42 BR4NS in September 2025. These products combine fire protection ratings (EI 30/EI 90) with bullet resistance (BR4-NS) and anti-burglary performance (P8B), supporting procurement patterns in embassies, federal buildings, financial institutions, and high-risk urban projects that prefer fewer SKUs, simpler certification packages, and clearer compliance pathways.
Lightweight transparent armor remains an active white-space as mobility electrification tightens vehicle mass budgets and drives adoption of glass-clad polycarbonate and polymer-ceramic hybrids. Government-funded R&D provides near-term demand signals for advanced ceramics and processing scale-up, exemplified by AeroVironment receiving a USD 20 million award in May 2026 to advance ceramic materials research that includes transparent armor for the U.S. Air Force and Space Force. On capacity and localization, investments that expand regional coating and high-performance glass capability, such as Guardian Glass announcing a new sputter coater investment at its Egypt plant (operations scheduled for Q2 2026), align with the need to shorten lead times and tailor security glazing to Middle East and Africa infrastructure programs and cross-border supply constraints.
Recent Industry Developments in Bulletproof Glass Market
- May 2026: AeroVironment announced a USD 20 million contract to advance ceramic materials research, including transparent armor, for the U.S. Air Force and Space Force. The award reinforces funding pathways for lightweight strike-face materials and processing approaches that can translate into next-generation transparent armor laminates. It also strengthens the supplier ecosystem around advanced ceramics that support polymer-ceramic hybrid bullet-resistant glazing.
- December 2025: AGC Inc. announced its decision to exit the specialty glass for chemical strengthening business (Dragontrail series), with production at the Takasago Factory scheduled to end in Q3 2026. While not a ballistic product line, the move reallocates manufacturing focus and investment capacity within specialty glass operations. For security glazing buyers, it underscores the importance of qualifying multiple sources for high-performance glass inputs and conversion capabilities.
- September 2025: AGC Glass Europe launched Pyrobel 16 BR4NS and Pyrobel 42 BR4NS, combining fire protection (EI 30/EI 90), bullet resistance (BR4-NS), and anti-burglary performance (P8B). The launch reflects demand from critical infrastructure projects for single-glazing solutions that meet multiple risk scenarios. It also raises competitive pressure on suppliers to broaden certification portfolios beyond stand-alone ballistic ratings.
Bulletproof Glass Market Report Scope and Research Methodology
Market Definition and Coverage
This market is defined as the value of bullet-resistant transparent glazing sold as finished panels, where multiple glass and polymer layers are engineered to stop ballistic threats and are installed in vehicles, buildings, and security infrastructure.
Scope exclusions: We exclude retrofit security films, opaque armor materials, and after-installation services such as maintenance and repairs.
Segments Covered in This Report
- By Type
- Solid Acrylic
- Traditional Laminated
- Polycarbonate
- Glass-clad Polycarbonate
- Other Types (Polymer-Ceramic Hybrid, and more)
- By End-user Industry
- Automotive
- Building and Construction
- Defense
- Other End-user Industries (Marine, and more)
- By Geography
- Asia-Pacific
- China
- India
- Japan
- South Korea
- Rest of Asia-Pacific
- North America
- United States
- Canada
- Mexico
- Europe
- Germany
- United Kingdom
- France
- Italy
- Rest of Europe
- South America
- Brazil
- Argentina
- Rest of South America
- Middle-East and Africa
- Saudi Arabia
- South Africa
- Rest of Middle-East and Africa
- Asia-Pacific
Data Sources, Market Sizing, and Validation
Desk Research
Desk work is used to build the base demand map and the pricing context before any modeling starts. We typically refer to public safety and trade datasets such as UN Comtrade for laminated glass trade flows, USGS mineral and materials statistics for glass inputs, and Bureau of Labor Statistics price series that help explain cost and price movement over time.
Alongside that, we use sources such as building and security standards bodies that publish ballistic rating guidance, transportation and vehicle production statistics from government portals, and public procurement portals for security and defense projects when available. Company annual reports, investor presentations, and reputable press coverage are also used to cross-check capacity additions, product launches, and regional demand signals. In a few cases, paid subscriptions for company financials, patent databases, and shipment-level trade analytics are used to validate directionally, although the model is not dependent on a single database. These desk sources are illustrative, and many other public references are also used for data collection, validation, and research clarification.
Primary Interviews and Surveys
Primary work is used to pressure-test assumptions that are hard to verify from public data, especially for typical project mix, conversion from inquiries to orders, and how pricing changes by threat level and installation format. We speak with a mix of manufacturers, processors, distributors, glazing contractors, and end users across key regions so regional security needs and procurement cycles are represented.
Inputs from these discussions are then used to confirm the realistic split between vehicle, building, and institutional uses, and to align the final sizing with practical supply constraints and adoption patterns.
Distribution of primary research fieldwork respondents
| Company type | Respondent position | Region |
|---|---|---|
| Top tier: 35% | CXOs: 15% | APAC: 41% |
| Mid tier: 45% | Functional/Unit leaders: 28% | EMEA: 34% |
| Smaller Players: 20% | Managers: 57% | Americas: 25% |
Market-Sizing & Forecasting
The core model is built using a top-down approach where production, construction activity, and security procurement signals are used to reconstruct the demand pool for transparent armor glazing by region, and then translated into value using fit-for-purpose pricing. To keep the totals realistic, we corroborate the outputs with selective bottom-up checks such as sampled panel ASP times estimated volumes for a few high-visibility use cases, followed by channel checks with installers and distributors.
Key inputs that shape the model include the mix of ballistic rating levels specified in projects, vehicle and protected fleet build rates, the share of new builds adopting secure glazing in sensitive facilities, typical panel thickness and material stack, and regional import reliance indicated by trade data. Since gaps exist in public reporting for specialized glazing, missing pieces are handled through bounded ranges that are tightened using primary feedback, and then normalized so the implied volumes align with capacity and lead-time reality.
For forecasting, scenario analysis is used around security spending and construction pipelines, and the year-by-year curve is guided by the way procurement cycles and retrofit waves tend to behave in different geographies. Assumptions on price progression are kept practical by linking them to input cost movement and the observed premium attached to higher threat levels.
Data Validation & Update Cycle
Outputs are validated through multiple checks so one data series does not drive the result. We compare the modeled value trend against independent signals like trade movement, construction and vehicle production indicators, and visible tender activity, and then anomalies are reviewed before sign-off.
When large variances appear, the team re-checks scope alignment, re-contacts relevant respondents, and revisits any pricing or volume assumptions that could be overstated. Reports are refreshed annually, and interim updates are made when material events occur such as regulation changes, major capacity expansions, or sustained shifts in raw material pricing. Before final delivery, a last review pass is completed so clients receive the most current view available.
Mordor Intelligence's Bulletproof Glass Market Size Compared With Other Published Estimates
Published market sizes for bulletproof glass can look far apart, even when the topic name is the same, because the timing and mechanics behind the numbers are not always aligned. Differences usually come from what is counted as a finished panel, how pricing is averaged across threat levels, and whether the estimate is updated to reflect the latest currency and cost environment.
In refresh-led reviews, the spread is often explained by when exchange rates are captured, whether list prices are used instead of realized prices, and how much weight is given to vehicle versus architectural demand. A model that rechecks ASP movement by ballistic level and applies the same currency timing across regions, and then re-validates the totals against trade and procurement signals during each refresh, tends to land closer to the real purchase mix, which is how Mordor Intelligence keeps the 2026 figure tied to repeatable checks.
Benchmark comparison
| Source | Market Size | Gaps in Research Methodology |
|---|---|---|
| Mordor Intelligence | USD 10.68 B (2026) | |
| Global Research Publisher A | USD 8.80 B (2024) | Uses a different timing window and base year, and the value appears to reflect earlier pricing and currency conditions, which can understate recent ASP shifts for higher rating levels. |
| Industry Publisher B | USD 9.97 B (2025) | Starts from a different base year and longer horizon, and the pricing build can vary if vehicle and building mixes are assumed differently across regions and threat classes. |
The comparison shows that the main differences are not about math complexity, but about scope boundaries, pricing logic, and update timing. By keeping the pricing tied to threat-level mix and applying consistent year-specific currency treatment, the sizing steps stay transparent and can be repeated when new demand or cost signals emerge.
Key Questions Answered in the Report
What is the 2026 value of the bulletproof glass market?
The bulletproof glass market size stands at USD 10.68 billion in 2026.
How fast will global demand grow through 2031?
Market revenue is forecast to expand at a 9.12% CAGR between 2026 and 2031.
Which product type is growing the quickest?
Polycarbonate laminates are advancing at a 10.21% annual rate through 2031 as buyers seek lighter, multi-hit solutions.
Which end-user will add the most incremental volume?
Automotive leads growth, with an 11.92% CAGR thanks to factory-integrated armored electric vehicles.
Why is Asia-Pacific the fastest-growing region?
China’s façade mandates and India’s VIP-protection fleet are driving a 12.17% regional CAGR.