
Building Inspection Services Market Size and Share
Market Overview
| Study Period | 2020 - 2031 |
|---|---|
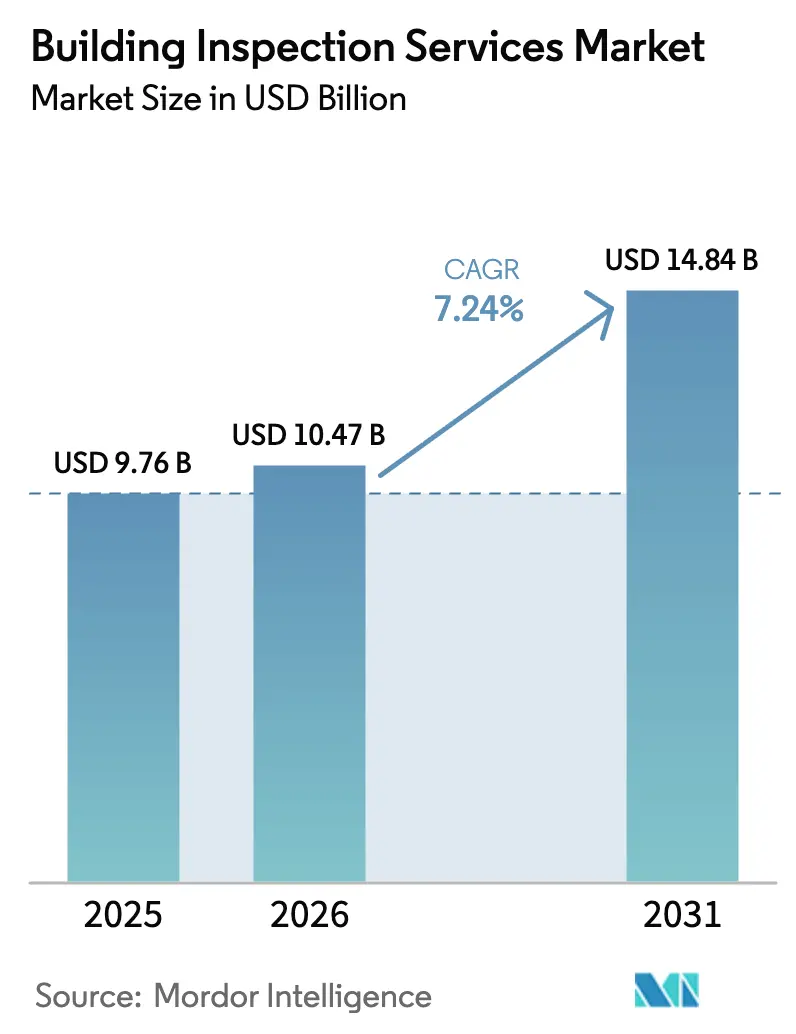
| Market Size (2026) | USD 10.47 Billion |
| Market Size (2031) | USD 14.84 Billion |
| Growth Rate (2026 - 2031) | 7.24 % |
| Fastest Growing Market | Europe |
| Largest Market | North America |
| Market Concentration | Low |
Major Players *Disclaimer: Major Players sorted in no particular order Image © Mordor Intelligence. Reuse requires attribution under CC BY 4.0. | |
Building Inspection Services Market Analysis by Mordor Intelligence
Building Inspection Services market size in 2026 is estimated at USD 10.47 billion, growing from 2025 value of USD 9.76 billion with 2031 projections showing USD 14.84 billion, growing at 7.24% CAGR over 2026-2031.
Rising real-estate transaction volumes, tightening safety codes, and rapid uptake of digital tools such as drone imagery and AI-assisted defect analytics are the primary growth catalysts. The European Union’s net-zero building mandate, effective in 2024, is accelerating demand for energy-audit inspections, while North America retains leadership thanks to mature mortgage markets and early technology adoption[1]. The competitive intensity remains high because thousands of local operators coexist with global testing, inspection, and certification (TICC) firms. Market participants who invest in automation, advanced sensors, and data analytics are capturing premium contracts and improving operating margins.
Key Report Takeaways
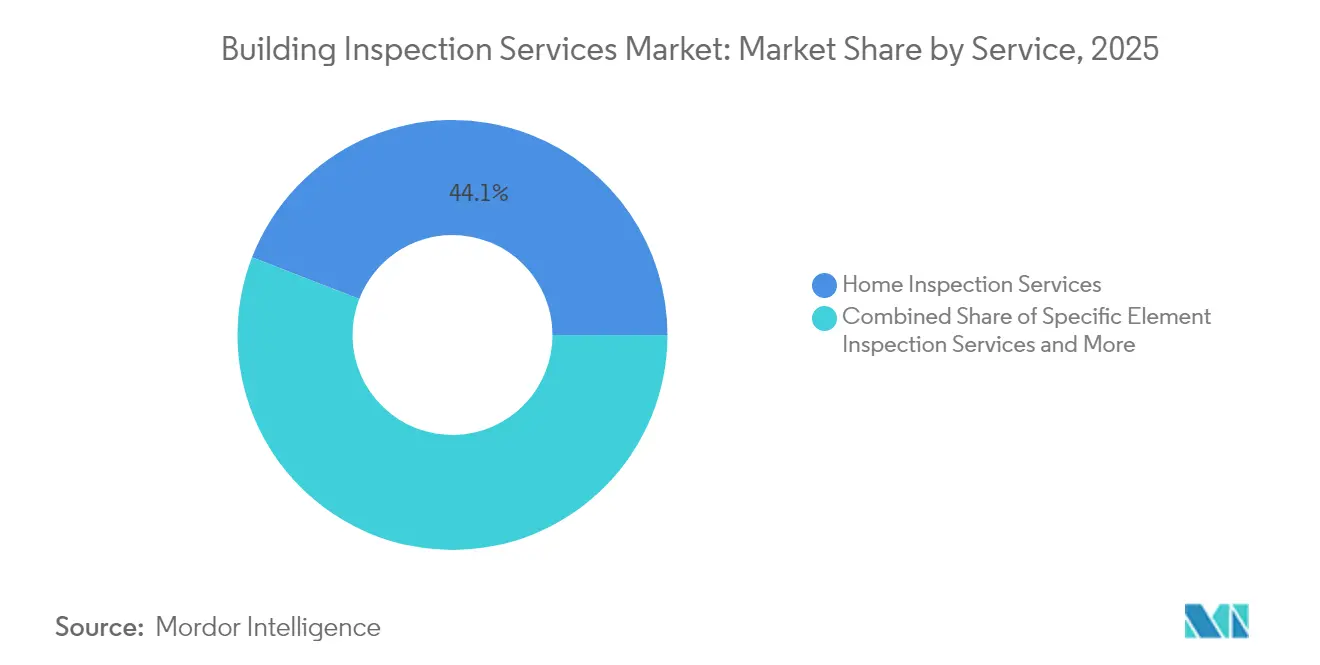
- By service, Home Inspection Services led with 44.12% of the building inspection services market share in 2025, whereas Other Specialised Services are projected to expand at an 8.74% CAGR through 2031.
- By sourcing type, In-House Services accounted for 56.21% of revenue in 2025, while Outsourced Services are forecast to grow at an 8.25% CAGR between 2026 and 2031.
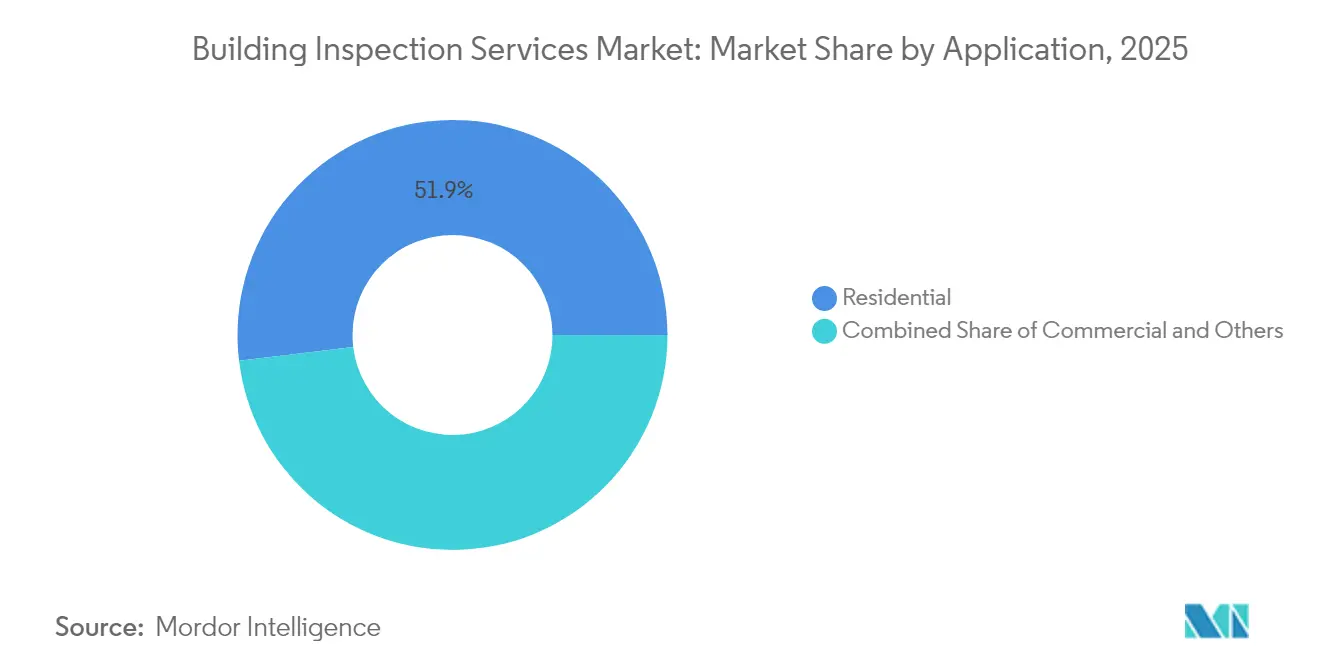
- By application, Residential accounted for 51.92% of the building inspection services market size in 2025, and Others (industrial, infrastructure, data centers) are poised for an 11.05% CAGR by 2031.
- By end user, Real-Estate Agencies & Brokers commanded 38.22% of revenue in 2025; Government & Municipalities represent the fastest expansion at 8.74% CAGR to 2031.
- By geography, North America remained the largest regional contributor in 2025, while Europe is projected to register the highest growth rate through 2031.
Note: Market size and forecast figures in this report are generated using Mordor Intelligence’s proprietary estimation framework, updated with the latest available data and insights as of 2026.
Market Trends and Insights
Drivers Impact Analysis of Building Inspection Services Market*
| Driver | (~) % Impact on CAGR Forecast | Geographic Relevance | Impact Timeline |
|---|---|---|---|
| Stricter building-safety regulations & codes | +2.1% | Global, led by EU and North America | Medium term (2-4 years) |
| Growing volume of real-estate transactions | +1.8% | Global, with concentration in North America & APAC | Short term (≤ 2 years) |
| Net-zero mandates driving energy-audit demand | +1.5% | EU leading, North America following | Long term (≥ 4 years) |
| Ageing building stock in OECD economies | +1.2% | North America & EU primarily | Long term (≥ 4 years) |
| Rapid uptake of drone-based aerial inspection | +0.9% | Global, early adoption in North America & EU | Short term (≤ 2 years) |
| AI-enabled defect analytics in smart buildings | +0.7% | APAC core, spill-over to North America & EU | Medium term (2-4 years) |
| Source: Mordor Intelligence | |||
Stricter Building-Safety Regulations & Codes
The 2024 International Building Code introduces tornado load metrics, higher wind-resistance thresholds, and universal carbon-monoxide detection, raising baseline inspection complexity[2]. Ontario eliminated 1,730 provincial code variations in 2024, streamlining compliance while keeping rigorous safety checks. California’s SB-721 requires deck inspections for multifamily properties by January 2025, generating a new niche for specialists. These policies increase the value of third-party inspection certificates and encourage continual professional development among providers.
Growing Volume of Real-Estate Transactions
Stabilizing mortgage rates are reviving housing turnover; the National Association of REALTORS projects a 9% increase in U.S. home sales during 2025.[3] Canadian home sales advanced 10% in 2024 despite regulatory shifts that eased stress-test rules and raised insured mortgage caps. State legislation, such as the pending Massachusetts bill that disallows inspection waivers, underscores regulatory momentum for mandatory assessments. Commercial real-estate deals in data-center and renewable-energy assets add incremental inspection demand. The surge tightens capacity because certified inspectors remain in short supply, nudging service prices upward in tight local markets.
Ageing Building Stock in OECD Economies
Many North American and European structures exceed 30-year lifespans, demanding regular condition assessments that go beyond basic code compliance. The 2024 International Existing Building Code emphasizes cost-effective repair and alteration pathways, turning recurring inspections into a strategic asset-management tool. Australian studies show that proactive maintenance raises tenant satisfaction and property values, validating inspection ROI for owners. Non-destructive testing and predictive analytics allow owners to extend building life cycles without disruptive renovations.
Rapid Uptake of Drone-Based Aerial Inspection
Global drone inspection revenue is projected to hit USD 23 billion within three years as automated platforms slash cost and risk. Research shows median savings of USD 5,043 per bridge inspection when drones replace scaffolding and snooper trucks. AI-enabled platforms create 3D models, detect micro-cracks, and auto-populate defect logs, shortening report turnaround time. Privacy rules and flight-path approvals still limit residential use, but commercial and infrastructure owners embrace the technology for routine maintenance schedules.
Restraints Impact Analysis of Building Inspection Services Market*
| Restraint | (~) % Impact on CAGR Forecast | Geographic Relevance | Impact Timeline |
|---|---|---|---|
| Highly fragmented provider landscape & price pressure | -1.4% | Global, most acute in North America | Short term (≤ 2 years) |
| Shortage of certified inspectors | -1.8% | Global, severe in North America & EU | Medium term (2-4 years) |
| Rising liability-insurance premiums | -0.6% | Global, led by North America | Short term (≤ 2 years) |
| Privacy concerns around drone/remote inspections | -0.4% | EU leading, North America following | Long term (≥ 4 years) |
| Source: Mordor Intelligence | |||
Highly Fragmented Provider Landscape & Price Pressure
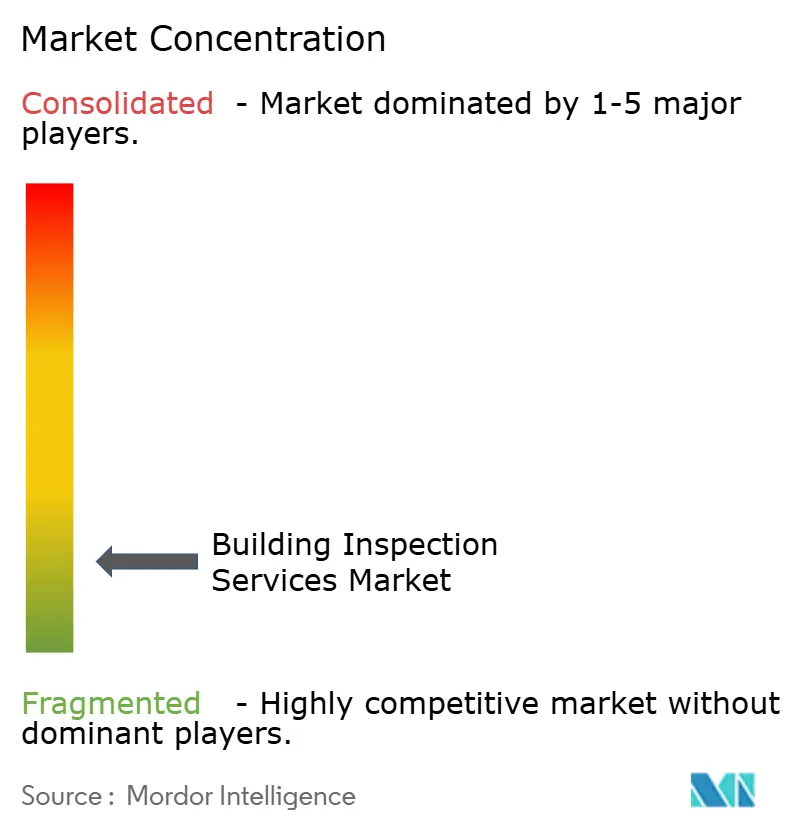
Thousands of sole proprietors and small regional firms compete on commodity home inspection work, keeping average ticket prices flat in many U.S. metros. Private equity funds continue to consolidate niche providers, aiming to build national footprints with data-driven scheduling and cross-selling synergies. Despite ongoing deals, the top five firms still account for well under one-third of global revenue, so price competition remains intense for routine assignments. Operators differentiate by investing in specialized services such as energy auditing, façade safety certifications, and drone-enabled façade scans that command premium rates. Customers reward end-to-end platforms that blend on-site data capture with cloud-based analytics and digital report delivery.
Shortage of Certified Inspectors
Oregon reported a deficit of 115 residential inspectors in 2024, delaying permitting timelines for new housing starts. Certification pathways require classroom instruction, supervised field hours, and continuing education, making capacity expansion slow. The U.S. labor gap in construction trades exceeded 500,000 workers in 2024, increasing defect risks and potential liability claims. Rising professional liability premiums, 75% of underwriters raised rates by 5% in 2024, further squeezing independent contractors. Technology aids productivity, yet seasoned inspectors remain indispensable for final sign-offs under most codes.
*Our forecasts treat driver/restraint impacts as directional, not additive. The impact forecasts reflect baseline growth, mix effects, and variable interactions.
Building Inspection Services Market Segment Analysis
By Service:
Specialization Drives Premium GrowthHome Inspection Services captured 44.12% of the building inspection services market share in 2025 as transaction-driven demand rebounded. Many U.S. states are revoking waiver clauses, so every residential deal now requires a certified report, lifting unit volumes. Commercial Building Inspection Services grew steadily because data center, logistics, and renewable-energy projects incorporate inspection milestones tied to financing schedules. The building inspection services market size for Other Specialised Services is projected to widen at an 8.74% CAGR, fueled by energy audits, drone surveys, and AI-enabled façade analytics.
Providers are bundling thermal imaging, blower-door testing, and carbon-intensity calculations to meet Europe’s zero-emission mandates. California’s deck safety checks and Denver’s mandatory ANSI/ASHRAE/ACCA 211-2018 Level 2 energy audits illustrate how niche regulations spark high-margin assignments. Firms that combine structural engineers with software developers create defensible competitive moats.

By Sourcing Type:
Outsourcing Gains MomentumIn-house inspection teams retained 56.21% of revenue in 2025 because large real-estate owners and facility managers prefer direct oversight. Yet the building inspection services market size for Outsourced Services is projected to climb at an 8.25% CAGR through 2031 as codes grow more complex and technologies evolve rapidly. External specialists spread tech costs across a diverse client base, making high-resolution lidar or AI platforms affordable for mid-sized owners.
Insurers and lenders increasingly require third-party certifications to reduce conflict-of-interest exposure. The Co-operators’ 2024 acquisition of Carson Dunlop illustrates how insurance groups are vertically integrating to secure inspection expertise that handles more than 200,000 assignments annually. Outsourcing also mitigates labor shortages because national providers redeploy staff to hotspots, smoothing capacity imbalances.
By Application:
Diversification Beyond ResidentialResidential assets generated 51.92% of 2025 revenue, but the Others segment, which bundles industrial facilities, bridges, and data centers, is set to register the fastest 11.05% CAGR to 2031. Owners of hyperscale data centers demand real-time thermal mapping and computational fluid dynamics validation at each construction milestone. NV5 Global secured USD 14 million in 2024 contracts to deliver AI-driven MEP designs exceeding one gigawatt of capacity, underscoring non-residential momentum.
Infrastructure authorities adopt continuous health-monitoring sensors, translating into recurring subscriptions rather than one-time reports. This annuity model boosts average client lifetime value and insulates revenue from housing-cycle volatility. The building inspection services market continues to diversify as specialty engineers target petrochemical plants, water-treatment facilities, and offshore wind platforms.
By End User:
Government Sector EmergesReal estate Agencies & Brokers accounted for 38.22% of 2025 spend because agents rely on timely inspections to close deals. Government & Municipalities exhibit the highest 8.74% CAGR through 2031, propelled by infrastructure-upgrade programs and mandated performance standards. The U.S. Department of Housing and Urban Development’s NSPIRE framework standardizes physical inspections across public housing stock, creating predictable workstreams for qualified contractors.
Maryland’s Building Energy Performance Standards oblige owners of buildings above 35,000 ft² to submit annual energy data, reinforcing public-sector inspection pipelines. Insurers and lenders also commission inspections to calibrate underwriting models, and private-equity asset managers order deep-dive due diligence checks before portfolio acquisitions. Diverse end-user demand cushions providers against cyclical shocks in any single segment.
Geography Analysis
North America Building Inspection Services Market
North America remained the largest regional contributor in 2025, underpinned by stringent codes, a high replacement rate for aging stock, and technology-friendly regulators. The 2024 International Building Code update, plus state ordinances such as California’s Title 24 revisions requiring solar and battery systems in new construction, expand inspection scope. The U.S. Department of Energy’s formal definition of a zero-emissions building sets uniform guidance that inspection firms must validate before occupancy permits are issued. Capacity constraints, exemplified by the Oregon inspector shortfall, keep utilization rates high and support pricing.
Europe Building Inspection Services Market
Europe is the fastest-growing market because the Energy Performance of Buildings Directive mandates zero-emission status for all new structures by 2030 and for public buildings by 2028. Minimum energy-performance standards force upgrades on the worst-performing 16% of the stock, unlocking steady retrofit inspection work. Enhanced Energy Performance Certificates and building-renovation passports embed inspection checkpoints through the asset lifecycle, creating multi-year revenue visibility. Providers with thermal-imaging drones and lifecycle-carbon calculators are winning cross-border frameworks.
APAC Building Inspection Services Market
Asia-Pacific is experiencing robust expansion led by infrastructure spending and smart-city initiatives. Japan’s construction output reached USD 609.27 billion in 2024 and is projected at USD 716.66 billion by 2029, sustaining demand for compliance verification and quality control. Bureau Veritas’ acquisition of Australia-based APP Group in 2024 strengthened its footprint across large-scale transport projects, illustrating the region’s consolidation trend. Disparate national codes still hamper cross-border standardization, but pan-regional clients favor firms that can navigate local requirements while deploying uniform digital platforms.

Note: Segments share of all individual segments available upon report purchase
Regulatory Landscape
Building inspection services are shaped by building codes, energy-performance mandates, and professional licensing rules that differ by jurisdiction, which keeps demand oriented toward documented, third-party assessments. In North America, the International Code Council's 2024 I-Code suite (including updates affecting wind resistance and carbon-monoxide detection) expands inspection scope, while state and provincial actions add targeted requirements, including California's SB-721 deck inspection deadline in January 2025 and Ontario's 2024 elimination of 1,730 provincial code variations to streamline compliance.
Regulation also extends into professional practice. Home inspector licensing is required in at least 40 U.S. states, and many programs reference industry Standards of Practice in law, with exams, documented experience, and liability coverage. Industry bodies influence baseline inspection content through standards updates, including the American Society of Home Inspectors (ASHI) Standard of Practice updated on January 8, 2026, and frameworks used across programs aligned with InterNACHI standards, while state regulators such as the North Carolina Home Inspector Licensure Board oversee licensure, education, and standards adoption.
Value Chain Analysis
Demand typically starts with real-estate transaction activity, with lenders and insurers, facility managers, and public agencies also commissioning inspections, followed by scheduling, on-site inspection, diagnostics, reporting, and any follow-on verification. Upstream inputs include inspector labor (licensed or certified where required) and procurement of diagnostic tools such as infrared cameras, moisture meters, and drone-based imaging, increasingly supported by mobile field apps and cloud reporting platforms to standardize data capture and reduce turnaround times.
Delivery and monetization run through independent operators, regional firms, and global testing, inspection, and certification (TICC) providers, as well as franchise networks that offer branding, training, and operating playbooks. Franchise systems such as AmeriSpec, HouseMaster, and WIN Home Inspection help smaller operators compete in a fragmented market by centralizing marketing, education, and quality systems, while specialized subcontractors (structural engineers, MEP specialists, energy auditors, and drone pilots) extend capability for higher-complexity assignments tied to codes, energy-performance requirements, and asset-condition due diligence.
Competitive Landscape
The building inspection services market is highly fragmented; the top five companies account for less than 30% of worldwide revenue, leaving ample space for regional challengers. Global TICC majors, including Bureau Veritas, SGS, and Intertek, use bolt-on acquisitions to add niche skills and fill geographic gaps. Bureau Veritas posted EUR 6,240.9 million in revenue in 2024, up 6.4% year-over-year, and completed 10 deals that expanded its Buildings & Infrastructure practice. These platforms leverage centralized R&D to deploy AI crack-detection modules and cloud-based reporting across diverse markets.
Mid-cap specialists pursue technology differentiation. NV5 Global finalized multiple buys in geospatial and fire-protection engineering to create bundled service lines that integrate lidar collection, computational fluid-dynamics modeling, and life-safety design. Acuren Corporation’s planned merger with NV5 will form a USD 2 billion revenue entity with a projected USD 350 million adjusted EBITDA, highlighting investor appetite for scale efficiencies in inspection and engineering. Firms such as Mistras Group apply acoustic-emission sensors for continuous structural monitoring, converting episodic inspections into subscription contracts.
Start-ups focus on AI analytics, leveraging high-resolution imagery from drones and fixed sensors to generate automated compliance dashboards. Venture investment favors SaaS-enabled inspection models that promise rapid scalability with modest field staff additions. However, rigorous accreditation requirements and rising liability insurance premiums create hurdles to market entry. Strategic partnerships between software developers and established inspection firms are emerging as a pragmatic route to combine domain expertise with cutting-edge algorithms.
Building Inspection Services Industry Leaders
-
Amerispec Inspection Services
-
HouseMaster
-
National Property Inspections
-
Pillar to Post
-
WIN Home Inspection
- *Disclaimer: Major Players sorted in no particular order
Building Inspection Services Market Companies Covered in this Report
- SGS Group
- Bureau Veritas
- Intertek Group plc
- DEKRA SE
- NV5 Global
- AmeriSpec Inspection Services
- HouseMaster
- National Property Inspections
- Pillar To Post
- WIN Home Inspection
- SAFEbuilt
- Quality Built
- Criterium Engineers
- Houspect
- Resicert
- HomeTeam Inspection Service
- InterNACHI (International Association of Certified Home Inspectors)
- DEKRA Drone Inspection Services
- AeroSpect NY
- Drone Fly Inspect
Market Opportunities and Future Outlook
Service-mix expansion beyond transaction-led home inspections is a key whitespace, especially for energy and carbon compliance, building condition assessments for renovations, and specialized diagnostics that can command premium pricing. Europe also provides a clear pull-through mechanism through the Energy Performance of Buildings Directive, effective in 2024, which accelerates energy-audit inspections and documentation workflows, including enhanced energy performance certificates and renovation passports. In the United States, code complexity and targeted mandates such as California's SB-721 deck inspection requirements keep creating niche specialist demand for providers that can standardize processes across markets.
Technology-based differentiation is also increasing the practical scope of inspections in commercial and infrastructure settings where access and safety constraints are material. Drone imagery, thermal tools, and AI-assisted defect analytics reduce field risk and shorten reporting cycles, supporting bundled offerings for data centers, logistics facilities, and public assets where owners and financiers want repeatable inspection milestones backed by third-party documentation. Consolidation and platform-building create further partnership routes for smaller operators, as larger TICC firms and scaled specialists use acquisitions and integrated digital reporting to broaden service catalogs and build repeatable national delivery models.
Recent Industry Developments in Building Inspection Services Market
- January 2026: Pillar To Post Home Inspectors announced strategic appointments to expand its corporate support infrastructure for franchise operators. The updates are aimed at increasing training capacity and operational consistency for franchise territories, supporting faster deployment of standardized inspection processes.
- August 2025: Pillar To Post Home Inspectors completed the systemwide rollout of its HomePage digital platform for integrated inspection reporting and visual home tours. Standardizing digital deliverables tightens turnaround times and improves client communication, sharpening competition around tech-enabled customer experience.
- August 2024: National Property Inspections announced expansion into 15 new territories across North America during the first half of 2024. The territory growth increases local service availability in a capacity-constrained labor market and intensifies competition among franchise-led inspection networks.
Building Inspection Services Market Report Scope and Research Methodology
Market Definition and Coverage
This market covers revenue earned from services that inspect buildings and document condition, safety, and code compliance for residential and non-residential properties, including pre-purchase checks and targeted inspections of specific building elements.
Scope exclusions: It excludes product sales (tools, sensors, software) and broader testing and certification work that is not part of a building inspection service engagement.
Segments Covered in This Report
- By Service
- Home Inspection Services
- Specific Element Inspection Services
- Commercial Building Inspection Services
- Other Specialised Services
- By Sourcing Type
- In-House Services
- Outsourced Services
- By Application
- Residential
- Commercial
- Others
- By End User
- Real-Estate Agencies & Brokers
- Property Owners & Investors
- Government & Municipalities
- Insurance & Financial Institutions
- Facility-Management Firms
- By Geography
- North America
- United States
- Canada
- Mexico
- South America
- Brazil
- Argentina
- Chile
- Rest of South America
- Europe
- United Kingdom
- Germany
- France
- Italy
- Spain
- Netherlands
- Rest of Europe
- Middle East and Africa
- Saudi Arabia
- United Arab Emirates
- Rest of Middle East and Africa
- Asia-Pacific
- China
- India
- Japan
- South Korea
- Australia
- Indonesia
- Rest of Asia-Pacific
- North America
Data Sources, Market Sizing, and Validation
Desk Research
We start by building a plain fact base on the activity that drives building inspections, then map that activity into service demand. Public sources such as US Census Bureau construction statistics, the US Bureau of Labor Statistics occupation data for construction and building inspectors, Eurostat construction indicators, and World Bank urbanization and housing metrics anchor the macro direction.
To make the model usable at country level, building code and permitting references from official municipal or national portals, plus publications from professional inspection associations and standards bodies, are reviewed to understand typical inspection touchpoints and frequency. We also use general secondary sources like company filings, investor presentations, and trusted press coverage to sanity check service mix and pricing movement, and we selectively reference paid subscriptions for company financials and an import-export shipment level database when it helps validate construction activity signals. The sources listed here are illustrative and not exhaustive, and many other public and paid references were used for data collection, validation, and clarification.
Primary Interviews and Surveys
Our primary work focuses on verifying what desk sources cannot show cleanly, including how often inspections happen and what clients actually pay across property types. We interview and survey inspection firms, real estate transaction participants, and commercial property stakeholders across major regions, so assumptions on service scope, utilization, and pricing can be adjusted before finalizing the model.
Distribution of primary research fieldwork respondents
| Company type | Respondent position | Region |
|---|---|---|
| Top tier: 30% | CXOs: 18% | APAC: 38% |
| Mid tier: 48% | Functional/Unit leaders: 29% | EMEA: 37% |
| Smaller Players: 22% | Managers: 53% | Americas: 25% |
Market-Sizing & Forecasting
Sizing begins with a top-down build where construction activity and the in-use building base are converted into an inspection demand pool, then translated into revenue using typical pricing by job type. We check the results using selective bottom-up approximations, such as sampled provider revenue ranges, staffing capacity proxies, and a price per inspection multiplied by estimated inspection volumes in key countries.
Inputs used in the model include housing transactions and mortgage activity (as a trigger for pre-purchase inspections), building permits and completions (as a trigger for code and stage inspections), the aging building stock (which increases periodic condition checks), commercial floor space additions, and the mix between outsourced versus in-house inspection teams. Where primary feedback indicates large local differences in pricing, hourly rates and job duration assumptions are localized before totals are rolled up. When small-provider revenue is hard to observe, gaps are handled using conservative utilization bands tied to workforce indicators, then reviewed against transaction and permitting trends.
For forecasting, scenario analysis is applied around a base case consistent with expected construction cycles and real estate turnover, and key inputs are stress-tested for rate and volume sensitivity. The forecast path is then tuned using primary expert views on fee inflation, inspector availability constraints, and expected changes in inspection requirements driven by code updates.
Data Validation & Update Cycle
We validate outputs by comparing implied inspection volumes and revenue per inspection against independent signals like construction permits, housing turnover, and workforce capacity, then flag mismatches for rework. Variance checks are run at country and regional levels so sudden spikes are tied to a real driver (policy change, rebuilding activity, or transaction surges) before sign-off.
A multi-step analyst review is followed, and we re-contact sources when pricing, sourcing mix, or service scope assumptions appear out of line with recent market behavior. Reports are refreshed annually, with interim updates when a material event changes construction activity or inspection rules, and a final pre-delivery check is done so clients receive the latest updated view.
Mordor Intelligence's Building Inspection Services Market Size Compared Against Other Published Estimates
Published market values for building inspection services can look far apart because the boundary of what counts as an inspection job is not consistent across sources, and the timing of the base year also varies. Differences also show up when one estimate relies more on economic modeling, and another leans heavily on company roll-ups or limited regional sampling.
Permitting and housing transaction indicators, along with interview checks on inspection frequency and typical fee ranges, are used as evidence to keep Mordor Intelligence's 2026 market size tied to a repeatable demand pool rather than broader construction testing work. Other estimates may include adjacent testing, inspection, and certification services, or they may treat energy efficiency audits as part of a larger bundled category, which changes the total quickly even when the same countries are covered.
Benchmark comparison
| Source | Market Size | Gaps in Research Methodology |
|---|---|---|
| Mordor Intelligence | USD 10.47 B (2026) | |
| Industry Data Publisher A | USD 13.20 B (2026) | Uses an industry-revenue style definition that can pull in a wider set of inspection related activities across many countries, and it does not clearly separate building inspection jobs from broader inspection bureaus or adjacent compliance services. |
| Research House B | USD 13.20 B (2024) | Uses a different base year and may blend professional building inspections with wider compliance and performance assessments, which can lift totals if service boundaries and pricing progression are not normalized to inspection-only engagements. |
The spread mainly comes from how narrowly the service is defined and how the base year is set, since these two choices drive volumes, pricing, and what gets counted as revenue. By tying the model to visible construction and transaction signals and then cross-checking fee and frequency assumptions through primary validation, the final number stays transparent and easier to replicate.
Key Questions Answered in the Report
How large is the building inspection services market in 2026?
It is valued at USD 10.47 billion in 2026 and is projected to reach USD 14.84 billion by 2031.
Which service category holds the biggest share of the building inspection services market?
Home Inspection Services led with 44.12% of revenue in 2025.
What is the fastest-growing segment in the building inspection services market?
Other Specialised Services, including energy audits and drone inspections, is forecast to expand at an 8.74% CAGR through 2031.
Which region is expected to grow the quickest?
Europe will post the highest regional CAGR as the EU enforces zero-emission building mandates.
How are drones influencing the building inspection services industry?
Drone-enabled surveys cut median inspection costs by more than USD 5,000 per assignment and improve safety by removing personnel from hazardous locations.
Why is the shortage of certified inspectors a concern?
Labor gaps delay permitting and raise liability exposure; Oregon alone reported a deficit of 115 inspectors in 2024, reflecting wider North American constraints.