
Broadcast Equipment Market Size and Share
Market Overview
| Study Period | 2020 - 2031 |
|---|---|
| Market Size (2026) | USD 5.93 Billion |
| Market Size (2031) | USD 8.02 Billion |
| Growth Rate (2026 - 2031) | 6.23 % |
| Fastest Growing Market | Asia-Pacific |
| Largest Market | North America |
| Market Concentration | Medium |
Major Players *Disclaimer: Major Players sorted in no particular order Image © Mordor Intelligence. Reuse requires attribution under CC BY 4.0. | |
Broadcast Equipment Market Analysis by Mordor Intelligence
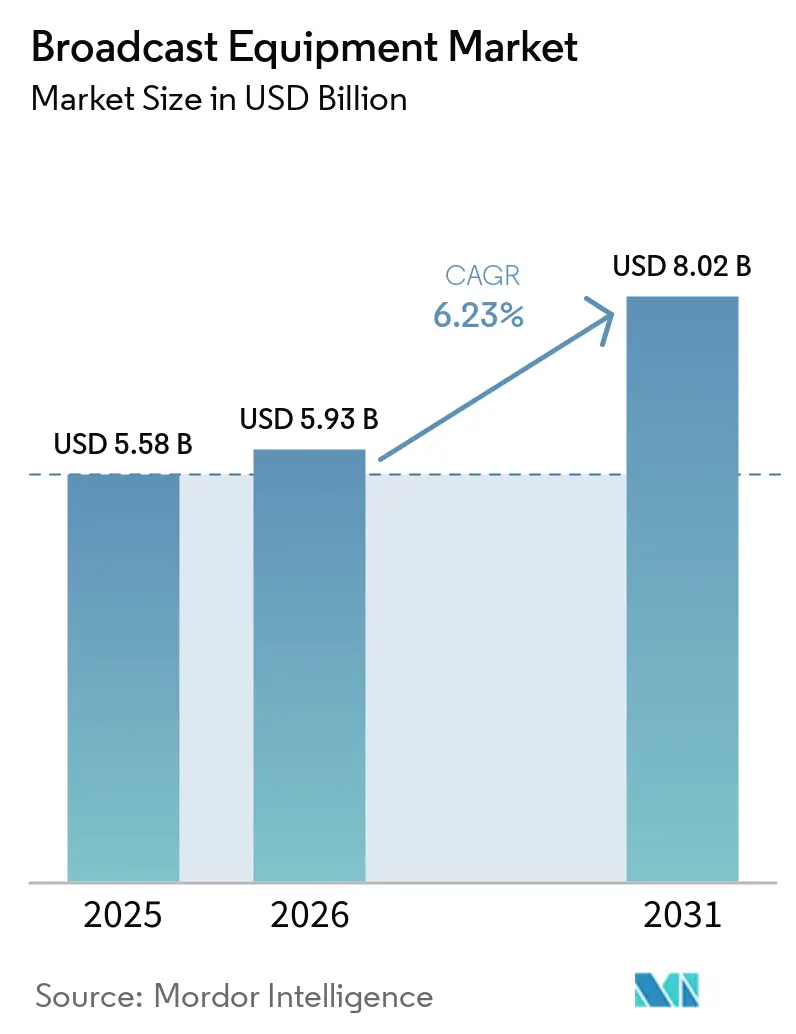
The Broadcast Equipment market size is expected to grow from USD 5.58 billion in 2025 to USD 5.93 billion in 2026 and is forecast to reach USD 8.02 billion by 2031 at 6.23% CAGR over 2026-2031.
This expansion in the Broadcast Equipment Market reflects the steady replacement of legacy, hardware-centric systems with software-defined, IP-native, and cloud-enabled architectures that cut capital costs and improve workflow agility. Intensifying direct-to-consumer streaming competition, surging demand for remote production, and ongoing digital switch-over mandates continue to steer purchasing decisions toward flexible equipment that supports multiple codecs, hybrid contribution networks, and real-time resource scaling. Established vendors strengthen their portfolios through R&D and selective acquisitions, while cloud-native entrants lower entry barriers with subscription models that convert upfront investment into predictable operating expenses. As broadcasters integrate artificial intelligence for content analysis and automated quality assurance, demand rises for compute-dense appliances and virtualized microservices that can be orchestrated both on premises and in hyperscale clouds.
Key Report Takeaways
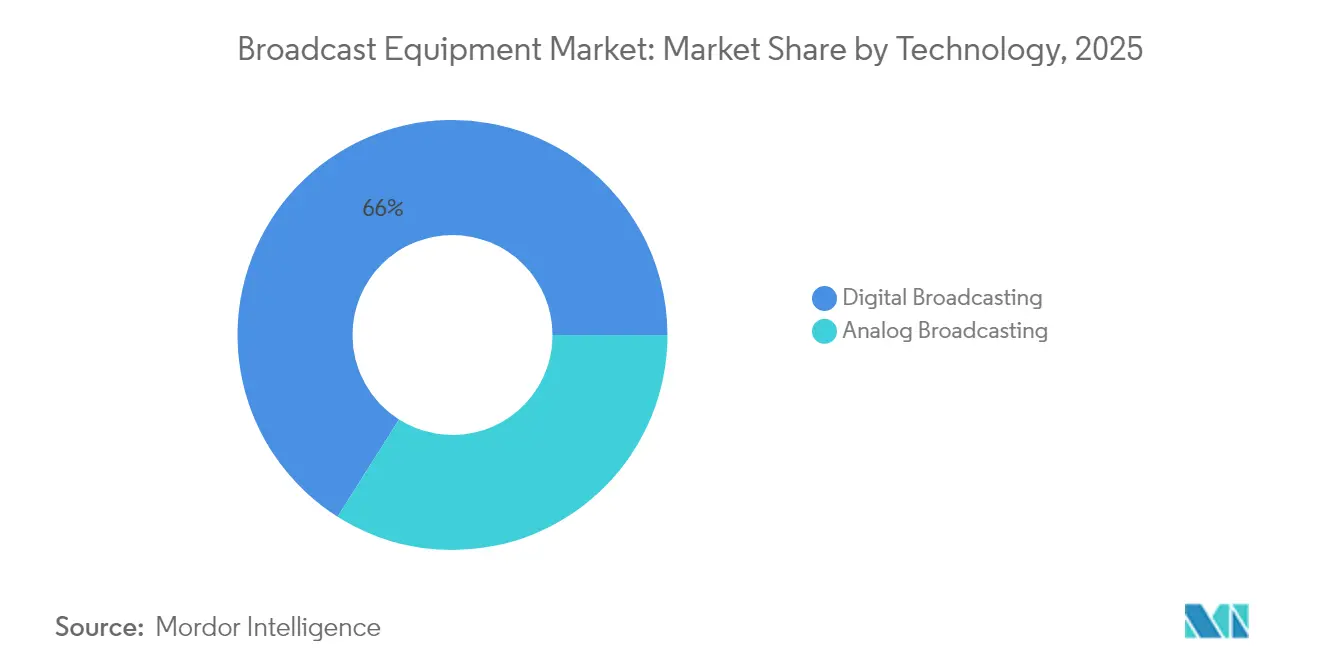
- By 2025, digital broadcasting had captured 66.02% of the broadcast equipment market share, and it is projected to grow at a 7.92% CAGR through 2031.
- By product, encoders held 24.42% of the broadcast equipment market share in 2025, and the segment is projected to grow at a 6.61% CAGR to 2031.
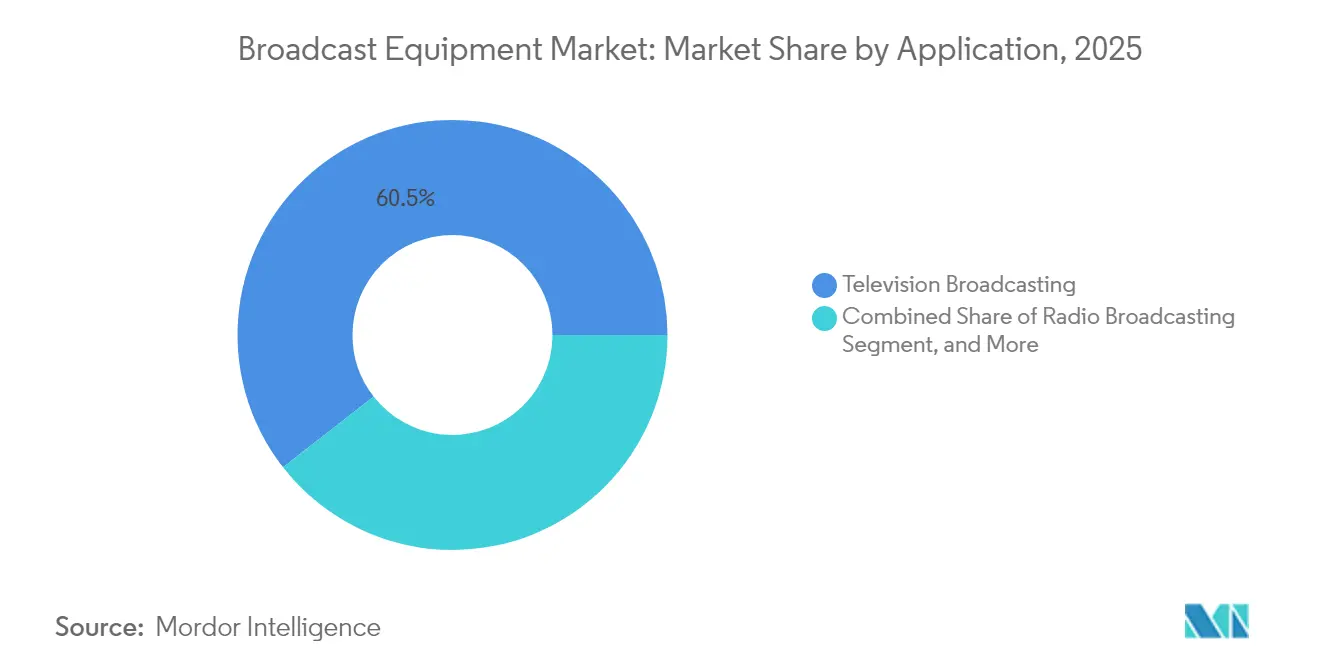
- By application, television broadcasting accounted for a 60.55% share of the broadcast equipment market size in 2025, whereas internet live streaming is advancing at a 7.18% CAGR.
- By end user, broadcasters commanded 53.12% of demand in 2025, while streaming service providers are projected to record the highest CAGR at 7.47% through 2031.
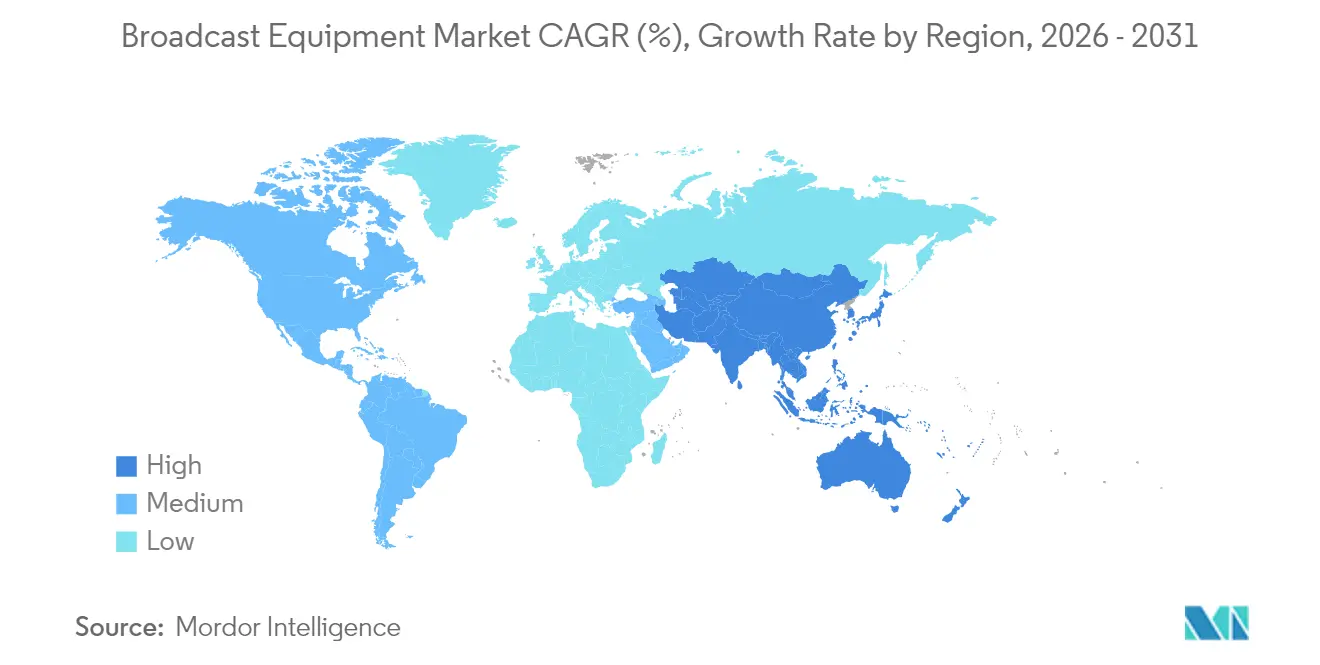
- By geography, North America led the broadcast equipment market with a 33.21% contribution in 2025, and the Asia-Pacific region is expected to be the fastest-growing at a 7.05% CAGR from 2025 to 2031.
Note: Market size and forecast figures in this report are generated using Mordor Intelligence’s proprietary estimation framework, updated with the latest available data and insights as of 2026.
Market Trends and Insights
Drivers Impact Analysis of Broadcast Equipment Market*
| Driver | (~) % Impact on CAGR Forecast | Geographic Relevance | Impact Timeline |
|---|---|---|---|
| Growing Demand for Encoders Supporting Multiple Codecs | +1.2% | Global-strongest in North America and Europe | Medium term (2-4 years) |
| Direct-To-Consumer OTT Expansion Accelerating Equipment Upgrades | +1.8% | Global-particularly Asia-Pacific and North America | Short term (≤ 2 years) |
| Rapid Transition to IP-Based Broadcasting Infrastructure | +1.5% | North America and Europe leading, Asia-Pacific following | Medium term (2-4 years) |
| Surge in Remote Production Workflows Post-Pandemic | +0.9% | Global-early adoption in North America and Europe | Short term (≤ 2 years) |
| Adoption of Cloud-Native SaaS Playout and Graphics | +0.8% | North America and Europe, expanding in Asia-Pacific | Medium term (2-4 years) |
| Government Mandates for Digital Switch-Over in Emerging Economies | +0.6% | Asia-Pacific, Middle East and Africa, South America | Long term (≥ 4 years) |
| Source: Mordor Intelligence | |||
Direct-To-Consumer OTT Expansion Accelerating Equipment Upgrades
Explosive subscriber growth at leading streaming services compels broadcasters to overhaul legacy plants so they can output pristine linear feeds and adaptive bitrate streams simultaneously. Netflix recorded 260 million global subscriptions in 2024, while Disney+ passed 150 million, prompting rights holders to demand delivery in HEVC for cable head-ends, AV1 for bandwidth-efficient streaming, and emerging VVC for 8K readiness.[1] Multi-codec encoders, therefore, replace single-purpose appliances, triggering a new purchase cycle across newsrooms, sports networks, and regional stations. In parallel, the surge in original content budgets fuels the uptake of IP-backhaul kits that support distributed remote production and cloud post-production, ensuring that studios can fast-track global releases without relying on heavy on-site crews.
Rapid Transition to IP-Based Broadcasting Infrastructure
With SMPTE ST 2110 reaching critical mass, 78% of broadcasters budgeted IP infrastructure projects for 2024, accelerating the sunset of SDI routers and patch panels.[2] Switching to commodity Ethernet fabrics slashes cabling complexity and reduces total cost of ownership as workflows migrate from dedicated baseband chains to software instances running on COTS servers. IP networks also simplify redundancy through seamless path protection, while native multicast enables operational scaling for pop-up channels or remote commentary positions. Crucially, IP backbones provide a direct bridge to public cloud services, enabling temporary compute bursts during marquee events without incurring permanent hardware costs, thereby further propelling the broadcast equipment market.
Growing Demand for Encoders Supporting Multiple Codecs
Eighty-five percent of facilities now require HEVC, H.264, and AV1 within the same encoder chassis to tailor content for legacy set-top boxes, smart TVs, and mobile streaming apps.[3] Vendors respond with AI-optimized compression engines that deliver up to 40% bitrate reductions, freeing capacity on congested contribution links. Field-upgradable firmware enables operators to load VVC modules ahead of major sports tournaments, ensuring forward compatibility and protecting their investment. As 8K trials expand in Japan and South Korea, the need for software-defined, multi-codec pipelines becomes increasingly critical, sustaining encoder revenue growth within the broadcast equipment market.
Surge in Remote Production Workflows Post-Pandemic
The shift from truck-centric outside broadcasts to REMI workflows is now structural: adoption has jumped 340% between 2020 and 2024, and leading sports networks have trimmed on-site crews by up to 70% while preserving the quality of multi-camera storytelling. Low-latency encoders, secure bonded cellular uplinks, and IP-native switchers enable directors, replay operators, and graphics artists to collaborate from centralized hubs. Financial benefits include reduced travel costs, higher staff utilization, and faster venue turnaround, while environmental targets gain from lower logistical footprints. Consequently, demand intensifies for scalable IP routers, robust timing networks, and cloud-based replay engines, strengthening prospects for vendors that deliver integrated REMI toolkits.
Restraints Impact Analysis of Broadcast Equipment Market*
| Restraint | (~) % Impact on CAGR Forecast | Geographic Relevance | Impact Timeline |
|---|---|---|---|
| Persistent Lack of Global Standardization of Media Formats | -0.8% | Global-especially in cross-border distribution | Long term (≥ 4 years) |
| High Capital Expenditure for UHD and 8K Transmission Gear | -1.1% | Global-more pronounced in emerging markets | Medium term (2-4 years) |
| Spectrum Allocation Constraints in Urban Regions | -0.5% | Urban areas worldwide-North America and Europe visible | Long term (≥ 4 years) |
| Skills Gap in Operating IP and Cloud Broadcast Systems | -0.7% | Global-acute shortages in emerging markets | Medium term (2-4 years) |
| Source: Mordor Intelligence | |||
High Capital Expenditure for UHD and 8K Transmission Gear
Transitioning from HD to UHD and then to 8K multiplies network data rates and processing overhead, pushing equipment prices up to 3-7 times those of HD counterparts. Smaller stations and emerging-market operators struggle to align their payback horizons with such steep outlays, creating a two-speed adoption pattern where marquee channels upgrade first and regional players lag. Limited financing options and fast depreciation cycles exacerbate budget pressures, delaying wider rollouts and restraining the broadcast equipment market’s full revenue potential.
Persistent Lack of Global Standardization of Media Formats
The International Telecommunication Union logged more than 40 active video compression standards in 2024, fragmenting workflows and forcing broadcasters to maintain costly transcoding farms. Divergent regional preferences—from DVB-T2 in Europe to ISDB-T in parts of Latin America—complicate the exchange of multinational content and hinder economies of scale for manufacturers. Until regulators and standards bodies converge on fewer baseline profiles, interoperability expenses will continue to weigh on purchasing decisions.
*Our forecasts treat driver/restraint impacts as directional, not additive. The impact forecasts reflect baseline growth, mix effects, and variable interactions.
Broadcast Equipment Market Segment Analysis
By Technology:
Digital Broadcasting Deepens Its HoldDigital platforms claimed 66.02% of 2025 revenue, and their 7.92% CAGR indicates relentless momentum as governments enforce analog switch-off deadlines. In parallel, many networks overlay IP fabrics on existing digital transmission, enabling self-provisioned contribution links and interactive services that drive advertising yield. The broadcast equipment market size for hybrid analog-digital solutions remains meaningful in rural pockets, yet sunset timetables narrow replacement windows, prompting brisk demand for combo transmitters that can be reconfigured through software updates.
Adoption also reflects the spectral efficiency of digital encoding, which allows multiplexing of secondary channels and data services within a single RF allocation. This agility fuels local language programming in the Asia-Pacific region and pop-up sports channels in Europe, expanding the addressable inventory for advertisers. Vendors that bundle spectrum-efficient modulators with IP-native monitoring dashboards secure repeat orders, reinforcing the primacy of digital technology within the broadcast equipment market.

By Product:
Encoders Anchor Multi-Platform WorkflowsEncoders generated 24.42% of 2025 turnover and maintain a 6.61% growth trajectory as every distribution path—terrestrial, satellite, cable, or OTT-depends on compression efficiency. AI-assisted algorithms now learn scene complexity and allocate bits adaptively, achieving 30-40% savings without picture degradation. These innovations lower CDN bills for streaming providers and free up transponder bandwidth for satellite operators, fueling a virtuous upgrade cycle that supports the broadcast equipment market's leadership share.
Video servers, switches, and transmitters remain indispensable, yet their design increasingly adopts modular, x86-based hardware wrapped in containerized software for modern broadcast infrastructure. As a result, customers focus on orchestration APIs and license flexibility rather than raw hardware specs. Dish antennas continue to serve remote contribution and disaster-recovery links, but growth lags IP terrestrial paths as 5G and fiber footprints widen. Vendors that package encoders with cloud transcoding and just-in-time packaging retain a competitive advantage across a converged broadcast equipment industry.
By Application:
Television Retains Volume but Streaming Sets the PaceTelevision broadcasting still delivered 60.55% of revenue in 2025, reflecting entrenched viewing habits and free-to-air mandates in many countries. Even so, internet live streaming’s 7.18% CAGR underscores shifting consumption toward mobile screens and connected TVs. Broadcasters address the overlap by simulcasting: linear content travels via ATSC 3.0 or DVB-T2 while synchronized OTT streams offer catch-up and personalization, demanding sophisticated origin servers and audience measurement tools.
Radio broadcasting remains crucial for local news and emergency alerts, especially in sparsely populated regions, but the incremental gains are modest. Satellite broadcasting secures specialized niches such as maritime broadband and in-flight entertainment, relying on high-power transponders and resilient uplink chains. Equipment manufacturers, therefore, refine converged playout engines that output SDI, IP, and satellite feeds concurrently, safeguarding investment as client priorities shift between traditional and streaming-first strategies in the broadcast equipment market.
By End User:
Streaming Providers Propel InnovationBroadcasters accounted for 53.12% of 2025 spending, while the fastest-rising budgets belonged to streaming service providers, with a 7.47% CAGR. These digital-native firms favor operational expenditure and microservices architectures, expecting elastic scale to millions of peak-time viewers without forklift upgrades. Consequently, vendors are pivoting toward SaaS modules for live channel origination, AI captioning, and ad insertion, bundled with consumption-based pricing to align with streaming revenue models.
Cable network operators modernize head-ends to mitigate cord-cutting, adding cloud DVR and IP gateways that ingest off-air signals and redistribute them as unicast streams. Production studios invest in virtual sets and cloud render farms to accelerate multi-platform content creation. Collectively, these shifts reward suppliers that deliver ultra-low-latency glass-to-glass chains and open APIs, reshaping competitive dynamics within the broader broadcast equipment industry.
Geography Analysis
North America Broadcast Equipment Market
North America led the broadcast equipment market with a 33.21% share in 2025 thanks to early IP adoption, NextGen TV incentives and heavy streaming investment. The Federal Communications Commission’s spectrum repack and ATSC 3.0 rollouts triggered facility rebuilds, while rights-holders poured capital into REMI studios supporting coast-to-coast sports coverage. Canada’s public-service mandates spurred procurements of multilingual captioning and rural transmitters, whereas Mexico’s completed analog switch-off supplied a final wave of transmitter orders.
Europe Broadcast Equipment Market
Europe ranks second, buoyed by cross-border initiatives from the European Broadcasting Union that promote standardization and shared infrastructure. Germany and the United Kingdom spearhead UHD workflows and IP hub-and-spoke production, and France underpins demand with public broadcasting upgrades tied to cultural preservation funds. Southern and Eastern markets continue replacing DVB-T with DVB-T2 and adding HEVC encoders for HD tier expansion, sustaining steady equipment refresh cycles.
APAC Broadcast Equipment Market
Asia-Pacific posts the fastest 7.05% CAGR as India’s nationwide digitization connects more than 200 million households and China’s 5G-based broadcast pilots showcase 8K and VR trials. Japan and South Korea retain technology leadership through immersive audio and 4K/8K satellite services, while Southeast Asian nations tap multilateral loans for infrastructure. Australia’s dispersed population drives demand for satellite uplinks and IP contribution to span vast geographies, rounding out regional growth drivers for the broadcast equipment market.
Regulatory Landscape
Broadcast equipment demand is shaped by spectrum administration, broadcast licensing rules, and expanding compliance obligations for connected and RF devices. In the United States, the Federal Communications Commission (FCC) adopted FCC 26-14 to update and remove outdated broadcast radio and television procedures across 47 CFR parts 1, 73, 74, and 76, with the rule updates taking effect on June 18, 2026. The FCC also released a Small Entity Compliance Guide in January 2026 tied to supply chain security rules (based on FCC 25-71 adopted in October 2025), which adds scrutiny to procurement for networked broadcast and contribution equipment.
In Europe, equipment placed on the market increasingly needs to align with cybersecurity requirements under the Radio Equipment Directive (Directive 2014/53/EU), where essential cybersecurity requirements became applicable for relevant radio equipment categories from August 2025, supported by harmonized standards such as EN 18031-1:2024. In the United Kingdom, Ofcom made the Wireless Telegraphy (Exemption) (Amendment) (No. 2) Regulations 2026 in May 2026, updating license-exempt conditions and technical requirements that affect wireless equipment used in production and contribution workflows. Broader service rules are also tightening for on-demand providers through Ofcom's Tier 1 Standards Code, which came into effect in April 2026.
Value Chain Analysis
The broadcast equipment value chain runs from component and semiconductor suppliers through original equipment manufacturers (OEMs) that build cameras, encoders, video servers, switches/routers, and transmitters, then to systems integrators and managed-service partners that design and deploy end-to-end plants for broadcasters, cable operators, streaming service providers, and production studios. Distribution-side partners, including satellite and terrestrial network operators plus CDNs and cloud platforms, increasingly influence specifications as workflows move from SDI-bound hardware to IP-based, software-defined, and cloud-native architectures that rely on COTS servers and virtualization layers.
Interoperability and standards alignment have become a practical choke point and a collaboration area inside the chain. The Linux Foundation, European Broadcasting Union (EBU), and North American Broadcasters Association (NABA) launched the Media eXchange Layer (MXL) open-source project in April 2025 to standardize real-time media exchange between virtualized functions in Dynamic Media Facilities, with support that includes BBC, CBC/Radio-Canada, Intel, AWS, and NVIDIA. On the transmission and reception side, vendor-to-test-house validation is increasingly used to reduce integration risk, illustrated by ENENSYS and AVATEQ completing an end-to-end DTV+ interoperability test in April 2025. Broadcasters are also partnering with research institutions (for example, Sinclair and IIT Bombay in November 2024) to advance ATSC 3.0 and broadcast-to-everything concepts that pull more IP and edge compute into the equipment value chain.
Competitive Landscape
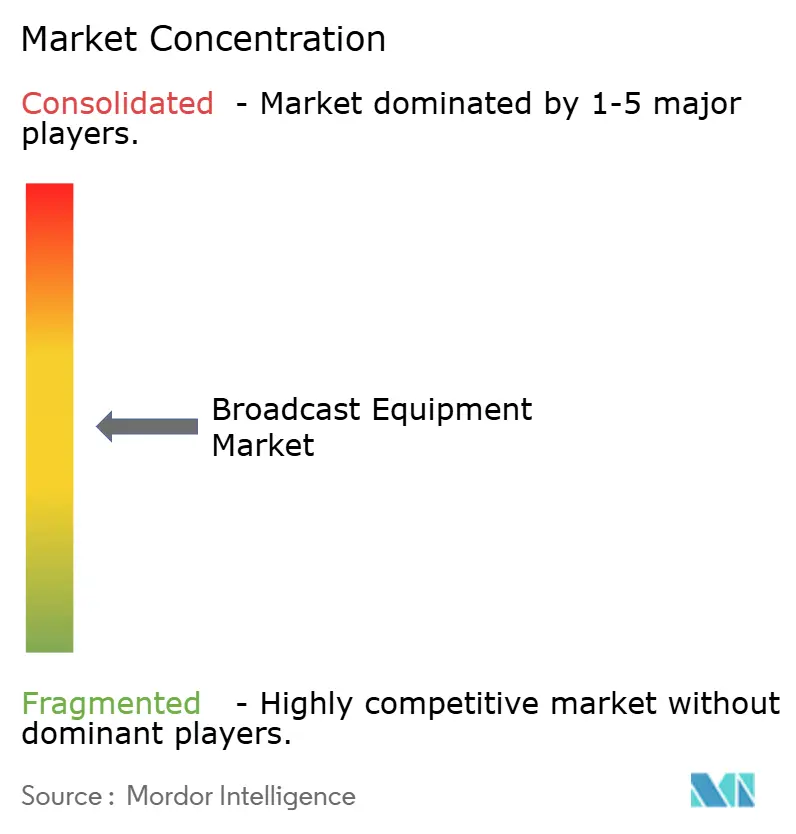
The broadcast equipment market remains moderately fragmented, with the top five vendors controlling roughly 45% of the revenue, leaving ample room for specialists. Cisco Systems leverages its network heritage to dominate IP routers and multicast controllers, while Sony Group utilizes its imaging prowess in cameras and switchers. Panasonic and Grass Valley compete with end-to-end 4K live production suites, while Harmonic strengthens compression leadership after acquiring Ateme’s video delivery division in July 2024.
Cloud-native challengers such as AWS Elemental and Amagi disrupt by offering channel playout and ad insertion on an opex model, appealing to streaming entrants that prefer usage-based billing. Incumbents respond by containerizing flagship applications, launching subscription tiers, and integrating orchestration APIs for multicloud deployment. Patent filings exceeded 200 in 2024, centered on AI-assisted compression and IP timing, affirming sustained innovation despite maturing hardware margins.
Strategic differentiation gravitates toward unified workflows, as clients seek single-vendor stacks that bundle ingest, processing, graphics, automation, and delivery analytics. Consequently, merger activity intensifies as firms acquire niche talent in cloud playout, edge streaming, or low-latency transport to bridge portfolio gaps. The narrative positions integrators that can harmonize on-premises SDI islands with public cloud microservices as front-runners in the evolving broadcast equipment market.
Broadcast Equipment Industry Leaders
-
Cisco Systems Inc.
-
Telefonaktiebolaget LM Ericsson
-
EVS Broadcast Equipment SA
-
Grass Valley USA LLC
-
Harmonic Inc.
- *Disclaimer: Major Players sorted in no particular order
Broadcast Equipment Market Companies Covered in this Report
- Cisco Systems Inc.
- Telefonaktiebolaget LM Ericsson
- EVS Broadcast Equipment SA
- Grass Valley USA LLC
- Harmonic Inc.
- Clyde Broadcast Technology Ltd
- Sencore Inc.
- Eletec Broadcast Telecom Sarl
- AVL Technologies Inc.
- ETL Systems Ltd
- Rohde and Schwarz GmbH and Co KG
- NEC Corporation
- Sony Group Corporation
- Panasonic Corporation
- Imagine Communications Corp.
- Avid Technology Inc.
- Belden Inc.
- Blackmagic Design Pty Ltd
- Ross Video Ltd.
- TVU Networks Corporation
- NewTek Inc.
Market Opportunities and Future Outlook
Open standards access and real-world IP modernization programs are creating whitespace for suppliers that can productize migration paths across hybrid SDI, ST 2110, and cloud-managed contribution. In June 2026, SMPTE made its standards catalog freely accessible, lowering friction for engineering teams adopting SMPTE ST 2110 and related workflows, and supporting demand for compliant switching, timing, monitoring, and orchestration. Large-scale deployments provide tangible buying signals: PBS began implementing a fully managed IP video network with LTN in June 2026 to connect more than 330 public television stations, with deployment continuing into end-2026. This expands the addressable need for IP gateways, secure transport, centralized monitoring, and integration services across a nationwide footprint.
Distribution and contribution are also shifting from satellite and bespoke links toward managed IP with modern transport protocols, which lifts demand for multi-codec encoders, secure low-latency transport, and software-defined processing. In April 2026, Globo transitioned primary distribution in Brazil to SRT over a managed IP backbone using Synamedia Quortex PowerVu and virtualized Digital Content Manager (vDCM). In March 2026, Reuters began a multi-year partnership with TVU Networks to migrate live news distribution from satellite to a cloud-managed IP model. Major event production is also validating high-capacity IP fabrics and COTS processing, highlighted by Host Broadcast Services (HBS) using a converged ST 2110 network with software-based processing on COTS servers for the 2026 FIFA World Cup, supporting near-term opportunities for vendors that bundle IP media fabrics, UHD/HDR-capable processing, and automated operations tooling for decentralized and remote production.
Recent Industry Developments in Broadcast Equipment Market
- April 2026: Grass Valley launched the ACE-3901 gateway card alongside AMPP OS updates aimed at unifying routing and signal processing across SDI and IP environments. The release strengthens migration toolkits for hybrid plants by reducing the need for forklift replacements while adding software-defined control and interoperability across mixed infrastructures.
- March 2026: Harmonic enhanced its XOS Advanced Media Processor with added support for Dolby Vision HDR and Dolby Atmos audio aligned with ATSC 3.0 workflows. This upgrade improves next-generation terrestrial distribution readiness and pushes higher-value processing features into densified, software-forward media processing stacks.
- September 2025: Grass Valley introduced a networking and infrastructure portfolio at IBC 2025 focused on resilient hybrid SDI and IP operations. The launch addressed modernization constraints for broadcasters maintaining SDI islands, while expanding options for phased adoption of IP-native routing and facility-wide orchestration.
Broadcast Equipment Market Report Scope and Research Methodology
Market Definition and Coverage
For this methodology, the broadcast equipment market covers the revenue generated from equipment used to create, process, transmit, and distribute broadcast signals for TV, radio, satellite, and internet-based live streaming across regions.
Scope exclusions: We exclude consumer devices and general IT hardware that are not purpose-built for broadcast signal acquisition, processing, contribution, or transmission.
Segments Covered in This Report
- By Technology
- Analog Broadcasting
- Digital Broadcasting
- By Product
- Dish Antennas
- Switches
- Video Servers
- Encoders
- Transmitters and Repeaters
- Other Products
- By Application
- Radio Broadcasting
- Television Broadcasting
- Internet Live Streaming
- Satellite Broadcasting
- By End User
- Broadcasters
- Cable Network Operators
- Streaming Service Providers
- Production Studios
- By Geography
- North America
- United States
- Canada
- Mexico
- Europe
- Germany
- United Kingdom
- France
- Russia
- Rest of Europe
- Asia-Pacific
- China
- Japan
- India
- South Korea
- Australia
- Rest of Asia-Pacific
- Middle East and Africa
- Middle East
- Saudi Arabia
- United Arab Emirates
- Rest of Middle East
- Africa
- South Africa
- Egypt
- Rest of Africa
- Middle East
- South America
- Brazil
- Argentina
- Rest of South America
- North America
Data Sources, Market Sizing, and Validation
Desk Research
Desk research was used to define the market boundary and collect reference data that could be checked year over year. We relied on public sources such as the International Telecommunication Union, the US Federal Communications Commission, the European Broadcasting Union, national communications regulators, and UN Comtrade trade statistics to understand spectrum rules, broadcaster counts, and the direction of equipment shipment signals.
To translate those reference signals into sizing inputs, we also reviewed company annual reports, investor presentations, product catalogs, and reputable press coverage on broadcast upgrades such as IP migration and UHD workflows. Where needed, we used paid subscriptions focused on company financials and intelligence, patent databases, and shipment-level import and export records to confirm product mix and timing of large upgrade cycles. These desk sources are not exhaustive, and we also used other public references to collect, validate, and clarify data points during the work.
Primary Interviews and Surveys
Primary interviews and short surveys were completed with a mix of broadcast equipment manufacturers, system integrators, broadcasters, and service providers, so we could verify demand patterns and pricing movement. We also used the same input to cross-check regional adoption for digital workflows and to validate assumptions on replacement cycles across TV, radio, satellite, and streaming use cases.
Distribution of primary research fieldwork respondents
| Company type | Respondent position | Region |
|---|---|---|
| Top tier: 31% | CXOs: 14% | APAC: 47% |
| Mid tier: 47% | Functional/Unit leaders: 28% | EMEA: 35% |
| Smaller Players: 22% | Managers: 58% | Americas: 18% |
Market-Sizing & Forecasting
Sizing starts with a top-down build, where broadcaster and platform counts, equipment refresh cycles, and regional technology shifts are used to reconstruct the demand pool, then spending is allocated to the relevant equipment categories. To keep totals realistic, we corroborate results with selective bottom-up checks such as sampled average selling prices multiplied by unit volumes for key items, and a supplier and channel roll-up for a short list of high-visibility product lines.
A few inputs repeatedly influenced the model, including active broadcast licenses and station counts, spectrum and digital migration timelines, installed base replacement rates for studio and field equipment, the pace of IP and cloud-enabled production adoption, and trade flows for broadcast-grade transmission and processing hardware. Forecasts were built using scenario analysis supported by a simple regression layer, where macro indicators and media infrastructure spend expectations were aligned with expert views collected in interviews. When bottom-up signals were missing for smaller product pockets, we used proxy ratios from similar equipment categories and then re-checked those estimates against the overall demand pool.
Data Validation & Update Cycle
Validation is done through several passes so gaps are caught early and corrected before numbers are finalized. We compare model outputs against independent signals such as trade statistics direction, reported capex commentary from public filings, and the timing of policy-driven migration programs, then investigate outliers until the variance can be explained.
Before sign-off, a second analyst reviews the work to stress-test assumptions, currency handling, and year alignment across regions. Reports are refreshed on an annual cycle, and interim updates are triggered when material events occur, including major regulatory changes or sharp pricing movement. Right before delivery, we run a final check so clients receive the latest updated view rather than an earlier snapshot.
Mordor Intelligence's Broadcast Equipment Market Size Measured Against Other Published Estimates
Published market sizes for broadcast equipment rarely match perfectly because each publisher draws the boundary differently and does not always use the same year, currency timing, or pricing logic. Differences also show up when one estimate leans more on stated company revenues, while another relies more on modeled demand from broadcasters and platforms.
Key gaps usually come from what gets counted as broadcast-grade equipment, how analog and digital gear is treated during replacement cycles, and whether adjacent media production tools are included in the same bucket. Base-year selection and the way ASP progression is applied also matter, because large broadcast upgrade cycles can be uneven by region and by application, which is why timing and validation checks can change the outcome.
Benchmark comparison
| Source | Market Size | Gaps in Research Methodology |
|---|---|---|
| Mordor Intelligence | USD 5.93 B (2026) | |
| Global Consultancy A | USD 5.35 B (2024) | Uses a different base year and forecast window, which shifts the timing of major upgrade cycles, and the scope details on what qualifies as broadcast-only hardware are less explicit in the public summary. |
| Industry Publisher B | USD 5.60 B (2024) | Product grouping is presented at a high level, so overlaps with adjacent production equipment can remain, and a slower stated growth track suggests different assumptions on replacement cycles and ASP changes. |
Trade-flow direction for broadcast-grade hardware and the cadence of digital migration programs are practical checks that keep Mordor Intelligence tied to a defined demand pool rather than a broad media equipment bucket. Overall, the spread in published values is largely explained by base-year choice, equipment boundary decisions, and how refresh cycles are translated into annual spending, which are items that can be reviewed and repeated with clear inputs.
Key Questions Answered in the Report
What is the current value of the broadcast equipment market?
The broadcast equipment market size reached USD 5.93 billion in 2026.
How fast is demand for broadcast equipment expected to grow?
The market is projected to expand at a 6.23% CAGR between 2026 and 2031.
Which technology segment leads sales?
Digital broadcasting equipment commands 66.02% of revenue and grows at 7.92% CAGR.
Why are encoders so critical for broadcasters?
Encoders enable multi-codec delivery for linear, OTT and emerging 8K streams, and they currently hold 24.42% of product revenue.
Which region is expanding the quickest?
Asia-Pacific is the fastest-growing geography with a 7.05% CAGR through 2031.
How are remote production trends shaping procurement?
REMI workflows lower on-site costs and drive demand for IP routers, low-latency encoders and cloud production tools.