
Brick Market Size and Share
Market Overview
| Study Period | 2020 - 2031 |
|---|---|
| Market Size (2026) | USD 1.78 Trillion |
| Market Size (2031) | USD 2.03 Trillion |
| Growth Rate (2026 - 2031) | 2.74 % |
| Fastest Growing Market | Asia Pacific |
| Largest Market | Asia-Pacific |
| Market Concentration | Low |
Major Players *Disclaimer: Major Players sorted in no particular order Image © Mordor Intelligence. Reuse requires attribution under CC BY 4.0. | |
Brick Market Analysis by Mordor Intelligence
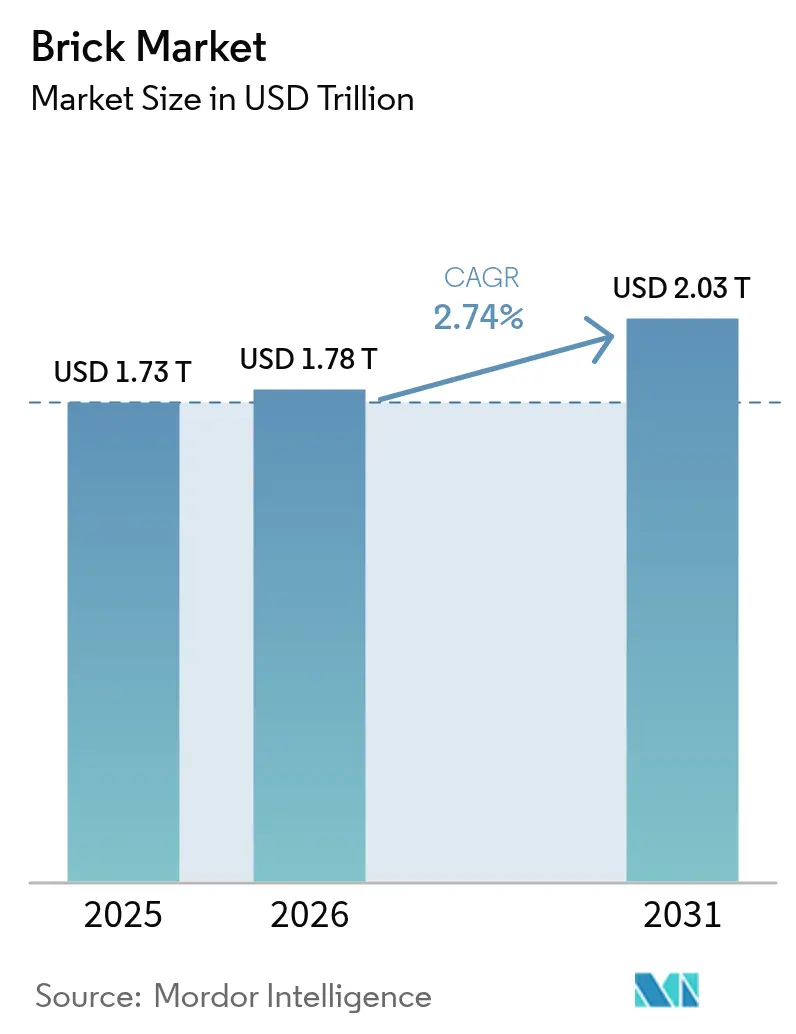
Brick Market size in 2026 is estimated at USD 1.78 trillion, growing from 2025 value of USD 1.73 trillion with 2031 projections showing USD 2.03 trillion, growing at 2.74% CAGR over 2026-2031. Asia-Pacific remains the anchor, supplying both the largest sales volumes and the strongest growth momentum as urban populations rise and infrastructure programs scale up. Product innovation focuses on low-carbon fly-ash and calcium-silicate variants in response to tightening climate rules, while direct project-based procurement accelerates as contractors seek fewer intermediaries. Demand from non-residential construction—especially warehouses, data centers, and transport hubs—outpaces residential activity, reflecting the expanding digital economy and public-works spending. Meanwhile, European producers face cost pressures from the Carbon Border Adjustment Mechanism, prompting early movers to invest in decarbonized kilns and alternative fuels.
Key Report Takeaways
- By brick type, clay bricks led with 64.35% of the brick market share in 2025, while fly-ash bricks posted the fastest 3.12% CAGR to 2031.
- By application, building accounted for 59.10% share of the brick market size in 2025; path applications are set to expand at 3.02% CAGR between 2026 and 2031.
- By end-use industry, residential buildings held a 54.40% share in 2025, whereas the non-residential segment is growing faster at 3.18% CAGR through 2031, driving demand in the brick market.
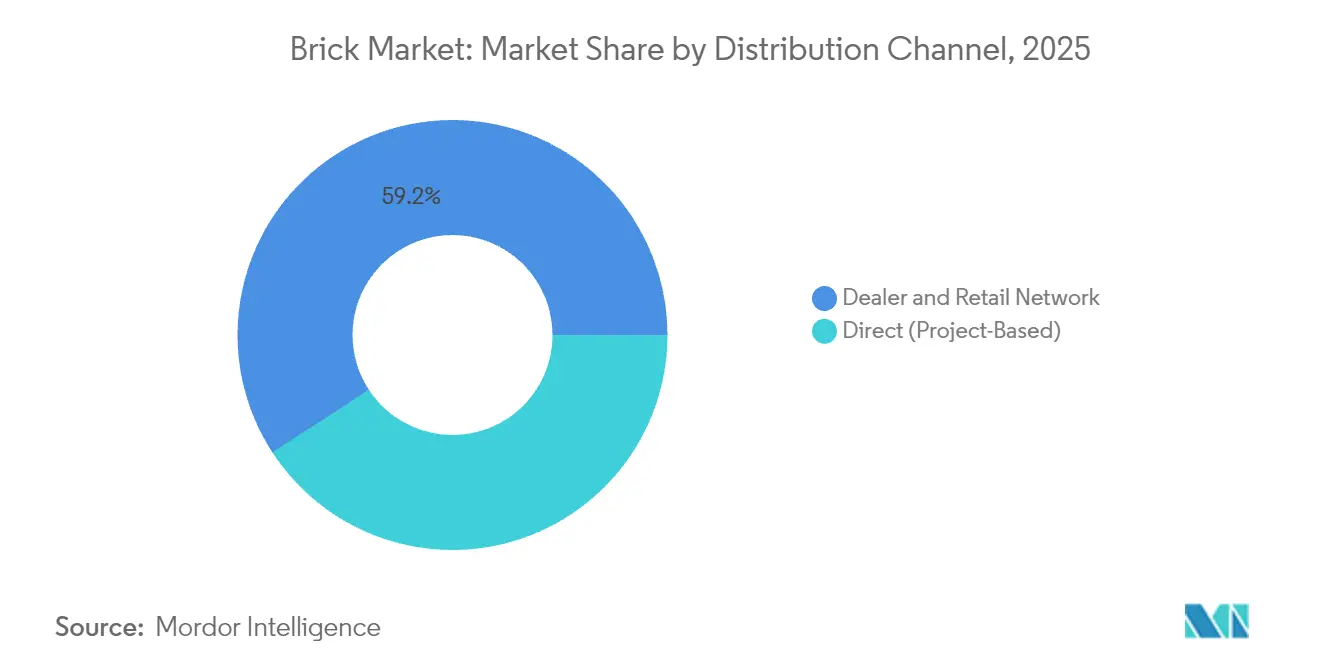
- By distribution channel, dealer & retail networks captured 59.20% of 2025 revenue in the brick market, while direct project-based channels register the highest 3.55% CAGR for 2026–2031.
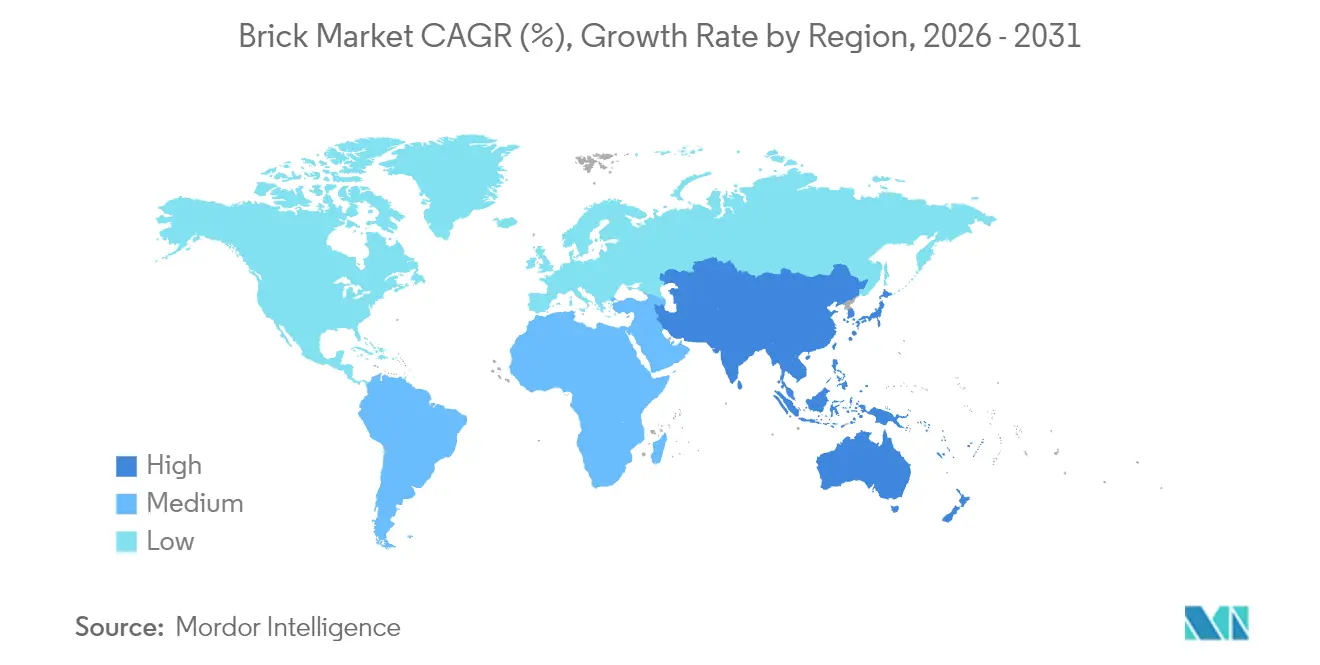
- By geography, Asia-Pacific held 47.30% revenue share of the brick market in 2025 and is advancing at a 3.30% CAGR through 2031.
Note: Market size and forecast figures in this report are generated using Mordor Intelligence’s proprietary estimation framework, updated with the latest available data and insights as of 2026.
Market Trends and Insights
Drivers Impact Analysis of Brick Market*
| Driver | (~) % Impact on CAGR Forecast | Geographic Relevance | Impact Timeline |
|---|---|---|---|
| Post-COVID Re-urbanisation Boosting Mid-Rise Housing Demand in Asia | +0.80% | Asia-Pacific, spillover to Africa | Medium term (2-4 years) |
| Green’ Building Codes Driving Fly-Ash and Calcium-Silicate Brick Uptake in Europe | +0.50% | Europe, North America | Long term (≥ 4 years) |
| Modular Construction Increases Demand for High-Strength Hollow Bricks | +0.40% | Global, strongest in developed markets | Medium term (2-4 years) |
| Government-Subsidised Low-Cost Housing in Sub-Saharan Africa | +0.70% | Sub-Saharan Africa, South Asia | Short term (≤ 2 years) |
| Expansion of E-Commerce Warehousing in South America | +0.30% | South America, Asia-Pacific | Short term (≤ 2 years) |
| Source: Mordor Intelligence | |||
Post-COVID Re-urbanisation Boost
Rapid migration back to major Asian cities is refilling pipelines for mid-rise housing projects, sustaining steady brick market demand. UN ESCAP projects the region’s urban population will touch 3.2 billion by 2030, spawning 22 megacities[1]. Mid-rise formats rely on masonry for cost-effective load-bearing walls and local labor familiarity. Governments are increasing social-housing budgets to narrow deficits—India alone recorded an 18.7-million-unit gap in 2024, while Indonesia tallied 12.5 million units, each amplifying baseline need for bricks. Vendors position supply hubs close to Tier-1 growth corridors to minimize freight costs. Equipment upgrades that raise kiln capacity without higher fuel burn ensure contractors receive on-time deliveries during cyclical building surges.
‘Green’ Building Codes
Europe’s 90% emissions-cut target for 2040 is reshaping the brick market, accelerating the adoption of fly-ash and calcium-silicate bricks with smaller carbon footprints. Calcium-silicate units consume 241 kWh/t of primary energy versus higher values for traditional clay, appealing to designers seeking certification under the UK Net Zero Carbon Buildings Standard. Concrete bricks that bypass firing processes can save 2.4 tonnes of CO₂ per house and become net absorbers over their lifecycle. Public-sector projects now embed minimum recycled-material thresholds, pushing plants to integrate glass cullet and combusted solid waste into mixes. Manufacturers that verify cradle-to-site life-cycle data lock in specification advantage for renovation and public procurement tenders.
Modular Construction
Off-site prefabrication is scaling, compressing project timelines by 30–50% and cutting labor outlays by up to 80%. Modular builders require lightweight, high-strength hollow bricks that integrate with panelized frames. Porotherm clay units deliver superior thermal insulation in Australian pilots, matching structural codes while lowering embodied energy. Digital design tools such as BIM and real-time sensor feedback help optimize dimensions, enabling near-zero off-cuts on-site. Heidelberg Materials reports AI-guided batching systems that trim cement use by 20%, a benefit passed along to the brick industry dedicated to modular packages.
Government-Subsidised Housing
Sub-Saharan initiatives are catalysts for the brick market as authorities aim to solve acute shelter shortages. Kenya targets 250,000 units annually to reduce its 2 million-home deficit. Zimbabwe has scheduled 220,000 dwellings by 2025, while Nigeria estimates a 28 million-home shortfall needing USD 46.7 billion investment. Builders favor locally sourced masonry that withstands hot climates and cuts import bills. 3D-printed schemes such as Mvule Gardens in Kenya demonstrate how fly-ash-based mortars can accelerate production; each two-bedroom shell is printed in 18 hours. Such proof points embed brick alternatives into subsidy frameworks, widening material uptake.
Restraints Impact Analysis of Brick Market*
| Restraint | (~) % Impact on CAGR Forecast | Geographic Relevance | Impact Timeline |
|---|---|---|---|
| Increasing Trends of Prefabricated Construction Components | -0.60% | North America, Europe, Australia | Medium term (2-4 years) |
| Volatility in Clay Feedstock Prices in Asia | -0.30% | Asia-Pacific | Short term (≤ 2 years) |
| Carbon-Tax Exposure for Energy-Intensive Kilns in Europe | -0.50% | Europe | Long term (≥ 4 years) |
| Source: Mordor Intelligence | |||
Prefabricated Construction Components
As labor shortages intensify, builders in North America and Europe pivot toward volumetric modules that sideline brick facades. Prefab solutions remove 30-50% of on-site time and lower labor costs by 50-80%. With the United States needing another 501,000 skilled workers in 2025, contractors view standard panels as risk hedges. Thin-brick slips and mechanically fixed veneers let masonry suppliers stay relevant, yet overall unit demand dips where full-bed bricks are displaced. Manufacturers invest in robotic laying lines to service hybrid wall panels but must amortize capital across a shrinking traditional volume base, squeezing margins.
Carbon-Tax Exposure
European makers in the brick industry confront escalating compliance costs as the EU Emissions Trading System expands and the Carbon Border Adjustment Mechanism phases in during 2026–2030. Producers shifting to biomethane or hydrogen reduce Scope 1 emissions but face high retrofit bills and uncertain fuel supply. Importers from low-carbon grids could gain footholds if domestic players lag, restructuring competitive hierarchies. Firms adopting regenerative burners and heat-recovery on dryers already claim 15% lower energy intensity, cushioning levy increases.
*Our forecasts treat driver/restraint impacts as directional, not additive. The impact forecasts reflect baseline growth, mix effects, and variable interactions.
Brick Market Segment Analysis
By Brick Type:
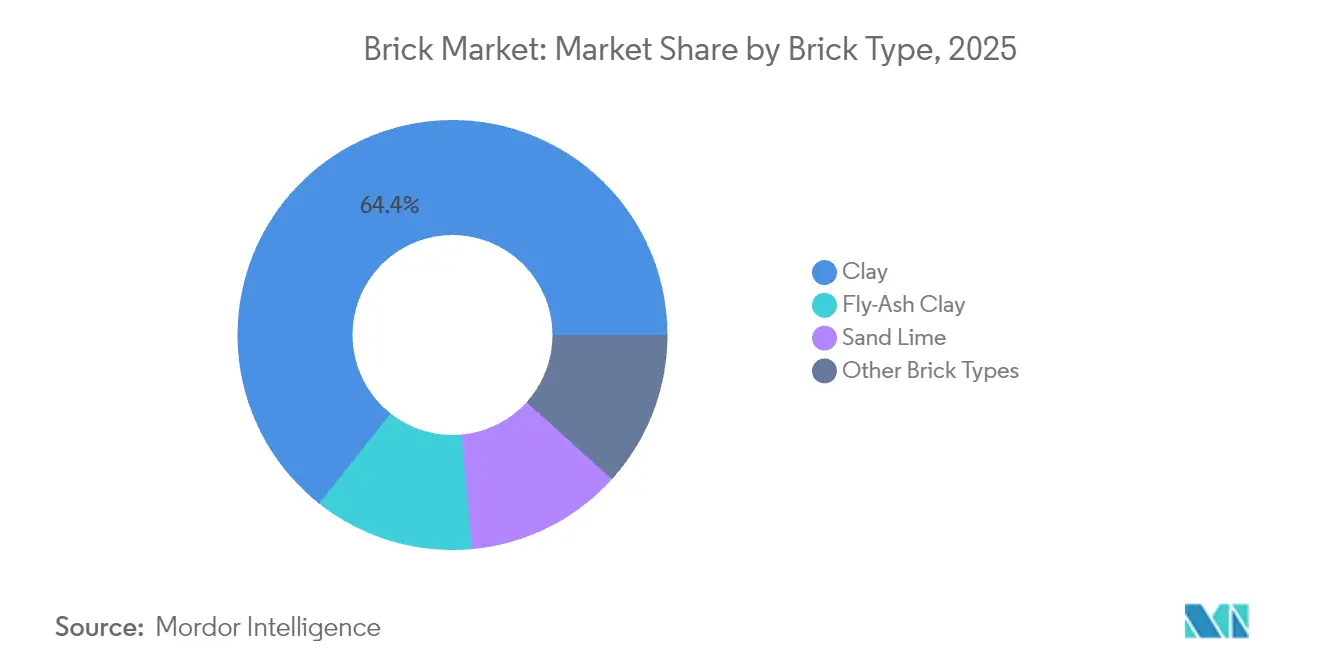
Sustainability Drives Material ChoiceClay bricks dominated the brick market with 64.35% of revenue in 2025, yet fly-ash bricks record a 3.12% CAGR through 2031, widening their presence in regions tightening carbon rules. This shift is anchored in industrial-waste utilization, enabling plants to cut firing temperatures by 20% and align with circular-economy mandates. The brick market size for fly-ash variants is forecast to expand faster than any other type, helped by public procurement criteria that reward recycled content. Calcium-silicate units attract architects pursuing thermal-mass advantages in Europe’s cool climates, while concrete blocks that skip kiln firing appeal where electricity is available and fuel security is uncertain.
Technological advances include char-based thin bricks exhibiting 4-7% water absorption, outperforming commercial peers and costing USD 25.83 per sq m, less than half the prevailing price for traditional options. Makers also promote hollow configurations that cut embodied CO₂ and lighten logistics loads. Collectively, these innovations reinforce the brick market goal of decarbonization without sacrificing structural reliability. Only a handful of early adopters own patents, hinting at near-term licensing revenue streams that could reshape profit pools within the brick industry.

By Application:
Core Building Uses Retain PrimacyBuilding applications accounted for 59.10% of brick market share in 2025, reflecting masonry’s historic role in structural walls and facades. Code updates promoting airtight envelopes and fire resistance sustain this core demand. The brick market size for path and paving solutions, however, is expanding at a 3.02% CAGR as households invest in outdoor upgrades and municipalities retrofit sidewalks to endure heavier pedestrian flows.
Manufacturers in the brick industry exploit colorfast clays and high-friction textures to serve landscaping customers seeking design variety with low maintenance. Bricks configured with interlocking edges accelerate installation, lowering contractor costs and aligning with quick-turn renovation schedules. Parterre and decorative garden formats resurface in premium estates where aesthetic differentiation commands higher margins. Industrial customers favor acid-resistant bricks for furnace linings and chemical-processing pits, reinforcing a diverse end-use spread that shelters producers from single-sector downturns.
By End-Use Industry:
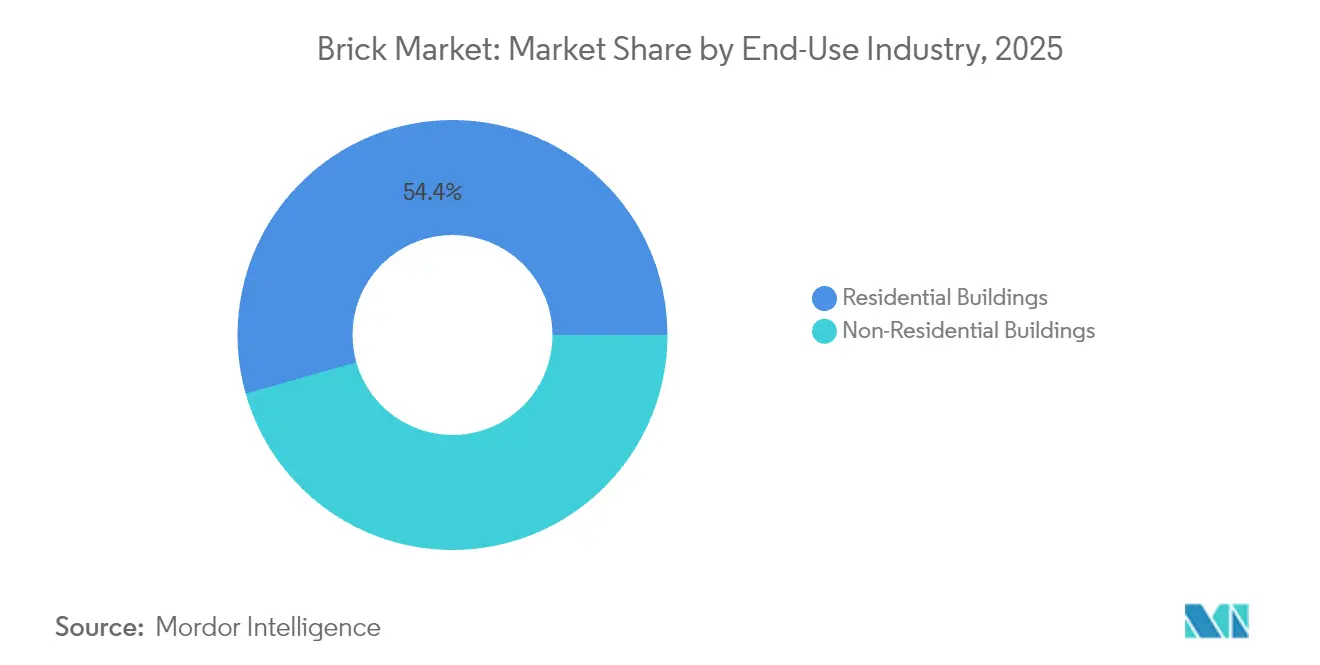
Infrastructure Shapes Growth ProfileResidential buildings retained a 54.40% revenue position in 2025, yet the non-residential segment leads growth at 3.18% CAGR as governments fund transport corridors and e-commerce firms extend distribution hubs. The brick market supports massive warehouse floors that demand durable, thermally stable walls to moderate interior climates in tropical South America. Data centers classified as critical infrastructure in the United States also elevate orders for fire-rated brick envelopes.
In housing, rising mortgage rates in 2024 curtailed starts, but planned cuts from 2025 reinvigorate single-family construction, particularly in North America. Regulatory pushes for net-zero dwellings incentivize wall systems that retain heat and lower operational energy. Brick veneers matched with external-insulation finishing systems satisfy these performance metrics while preserving traditional curb appeal. Public-sector rental programs in Europe and Asia formalize quotas for low-carbon bricks, cushioning residential volume dips elsewhere.
By Distribution Channel:
Direct Project Path Gains TractionDealer and retail outlets captured 59.20% of brick market revenue in 2025 thanks to entrenched suburban dealer networks and DIY refurbishment demand. Yet direct project-based distribution is the fastest lane, expanding 3.55% annually as contractors integrate procurement with scheduling software. Major U.S. roofing distributor SRS was acquired by The Home Depot for USD 18.25 billion, underscoring consolidation that favors high-volume direct buys.
Digital portals such as Beacon PRO+ let site managers place repeat orders and track deliveries, improving inventory accuracy and cash-flow planning. Artificial-intelligence tools route trucks to mitigate driver shortages and cut fuel burn, further reducing landed costs. Dealers respond by specializing in colored or antique-finish bricks with value-added design services, protecting margins even as high-rise contractors bypass intermediaries. Market participants expect hybrid models where manufacturers run direct key-account teams while maintaining dealer partners for patchwork residential demand.
Geography Analysis
APAC Brick Market
Asia-Pacific generated 47.30% of 2025 global sales and is projected to grow 3.30% annually to 2031, buoyed by record urban migration and transport megaprojects. China and India spearhead masonry consumption as public-sector housing pushes converge with subway, airport, and industrial-park builds. Producers deploy tunnel kilns with waste-heat recovery to meet provincial emission caps and reduce coal dependence, safeguarding supply resiliency during demand spikes.
North America Brick Market
North America is experiencing growth in market value, driven by pending interest-rate cuts that are unlocking stalled projects. The AIA Consensus Construction Forecast sees non-residential spending rising 2.2% in 2025 and 2.6% in 2026 after a strong 2023-2024 run. Fly-ash bricks gain traction among designers chasing LEED points, while thin-brick panels speed up urban multifamily builds. Canada’s colder climate sustains demand for high-thermal-mass clay units in residential retrofits to cut heating loads.
Europe Brick Market
Europe trails in growth but leads innovation as the CBAM exposes carbon-intensive imports and rewards local low-carbon pioneers. The continent imported over 500 million bricks in 2022, generating 288,190 tonnes of CO₂, prompting calls for onshoring greener capacity. Scandinavia’s public-procurement policies stipulate embodied-carbon ceilings, channeling orders toward calcium-silicate or unfired concrete bricks. Eastern Europe builds capacity to serve domestic and German markets facing material tightness.
South America and MEA Brick Market
South America’s brick market pivots on warehouse and logistics developments catalyzed by e-commerce. Brazil accelerates industrial parks along new highways, increasing demand for large-format blocks that reduce lay-rate time. Material suppliers invest in local plants to sidestep currency volatility and import duties. Middle East and Africa, although smaller today, hold the loftiest upside as 70% of buildings required by 2040 are yet to be built. Kenya, Nigeria and Egypt roll out public-private partnerships to deliver affordable homes, embedding brick procurement targets into tender documents to stimulate domestic manufacturing.
Value Chain Analysis
The brick value chain begins with raw-material sourcing and preparation, mainly clay and shale for fired bricks, sand and lime for calcium-silicate units, and fly ash plus binders for fly-ash bricks. Upstream constraints center on feedstock variability (for example, clay quality swings and fly-ash availability as power-generation mixes change) and energy inputs for drying and firing, which raise delivered cost sensitivity to fuel and electricity. The 2024 completion of Forterra's Desford facility in the UK, positioned as Europe's largest brick plant, illustrates a major capacity expansion that shifts regional supply dynamics and enables higher-volume extrusion and panelization workflows. Manufacturing spans shaping (extrusion/pressing), controlled drying, and kiln firing for clay bricks, while alternative routes include autoclaving for calcium-silicate bricks and curing for unfired or low-fired variants; plant investments in waste-heat recovery, regenerative burners, and automation are increasingly used to stabilize output quality and energy intensity.
Downstream, distribution runs through a mix of dealer and retail networks that serve fragmented residential and small contractor demand and direct project-based supply to large contractors for warehouses, transport hubs, and other non-residential jobs. Direct procurement growth increases the importance of reliable lead times, jobsite logistics, and consistent lot-to-lot performance (color, dimensions, and strength), making local plant footprint and last-mile trucking capacity important differentiators. As contractors consolidate purchasing and track deliveries digitally, manufacturers and large distributors are aligning toward key-account selling, replenishment planning, and more standardized packaging/palletization to reduce breakage and jobsite handling losses.
Competitive Landscape
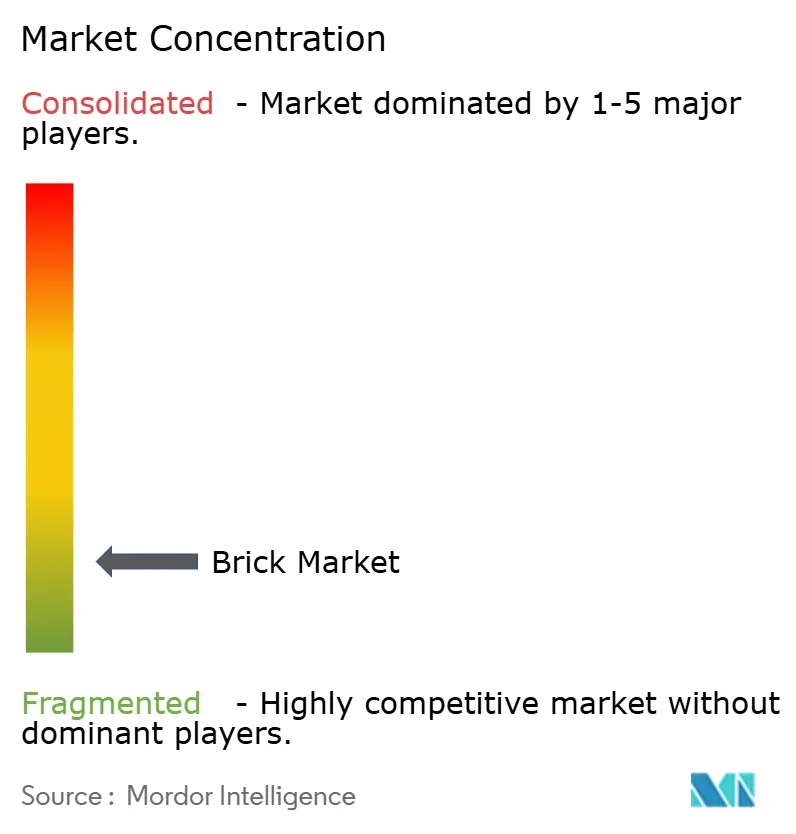
The brick market exhibits highly fragmented concentration at the global level. Wienerberger AG, Acme Brick Company, and Brickworks Ltd headline large-scale rivals, collectively leveraging broad portfolios and high-throughput kilns. Wienerberger posted EUR 2,213 million in H1 2024 revenue, up year on year, and broadened its roofing platform via the Terreal acquisition[3].
Strategic moves center on decarbonization, automation, and portfolio balance. Heidelberg Materials applies AI to real-time kiln monitoring, claiming 20% cement-use reductions extendable to masonry units. Oldcastle APG bought Master Block in January 2025 to shore up supply in high-growth Arizona. Forterra’s completion of Europe’s largest brick plant at Desford raises UK capacity and embeds advanced slip-extrusion lines for panelization compatibility.
Niche disruptors spotlight recycled textile or bio-based feedstocks that lower embodied emissions while matching compressive strength standards. Intellectual-property ownership in char-based thin bricks and 3D-printable fly-ash mortar positions start-ups for licensing or joint ventures with incumbents needing rapid ESG upgrades. Consolidators pursue bolt-on buys of regional paver or block makers to secure channel access and reduce last-mile costs, signaling an era of value-chain integration ahead.
Brick Industry Leaders
-
Acme Brick Company
-
Wienerberger AG
-
Brickworks
-
Ibstock Plc.
-
Triangle Brick Co.
- *Disclaimer: Major Players sorted in no particular order
Brick Market Companies Covered in this Report
- Acme Brick Company
- BigBloc Construction Ltd.
- Bowerston Shale
- Brampton Brick
- Brickworks
- Brickworks
- Cemex SAB de CV
- Columbia Brick Inc.
- Forterra Building Products Ltd
- General Shale Inc.
- Glen-Gery Corporation
- HEBRON BRICK
- Ibstock Plc.
- LEE Building Products
- Lignacite Ltd
- Oldcastle APG
- Palmetto Brick Company
- Supreme Concrete
- Triangle Brick Co.
- Wienerberger AG
- Xella International
Market Opportunities and Future Outlook
Decarbonization requirements and carbon-cost exposure are creating whitespace for low-carbon brick chemistries and manufacturing upgrades that cut firing energy or avoid firing altogether. Within bricks, this supports wider adoption of fly-ash and calcium-silicate variants and accelerates demand for verified environmental documentation that helps products win public procurement and green building specifications. In Europe, the Carbon Border Adjustment Mechanism phase-in during 2026-2030 reinforces attention on embodied-carbon performance, pushing producers and importers to rework mixes, fuels, and kiln efficiency to maintain competitiveness.
Channel and end-use shifts also open opportunities around direct project-based supply, especially for fast-growing non-residential uses such as warehouses and data centers that place a premium on delivery reliability, fire-rated envelopes, and repeatable quality across multi-site rollouts. The 2024 completion of Forterra's Desford facility (positioned as Europe's largest brick plant) illustrates how capacity additions powered by advanced extrusion lines can support panelization and brick-slip formats used in faster-build systems, helping brick producers participate in modular and hybrid wall assemblies even where full-bed brick volume faces substitution pressure from prefabricated components.
Recent Industry Developments in Brick Market
- July 2026: Saint-Gobain entered a definitive agreement to acquire Xypex Chemical Corp., a Canadian specialist in crystalline waterproofing admixtures. The move expands Saint-Gobain's portfolio in high-value performance additives that support durability and moisture resistance in masonry and concrete systems. It also deepens the group's construction-chemicals reach into adjacent building-envelope solutions that influence brick and block specification.
- May 2026: Wienerberger AG signed an agreement to acquire Serbia-based Univerzum Group, which operates two clay block production sites in Arandjelovac and Indjija. The deal strengthens Wienerberger's regional manufacturing footprint and positions it closer to local construction demand with shorter transport routes. Added capacity in Central and Southeast Europe supports service levels for project customers while navigating evolving carbon-cost and energy constraints.
- November 2024: Wienerberger started operations described as Europe's greenest brick production, highlighting investment in lower-carbon manufacturing. The step underlines how major producers are aligning new or upgraded facilities with stricter emissions expectations and embodied-carbon requirements. It also raises the competitive bar for smaller plants that rely on older kiln technology and higher-carbon fuel mixes.
Brick Market Report Scope and Research Methodology
Market Definition and Coverage
For this methodology, the brick market is defined as the value of bricks sold for construction and related uses, counted at the point where the product is supplied into a project or through a dealer and retail network.
Scope exclusions: We exclude adjacent walling materials that are not sold as bricks and we do not count onsite masonry labor or broader construction spending.
Segments Covered in This Report
- By Brick Type
- Clay
- Sand Lime
- Fly-Ash Clay
- Other Brick Types
- By Application
- Building
- Path
- Parterre
- Other Applications
- By End-Use Industry
- Residential Buildings
- Non-Residential Buildings
- By Distribution Channel
- Direct (Project-Based)
- Dealer and Retail Network
- By Geography
- Asia-Pacific
- China
- India
- Japan
- South Korea
- Rest of Asia-Pacific
- North America
- United States
- Canada
- Mexico
- Europe
- Germany
- United Kingdom
- France
- Italy
- Rest of Europe
- South America
- Brazil
- Argentina
- Rest of South America
- Middle East and Africa
- Saudi Arabia
- South Africa
- Rest of Middle East and Africa
- Asia-Pacific
Data Sources, Market Sizing, and Validation
Desk Research
Desk work started with public production and construction signals so the model has a stable base before assumptions are added. Common references included USGS minerals statistics, UN Comtrade trade flows, the World Bank macro series, and national statistics offices that publish housing starts and building output.
We also reviewed building code and energy efficiency updates where available, since firing fuels and compliance rules can change costs and kiln-level investment timing. Company annual reports, investor presentations, and credible press helped confirm capacity additions, kiln technology shifts, and regional demand tone. In a few places, we used paid subscriptions for company financials and intelligence, news and financials, an import export shipment-level database, and patent databases to cross-check the direction of change. The desk sources listed here are illustrative only, and other public sources were also used for data collection, validation, and research clarification.
Primary Interviews and Surveys
Primary inputs came from interviews and surveys with brick producers, distributors, contractors, and procurement teams that regularly buy bricks for residential and non-residential projects. For a global study, we spread outreach across APAC, EMEA, and the Americas so pricing movements, demand seasonality, and trade exposure could be checked, and then we re-tested assumptions when responses pointed to large regional differences.
Distribution of primary research fieldwork respondents
| Company type | Respondent position | Region |
|---|---|---|
| Top tier: 34% | CXOs: 16% | APAC: 42% |
| Mid tier: 49% | Functional/Unit leaders: 25% | EMEA: 36% |
| Smaller Players: 17% | Managers: 59% | Americas: 22% |
Market-Sizing & Forecasting
Sizing was built using a top-down approach where construction activity and brick intensity factors were used to reconstruct demand by region, followed by value conversion using region-appropriate average selling prices. Because the same square meter of wall can be built with different brick formats, we adjusted intensity using practical fingerprints such as housing completions, non-residential floor area trends, infrastructure and paving activity where bricks are used, and the split between direct project supply and dealer and retail network flows.
To keep the totals grounded, we corroborated results with selective bottom-up approximations, such as rolling up sampled producer revenues where disclosed, combining capacity and utilization signals for major producing clusters, and using ASP times volume checks from distributor feedback. When bottom-up information was missing for smaller local producers, we handled gaps through region-level production and trade balancing, then normalized with interview feedback on informal supply share.
For forecasting, we used scenario analysis supported by trend lines on construction output, housing pipeline, and energy cost expectations that influence kiln economics and pricing. The final forecast was accepted only after assumptions on brick type mix, fuel cost passthrough, and regional price progression aligned with what practitioners described for contracting cycles.
Data Validation & Update Cycle
Validation is done through repeated cross-checks across the model, the supporting indicators, and what market participants say is happening on the ground. If a region shows a sudden jump in value without a matching signal in construction activity, trade, or price movement, we revisit inputs and then explain or correct the outlier before sign-off.
A second analyst reviews key steps, including unit conversions, currency treatment, and year alignment, and then checks the logic again at segment totals so nothing is double counted. Reports are refreshed annually, and interim updates are triggered when material events occur, such as major regulatory changes, energy price shocks, or large capacity shifts. Before delivery, we do a fresh pass so clients receive the latest updated view.
Mordor Intelligence's Brick Market Size Measured Against Other Published Estimates
Published brick market numbers often do not match because each publisher makes different choices on what is being counted and where the sale is captured in the value chain. Differences also come from the year used as the starting point, the way average selling prices are progressed, and how quickly assumptions get refreshed after construction and energy shifts.
Some published figures bundle bricks with a wider set of concrete blocks and AAC products, and that broader grouping can move the total in either direction depending on what is strong in a given year. In Mordor Intelligence, the estimate is kept to bricks sold across defined brick types and applications, and it is not mixed with the wider concrete block and AAC manufacturing basket, which is a key reason the spread exists.
Benchmark comparison
| Source | Market Size | Gaps in Research Methodology |
|---|---|---|
| Mordor Intelligence | USD 1.78 T (2026) | |
| Industry Publisher A | USD 1.79 T (2025) | Uses a different base year and can apply a broader application map that includes landscaping and infrastructure brick uses more explicitly, which can shift volumes and the implied ASP path between years. |
| Global Consultancy B | USD 448.03 B (2025) | Tracks concrete block and brick manufacturing together and also includes AAC blocks, which changes the product mix, the pricing basis, and the comparability versus a bricks-only demand pool. |
The table shows that year selection and product scope are the two biggest levers behind the differences, and they also influence how price and volume are projected forward. By tying the model to construction activity indicators and then re-checking totals through channel and producer reality checks, we keep the final number traceable to a clear demand pool and repeatable steps that can be reviewed and updated.
Key Questions Answered in the Report
What is the current value of the brick market?
The brick market is valued at USD 1.78 trillion in 2026 and is forecast to reach USD 2.03 trillion by 2031.
Which region contributes the most to brick sales?
Asia-Pacific leads with 47.30% of global revenue in 2025 and records the fastest 3.30% CAGR through 2031.
Why are fly-ash bricks gaining popularity?
Fly-ash bricks utilize industrial waste and cut firing energy, aligning with green-building codes and helping meet aggressive emissions-reduction targets.
How is modular construction affecting brick demand?
Modular construction favors lightweight hollow bricks designed for prefabricated panels, supporting new demand even as it reduces traditional site-laid volumes.
What is the biggest restraint for European brick producers?
Carbon-tax exposure from the EU ETS and the Carbon Border Adjustment Mechanism raises production costs, pushing firms to adopt low-carbon fuels and efficient kilns.
Which distribution channel is growing fastest for bricks?
Direct project-based procurement is rising at 3.55% CAGR as contractors consolidate orders and rely on digital supply-chain platforms for timely deliveries.