
Market Overview
| Study Period | 2020 - 2031 |
|---|---|
| Forecast Data Period | 2026 - 2031 |
| Base Year Market Size (2025) | USD 2.08 Billion |
| Market Size (2026) | USD 2.45 Billion |
| Market Size (2031) | USD 5.61 Billion |
| Growth Rate (2026 - 2031) | 18.01 % |
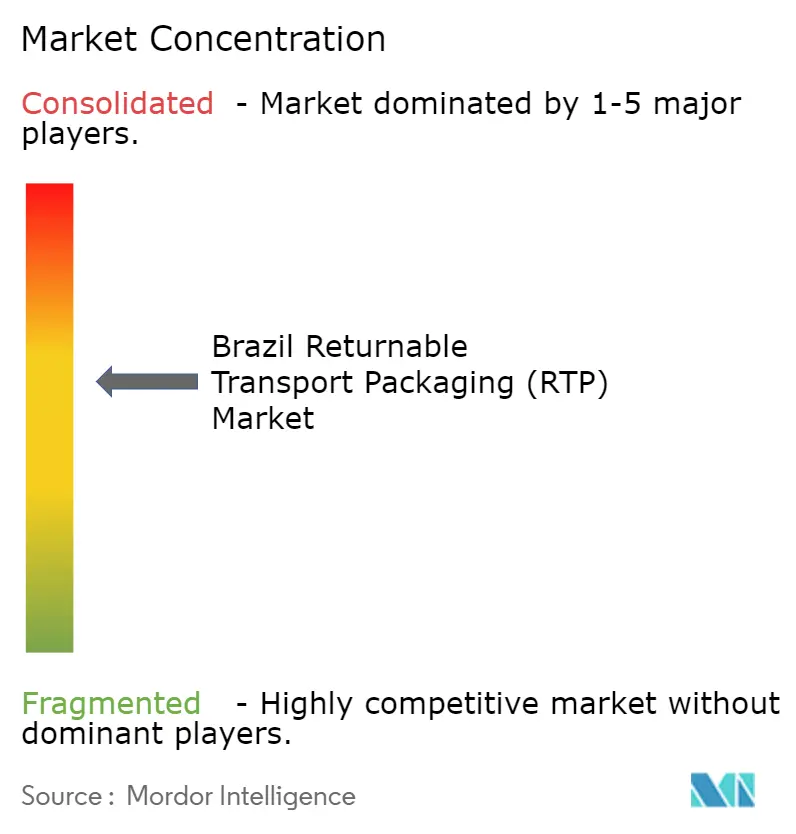
| Market Concentration | Medium |
Major Players *Disclaimer: Major Players sorted in no particular order Image © Mordor Intelligence. Reuse requires attribution under CC BY 4.0. | |
Brazil Returnable Transport Packaging (RTP) Market Analysis by Mordor Intelligence
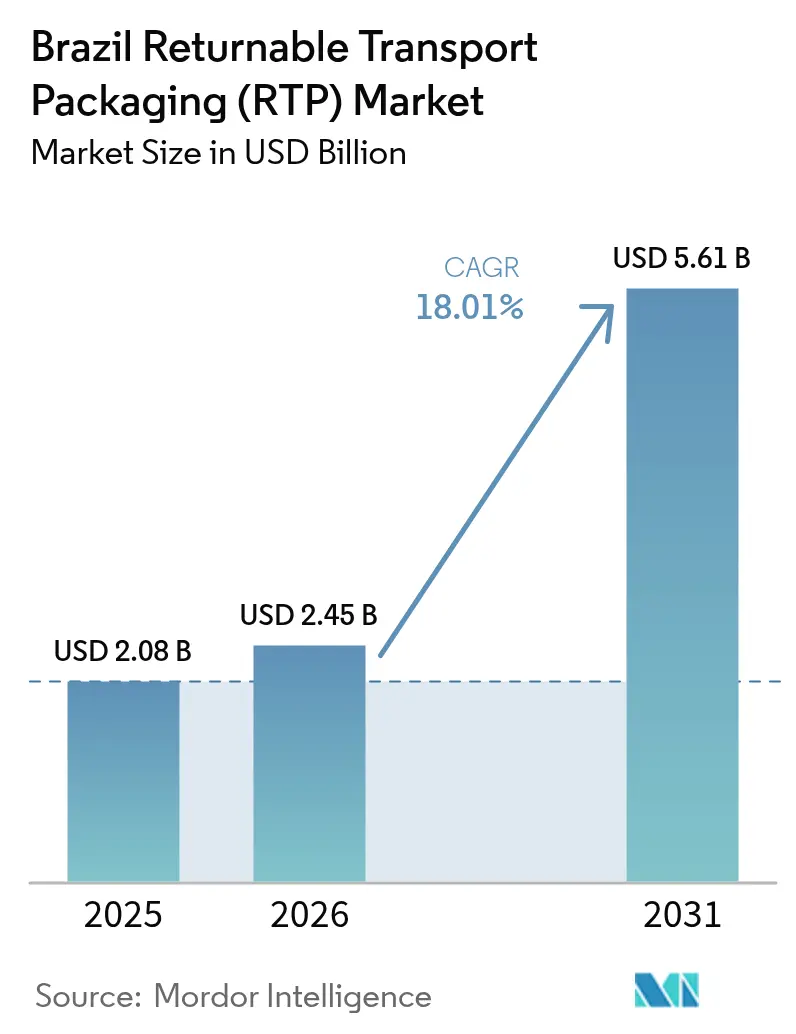
The Brazil returnable transport packaging market size is expected to grow from USD 2.08 billion in 2025 to USD 2.45 billion in 2026 and is forecast to reach USD 5.61 billion by 2031 at 18.01% CAGR over 2026-2031. Growth is propelled by stricter reverse-logistics regulations, robust agribusiness output, and large-scale e-commerce warehouse investments that collectively modernize national supply chains. Rapid crop expansion-IBGE forecasts a 7.0% rise to 314.8 million t in 2025-sustains baseline demand for reusable pallets and containers.[1]Igor Ferreira, “First forecast for 2025 harvest expects growth of 5.8% against 2024,” News Agency, agenciadenoticias.ibge.gov.br At the same time, Decree 11,413 (April 2023) monetizes reverse-logistics credits, turning the obligation to recover secondary packaging into an economic incentive for pooled assets.[2]Packaging School, “Extended Producer Responsibility Laws for Packaging Around The World,” packagingschool.com E-commerce players such as Mercado Libre are doubling distribution centers (10 → 27) through a USD 6.4 billion program that favors standardized plastic units able to cycle quickly through automated facilities. Finally, the country’s logistics real-estate shortage-vacancy headed for mid-single digits-supports higher rents and magnifies the payback of durable, reusable packaging that maximizes cube utilization.
Key Report Takeaways
- By material type, plastic captured 59.35% of the returnable transport packaging market share in 2025; composite plastic volumes expand at a 19.23% CAGR to 2031.
- By product type, pallets led with 44.35% revenue share in 2025, whereas containers are growing fastest at 21.34% CAGR.
- By service model, rental/pooling held 54.25% of the returnable transport packaging market size in 2025 and is projected to advance at 19.96% CAGR.
- By end-user, food & beverages accounted for 37.25% of the returnable transport packaging market in 2025, while retail & e-commerce is forecast to expand at 22.99% CAGR through 2031.
Note: Market size and forecast figures in this report are generated using Mordor Intelligence’s proprietary estimation framework, updated with the latest available data and insights as of 2026.
Brazil Returnable Transport Packaging (RTP) Market Trends and Insights
Drivers Impact Analysis*
| Driver | (~) % Impact on CAGR Forecast | Geographic Relevance | Impact Timeline |
|---|---|---|---|
| Growing food and beverage processing capacity | +3.2% | National, concentrated in Southeast and Center-West | Medium term (2-4 years) |
| Long-term cost savings vs. expendables | +2.8% | National, stronger adoption in Southeast | Short term (≤ 2 years) |
| Supply-chain sustainability and carbon-tax readiness | +2.1% | National, early adoption in São Paulo and Rio de Janeiro | Long term (≥ 4 years) |
| EPR legislation tightening on secondary packaging | +3.5% | National, stricter enforcement in Southeast | Medium term (2-4 years) |
| E-commerce fulfillment centers adopting pooled pallets | +2.9% | National, concentrated in metropolitan areas | Short term (≤ 2 years) |
| IoT-enabled asset tracking improving RTP ROI | +1.8% | National, pilot deployments in Southeast | Long term (≥ 4 years) |
| Source: Mordor Intelligence | |||
Growing Food & Beverage Processing Capacity
Record harvest volumes raise shipped tonnage and storage turnover, compelling processors to seek standardized, hygienic assets that circulate repeatedly without damage. CNA projects agribusiness GDP to rise 5% in 2025, spurring new silos and cold-rooms that integrate RFID-enabled crates for batch traceability.[3]Confederação da Agricultura e Pecuária do Brasil, “CNA prevê crescimento do PIB do agronegócio em 2025,” cnabrasil.org.br Plastic pallet pools absorb shocks and moisture common in feeder roads, protecting high-value protein exports. Processors also favor modular foldable containers that collapse on return legs, shrinking dead-haul costs. As leading meatpackers adopt blockchain to certify chain-of-custody, reusable units equipped with QR codes support digital auditing while meeting food-contact norms set by ANVISA.
EPR Legislation Tightening on Secondary Packaging
Decree 11,413 obliges brand owners to purchase reverse-logistics certificates—CCRLR, CERE, or Future Mass—shifting compliance from a paperwork exercise to a priced commodity. Corporates see pooled totes as an immediate route to shrink certificate outlays because each circulation displaces single-use corrugate. Producer Responsibility Organizations aggregate volume and negotiate transportation loops, rewarding suppliers able to deliver GPS-tracked fleets. Early movers lock in multi-year pooling contracts at favorable fee structures, mitigating the expected penalty uplift once enforcement widens beyond São Paulo.
E-commerce Fulfillment Centers Adopting Pooled Pallets
Mercado Libre’s 14,000-job distribution buildout and Dafiti’s 450,000-bin AutoStore grid demonstrate automation’s dependency on dimensionally consistent plastic units. High-velocity SKU assortments benefit from nestable totes that roll directly from inbound truck to goods-to-person robots, eliminating corrugate waste. Since delivery promise is measured in hours, operators prioritize real-time asset visibility; BLE tags embedded in pooled pallets feed WMS dashboards that orchestrate yard turns. As same-day coverage spreads to interior capitals, returnable transport packaging market participants offering pay-per-trip models win share against asset-sale rivals.
Long-term Cost Savings vs. Expendables
Freight absorbs 25% of soybean revenue and nearly 40% of corn prices at port, making any density gain financially material. Schoeller Allibert calculates 88% lower CO₂ over a crate’s life relative to one-way cardboard once cycles exceed 15 turns. Local users confirm three-year break-evens, even after factoring a 12% interest cost of capital. Plastic pools also hedge volatility in kraft linerboard prices, which rose double digits in 2024 following energy surcharges. Consequently, the returnable transport packaging market registers faster adoption among exporters who measure savings in both freight and avoided packaging spend.
Restraints Impact Analysis*
| Restraint | (~) % Impact on CAGR Forecast | Geographic Relevance | Impact Timeline |
|---|---|---|---|
| High upfront investment per trip asset | -2.4% | National, more pronounced in interior states | Short term (≤ 2 years) |
| Limited RTP wash/repair infrastructure outside Southeast | -1.9% | Interior states, particularly North and Northeast | Medium term (2-4 years) |
| Fragmented reverse-logistics networks in interior states | -1.6% | Interior states, rural areas | Medium term (2-4 years) |
| Disposable-culture bias among SME shippers and retailers | -1.3% | National, stronger in SME-dominated regions | Long term (≥ 4 years) |
| Source: Mordor Intelligence | |||
High Upfront Investment per Trip Asset
Container pools require cash outlays for durable plastics, RFID devices, and software integration at a time when Brazil’s SME credit gap exceeds 80% of demand, according to OECD metrics. Bank spreads above SELIC discourage outright purchase, so smaller shippers default to expendables even when lifecycle costs are higher. Pooling alleviates CapEx but still demands security deposits and minimum-turnover clauses that some cooperatives cannot absorb. Fintech lenders are experimenting with pay-as-you-go smart contracts where deposit levels adjust automatically to actual cycle time, a model likely to unlock additional returnable transport packaging market volumes after 2026.
Limited RTP Wash/Repair Infrastructure Outside Southeast
Eighty-five percent of certified wash bays sit within 300 km of Santos port, exposing Mato Grosso or Bahia grain hubs to backhaul detours that erode ROI. Poor BR-163 road segments further inflate repositioning costs when crates must travel to São Paulo for sanitization. Regional entrepreneurs hesitate to invest in local wash plants until asset density crosses a breakeven threshold of roughly 350,000 units per micro-region. Government-backed funding for multimodal corridors and a nascent inland waterway program could reduce shuttle distances, lowering the restraint impact from 2027 onward.
*Our forecasts treat driver/restraint impacts as directional, not additive. The impact forecasts reflect baseline growth, mix effects, and variable interactions.
Segment Analysis
By Material Type: Plastic Dominance Driven by Durability
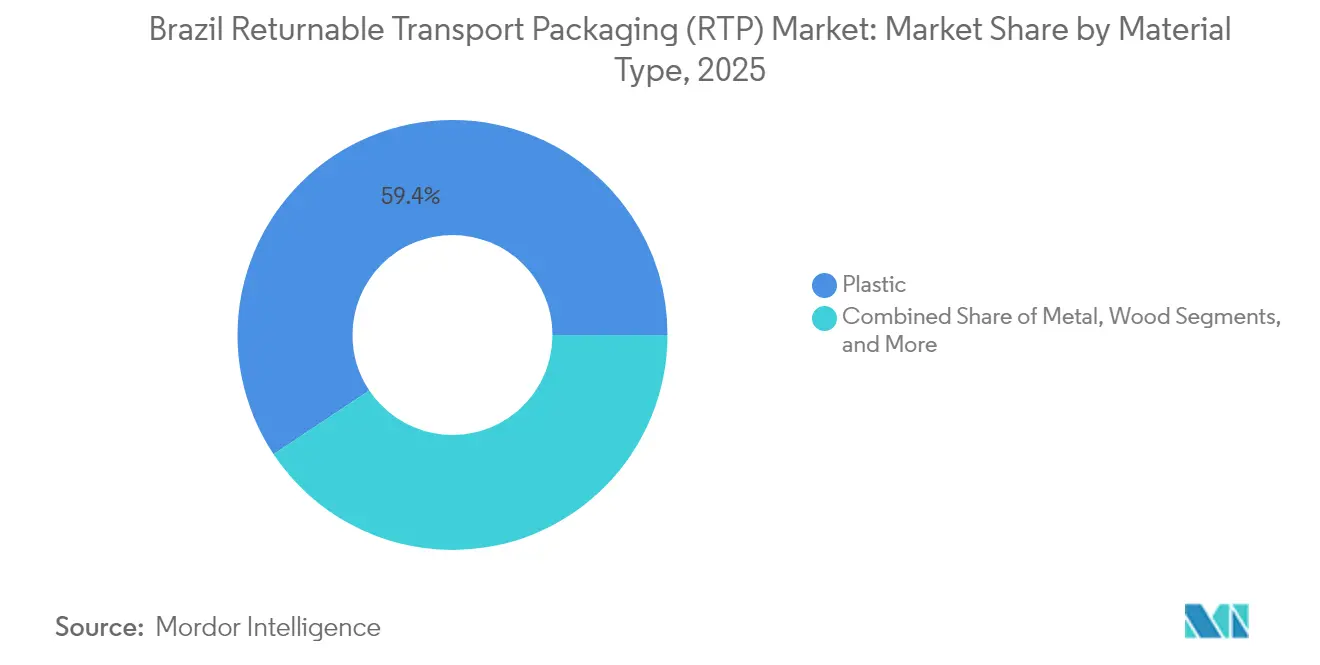
Plastic retained 59.35% of 2025 revenue and are forecast to advance at 19.23% CAGR, ensuring the segment continues to anchor the returnable transport packaging market. Lightweight HDPE and PP formats withstand harsh road vibrations while resisting Brazil’s humid climate, delivering more than 100 turns before refurbishment. Metal accounts for a niche share in petrochemical loops where static safety is paramount, yet rising steel costs and heavier tare weights limit wider penetration. Wood remains entrenched in farm-gate transfers but suffers shrinkage and moisture-borne mold, prompting exporters to migrate to plastic when seeking GFSI or ISO 22000 certifications.
Innovation underpins volume growth: Schoeller Allibert launched a 30% recycled-content crate portfolio in 2024 that satisfies both ANVISA food-contact norms and emerging MERCOSUR recycled PET standards. Manufacturers integrate anti-microbial additives and smart vents to manage ethylene build-up in fruit exports, aligning with quality-preservation mandates. Because plastic refurbishes quickly-90-second automated washing cycles-pool operators optimize circulation, thereby enlarging the effective returnable transport packaging market size for plastics well beyond first-sale numbers. Over the forecast, recycled-content mandates are expected to accelerate plastic share, provided resin feedstock becomes more abundant through ventures such as ALPLA’s new HDPE reprocessing line.


By Product Type: Containers Surge Despite Pallet Leadership
Pallets delivered 44.35% of 2025 value, cementing their role as the logistics standard. However, container demand will compound at 21.34% annually through 2031, spurred by e-commerce piece-pick operations where protective walls, RFID slots, and ergonomic handles reduce order-cycle friction. The returnable transport packaging market size for containers hit USD 0.84 billion in 2025 and is projected to exceed USD 2.68 billion by 2031 at the current trajectory. Foldable bulk bins for auto components, insulated fish tubs in Pará, and vented fruit crates in Minas Gerais all lift container mix. Drums and barrels persist in lubricants and agro-chem intermediates, albeit at mid-single-digit growth.
Interface compatibility drives substitution: containers engineered to sit securely on pooled pallets allow mixed stacking inside high-bay AS/RS, meeting safety regulations while boosting cube yield. The trend also reduces broken boards associated with nail-constructed wood pallets, trimming maintenance. Ultimately, container penetration hinges on automated sortation adoption; every new AutoStore or shuttle system installed expands the addressable returnable transport packaging market for standard-footprint bins.
By Service Model: Rental Pooling Gains Traction
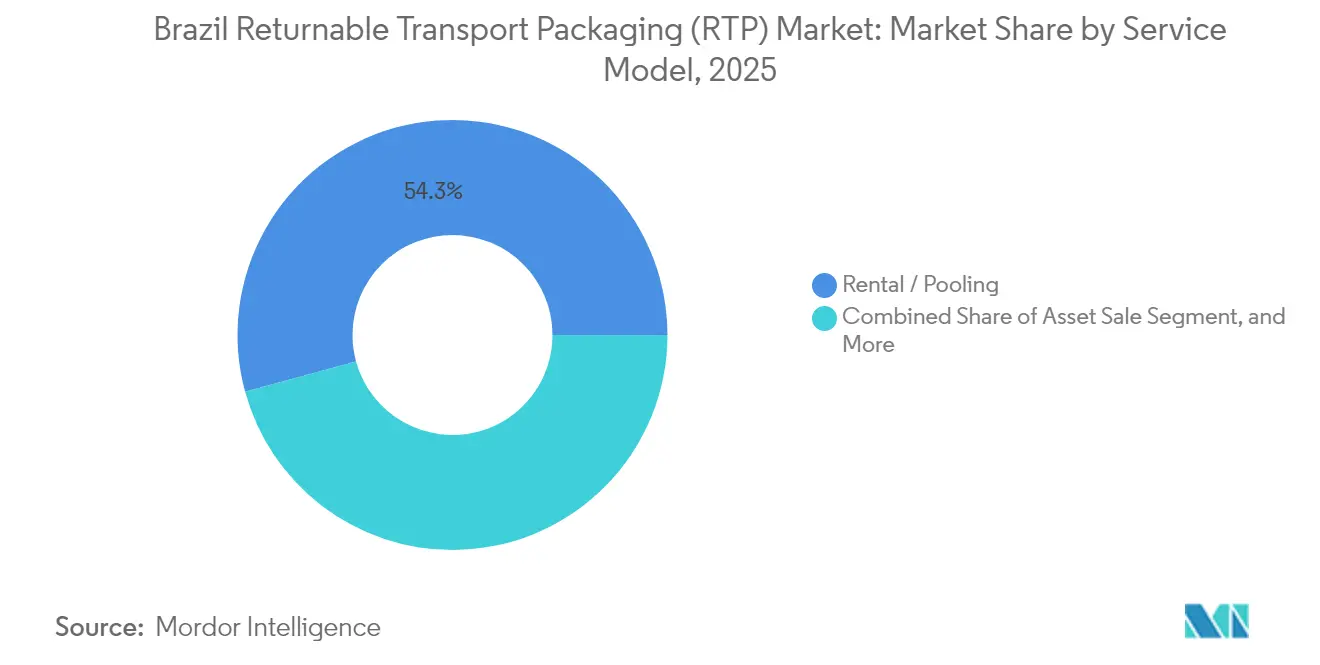
Rental/pooling claimed 54.25% share in 2025 and is tracking a 19.96% CAGR, dwarfing asset-sale growth. CapEx avoidance, outsourced maintenance, and assured compliance documentation underpin adoption. CHEP alone circulates 330 million platforms globally and has installed seven new Brazilian service centers since 2024, extending 24-hour turnaround to Fortaleza and Goiânia. Pool operators integrate LTE or BLE beacons, enabling pay-per-trip billing based on geofence-verified moves, minimizing disputes.
Asset-sale remains relevant where dedicated flows justify ownership-e.g., captive loops between a beer bottler and a nearby glass plant. Cleaning & maintenance services follow rental density: as pooled crates saturate, independent wash contractors emerge, particularly near pork-processing clusters in Santa Catarina. Tracking and reverse-logistics solutions constitute the fastest-growing ancillary revenue line, contributing 12% of operator turnover in 2025 and forecast to reach 18% by 2031 as EPR metrics require auditable movement logs.
By End-users: Retail E-commerce Disrupts Food & Beverage Dominance
Food & beverages sustained 37.25% revenue in 2025, reflecting Brazil’s ranking as a top‐three soy, beef, and poultry exporter. Nonetheless, retail & e-commerce is the standout, compounding at 22.99% through 2031. E-merchants installing regional sort centers need ergonomic totes that flow from inbound pallet to robotic decanting in minutes. The returnable transport packaging market share for retail & e-commerce could surpass 18% by 2027, reducing corrugate usage and lowering landfill fees in urban zones with stricter disposal rules. Automotive harnesses reusable racks for CKD parts directed at Stellantis’s Betim plant, while pharma players specify temperature-stable crates with tamper-evident seals to satisfy ANVISA guidelines.
E-commerce asset turns average seven cycles monthly versus two for agribusiness, improving pool economics and justifying advanced tracking. As last-mile density climbs, gig-economy couriers increasingly retrieve empty totes during backhauls, ensuring loop closure-an operational refinement that magnifies the overall returnable transport packaging market.
Geography Analysis
Southeast Brazil dominates adoption due to dense industrial clusters, port proximity, and an established refurbish network. Santos alone handled 230 million t in 2024, underpinning continuous pallet circulation among exporters. São Paulo’s robust road and rail connectivity yields sub-6 day round trips, enabling pool operators to guarantee availability without excess float inventory. Consequently, the region commands over one-half of returnable transport packaging market revenue.
Center-West states are the fastest-growing geography, expanding at a projected 21.56% CAGR as Mato Grosso soybean output reaches new records. Despite 1,500 km hauls to port, producers adopt collapsible bulk containers to save return-leg volume. Infrastructure bottlenecks persist-BR-163’s maintenance backlog inflates turnaround times-but planned rail extensions and inland barge corridors could cut freight costs by 30%, unlocking additional volume for the returnable transport packaging market once operational.
The North & Northeast lag because limited wash bays amplify repositioning costs. Nevertheless, strong fruit exports through Pecém and Suape ports create pockets of demand for vented crates. State incentives for cold-chain investments could accelerate wash-plant construction, especially when combined with public-private partnerships that align EPR goals with regional development funds. Over the forecast window, geography-driven disparities narrow but remain material to service-network strategy.
Regulatory Landscape
Brazil's RTP adoption is increasingly shaped by federal reverse-logistics rules under the National Solid Waste Policy (Law 12.305/2010) and its sector implementation through SINIR, which structures reporting, monitoring, and compliance for packaging take-back. Decree 12.688 (October 2025) established a national reverse-logistics system for plastic packaging, requiring obligated parties to account for plastic packaging flows and connect compliance evidence to SINIR as the monitoring backbone.
The same decree adds specific obligations relevant to returnable packaging, including reporting the quantity of returnable plastic packaging placed on the market and the volume refilled in annual results. It also ties compliance to minimum recycled-content requirements phased in during 2026 (January 2026 for large companies and July 2026 for SMEs). In parallel, returnable packaging in regulated beverage and water applications is anchored by ABNT technical standards (for example, ABNT NBR 14222 and ABNT NBR 14637 for returnable plastic water gallons and ABNT NBR 7841 for common returnable bottles), which reinforces hygiene and performance requirements and influences cleaning, inspection, and reconditioning practices across RTP loops.
Value Chain Analysis
The Brazil RTP value chain starts with polymer and additive suppliers and molders converting HDPE/PP and other materials into pallets, crates, totes, and specialty racks, followed by pool operators and 3PLs that deploy fleets into shipper networks under rental/pooling and pay-per-trip models. Service nodes (wash, repair, and sorting) are the operational core, as they restore assets to food-grade or industrial-ready condition and keep cycle times competitive. The network remains densest in the Southeast due to depot concentration and port-linked circulation.
Downstream, end users (food and beverages, retail and e-commerce, automotive, and other industrial shippers) integrate RTP into warehouse automation, yard management, and supplier delivery standards, which lifts demand for dimensionally consistent units and track-and-trace. Policy is now a direct value-chain driver, as Decree 12.688/2025 requires manufacturers, importers, distributors, and retailers to participate in plastic-packaging reverse logistics with quantitative recovery and recycled-content commitments. That increases the role of compliance documentation, data capture, and SINIR-linked reporting in how pooling providers, logistics firms, and brand owners structure contracts and closed-loop flows.
Competitive Landscape
The Brazilian returnable transport packaging market shows moderate concentration: the top five providers hold roughly 55% combined revenue, yet local specialists flourish in underserved corridors. CHEP and IFCO capitalize on multinational contracts, offering integrated pallet and produce-crate solutions that simplify procurement for FMCG majors. Schoeller Allibert’s merger with IPL in 2025 created a USD 1.4 billion revenue platform and unlocked tooling synergies that lower per-unit cost in Latin American plants.
Regional independents such as Nefab and Klabin leverage proximity to agricultural basins, tailoring pallets to specific truck bed widths and managing wash stations on leased cooperative land. Digital differentiation is rising: Brambles fitted 550,000 pallets with Track-and-Trace devices, allowing predictive maintenance scheduling and granular billing. Start-ups develop SaaS dashboards overlaying GPS data onto carbon calculators, catering to exporters preparing for EU Carbon Border Adjustment Mechanism levies.
Strategic maneuvers increasingly target capability gaps. ORBIS’s 2024 acquisition of Creative Techniques added custom auto-rack design that Brazilian OEMs can localize, while ALPLA’s HDPE recycling plant supplies closed-loop resin, reducing virgin import reliance. Competitive intensity centers on multi-year pooling tenders; incumbents with nationwide depot coverage and IoT toolkits consistently outscore price-only entrants. However, interior-state saturation remains low, leaving whitespace for agile entrants willing to co-invest in wash-repair capacity.
Brazil Returnable Transport Packaging (RTP) Industry Leaders
Kuehne + Nagel Serviços Logísticos
Schoeller Allibert Group
Nefab Embalagens Ltda.
Signode Brasileira Ltda.
ORBIS Corporation
- *Disclaimer: Major Players sorted in no particular order

Market Opportunities and Future Outlook
Regulatory implementation under Decree 12.688/2025 creates near-term whitespace for RTP providers that can bundle compliance-grade traceability and reporting with pooling, cleaning, and reverse logistics. With recycled-content requirements phased in during 2026 and monitoring routed through SINIR, demand increases for closed-loop models that document refills, returns, and material circularity, especially for plastic crates and pallets where reuse and recycled resin procurement intersect.
Sector-specific opportunities are visible in named programs and deployments that tie RTP to measurable operating outcomes. CHEP and Grupo Piracanjuba disclosed results from a one-year pallet pooling program (April 2026) that quantified CO2 avoidance, supporting broader uptake of pooling in high-turn FMCG routes where standardized pallets reduce losses and improve turnaround. Export and port corridors also open a service-led lane: CHEP highlighted circular-economy pooling aimed at reducing bottlenecks in Brazilian ports and improving sanitary compliance in fresh-fruit flows (April 2026), aligning RTP with clearance speed and quality-control requirements. In parallel, reusable unit demand expands beyond pallets into protective separation and handling aids, as shown by Cartonplast Group's Brazil consolidation and its partnership with Casa Valduga (January 2026) to supply reusable plastic layer pads for wine logistics, replacing single-use dunnage and widening the addressable pool for managed, returnable transit components.
Recent Industry Developments
- May 2026: Nefab inaugurated a manufacturing and engineering center in Wixom, Michigan, to scale production of reusable and returnable packaging for automotive and advanced manufacturing supply chains. The expansion strengthens Nefab's engineering capacity and tooling depth for returnable packaging programs, supporting faster design-to-deployment cycles for global customers that also operate in Brazil.
- October 2025: Nefab began operations at a new plant in Sapucaia do Sul (Rio Grande do Sul), expanding its local footprint for industrial packaging and returnable solutions serving automotive, energy, and telecommunications customers. The added regional capacity and proximity to southern industrial corridors improve lead times and support localization of returnable packaging programs in Brazil.
- March 2025: Tetra Pak and Schoeller Allibert announced a collaboration to develop and launch transport crates made using polyAl from used beverage cartons. The initiative advances recycled-content pathways for durable transport packaging and supports brand-owner circularity targets while broadening the material options for returnable crate platforms.


Research Methodology Framework and Report Scope
Market Definition and Coverage
This market covers the value of returnable transport packaging used in Brazil to move and store goods across supply chains, where the packaging is designed to be reused in multiple cycles through reverse logistics.
Scope exclusions: Excludes single-use transport packaging, and it also excludes primary retail packs that do not circulate back for reuse.
Segmentation Overview
- By Material Type
- Plastic
- Metal
- Wood
- Other Materials
- By Product Type
- Containers (foldable, rigid)
- Pallets
- Drums and Barrels
- Other Products (IBC, totes, crates)
- By Service Model
- Asset Sale
- Rental / Pooling
- Cleaning and Maintenance Services
- Tracking and Reverse-Logistics Services
- By End-users
- Automotive
- Food and Beverages
- Consumer Goods
- Retail and E-commerce
- Other End-users (pharma, chemicals, retail)
Data Sources, Market Sizing, and Validation
Desk Research
Desk research started with public production and trade signals that show how much packaging demand Brazil's shipment-heavy industries can support. Sources used for orientation included Brazilian Institute of Geography and Statistics (IBGE) industrial output series, Brazil customs trade statistics, and central bank macro indicators to normalize inflation and currency timing.
We also reviewed packaging and logistics references, such as association publications, public sustainability and reverse logistics guidance, and peer reviewed papers that describe reuse cycles and loss rates for pallets, crates, totes, and bulk containers. Company filings, investor presentations, and reputed press helped us understand capacity additions, pooling model adoption, and end user expansion plans. Where needed, our analysts used paid subscriptions for company financials and intelligence, plus shipment-level import and export databases to sanity check flows of relevant packaging materials and intermediate inputs. These examples are not exhaustive, and many other public sources were also used to collect, validate, and clarify the data.
Primary Interviews and Surveys
Primary work was used to stress test reuse-cycle assumptions and price points, since these drivers are not fully visible in public datasets. We spoke with packaging manufacturers, pool operators, distributors, and end users across food and beverages, industrial segments, and automotive supply chains to confirm return rates, damage patterns, and typical replacement timing for Brazil operations.
Distribution of primary research fieldwork respondents
| Company type | Respondent position |
|---|---|
| Top tier: 38% | CXOs: 13% |
| Mid tier: 43% | Functional/Unit leaders: 36% |
| Smaller Players: 19% | Managers: 51% |
Market-Sizing & Forecasting
The core model uses a top-down build that reconstructs the demand pool from Brazil end use throughput, then filters it through adoption of reusable handling formats in transport and warehousing. Once the market envelope is formed, we corroborate it with selective bottom-up checks, such as sampling average selling price ranges by pack type and validating expected unit volumes through channel checks and supplier capacity narratives.
Key inputs that shaped the model included reuse-cycle length by application, average trip counts per year, loss and breakage rates, replacement cycles, and price ladders by material choice (plastic, wood, and metal behave differently under heat, humidity, and rough handling). We also monitored manufacturing output by sector, export-oriented agribusiness movement, and warehouse automation trends that shift demand toward standardized totes and containers. Forecasting was carried using scenario analysis supported by a simple multivariate regression view, where industrial output, logistics activity, and stated sustainability targets were combined, and then adjusted using expert feedback on pooling penetration and return logistics effectiveness. When a direct volume signal was missing for smaller end uses, we filled the gap by applying conservative penetration bands tied to comparable industries, then rechecked them during interviews.
Data Validation & Update Cycle
Outputs are validated by comparing modeled totals with independent signals, including packaging material movement, industrial shipment indicators, and practical replacement-rate math implied by reuse cycles. Outliers are flagged early, and driver assumptions are reopened until the variance can be explained in plain business terms.
A multi-step internal review is followed, where estimates are checked again at segment and total levels before sign-off. Reports are refreshed annually, and interim updates are triggered when material events occur, such as major regulatory changes for reverse logistics, sharp currency swings, or visible capacity additions. Before delivery, an analyst runs a fresh data pass so clients receive the most current view.
Mordor Intelligence's Brazil Returnable Transport Packaging Market Sizing Compared With Other Published Estimates
It is normal to see different market values for Brazil returnable transport packaging, even when the topic name looks the same on the cover. The gaps usually come from what gets counted as returnable packaging, the year used for the starting point, and whether the math is driven by realistic reuse cycles or by broad packaging spend assumptions.
By tracking reuse-cycle lengths, loss and damage rates, and pack-type price ladders, then refreshing assumptions through Brazil-focused channel checks, Mordor Intelligence keeps one-way transport packs outside the scope and also avoids overstating demand from aggressive pooling adoption expectations. Some publishers report a smaller number because they focus mainly on a narrow product set, such as reusable boxes, and then exclude higher value formats like pallets and bulk containers. Others mix service revenues or use a conservative view on how fast reverse logistics improves in practice.
Benchmark comparison
| Source | Market Size | Gaps in Research Methodology |
|---|---|---|
| Mordor Intelligence | USD 2.08 B (2025) | |
| Industry Publisher A | USD 0.64 B (2025) | Uses a narrower product boundary and tends to center the sizing on selected returnable containers, with regional splits that can leave out broader industrial RTP formats and some pooling-related revenue treatment. |
| Research Publisher B | USD 0.24 B (2024) | Relies on an earlier valuation year and a tighter definition, which appears to emphasize a limited RTP subset and applies slower adoption assumptions, thereby compressing the total when compared with a wider demand pool. |
The spread in the table is mainly explained by boundaries and timing, not by a disagreement that RTP is growing in Brazil. When the scope is clearly limited to returnable transport use cases, and the inputs are tied to reuse behavior plus sector throughput, the resulting total becomes easier to follow and repeat in future updates.


Key Questions Answered in the Report
What is the current size of Brazil’s returnable transport packaging market?
The market stands at USD 2.45 billion in 2026 and is forecast to grow to USD 5.61 billion by 2031.
Which material dominates the returnable transport packaging market in Brazil?
Plastic holds 59.35% share due to its durability, lower tare weight, and compatibility with automated handling.
Why are rental and pooling services growing faster than asset ownership?
Rental models eliminate upfront CapEx, outsource maintenance, and include IoT tracking, driving a 19.96% CAGR to 2031.
How does Decree 11,413 influence adoption of reusable packaging?
The law monetizes reverse-logistics certificates, making pooled assets a cost-effective way to meet mandatory recovery targets.
Which end-user segment is expanding the quickest?
Retail & e-commerce is growing at 22.99% CAGR as large fulfilment centers standardize plastic totes for automated picking operations.
What main obstacle limits uptake in interior states?
The shortage of certified wash/repair facilities outside the Southeast increases repositioning costs, reducing ROI for SMEs.
Page last updated on:


 Your data is secure and never sold or shared.


