Market Overview
| Study Period | 2018 - 2031 |
|---|---|
| Base Year For Estimation | 2025 |
| Forecast Data Period | 2026 - 2031 |
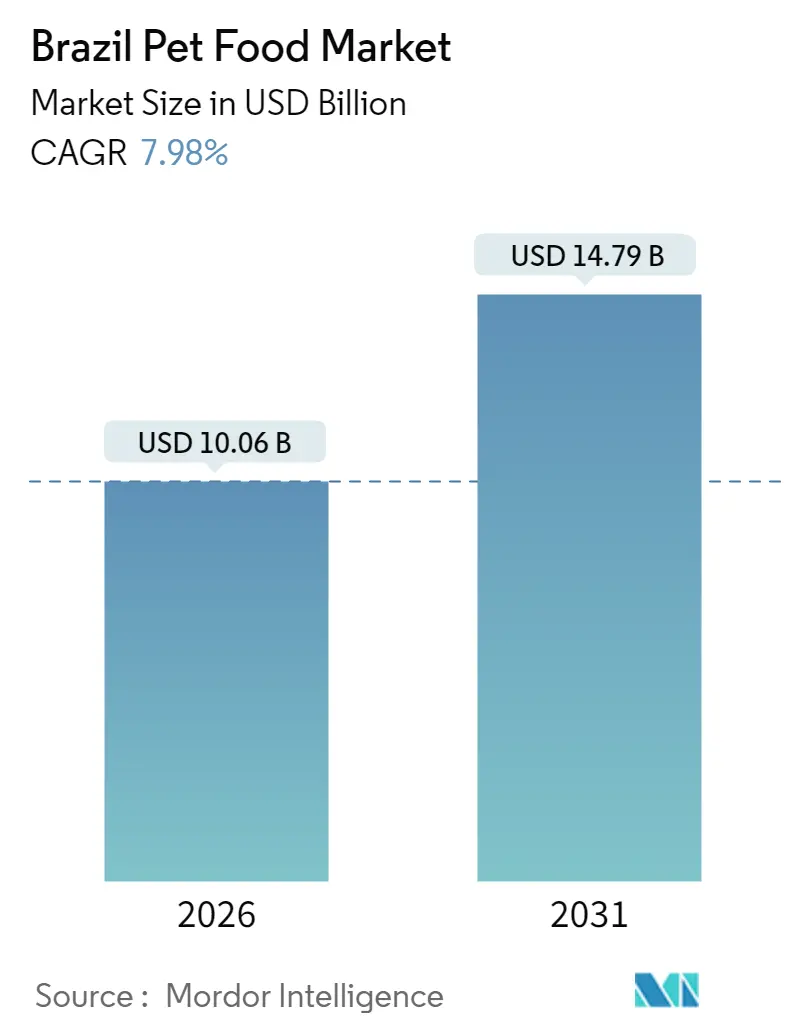
| Market Size (2026) | USD 10.06 Billion |
| Market Size (2031) | USD 14.79 Billion |
| Growth Rate (2026 - 2031) | 7.98% CAGR |
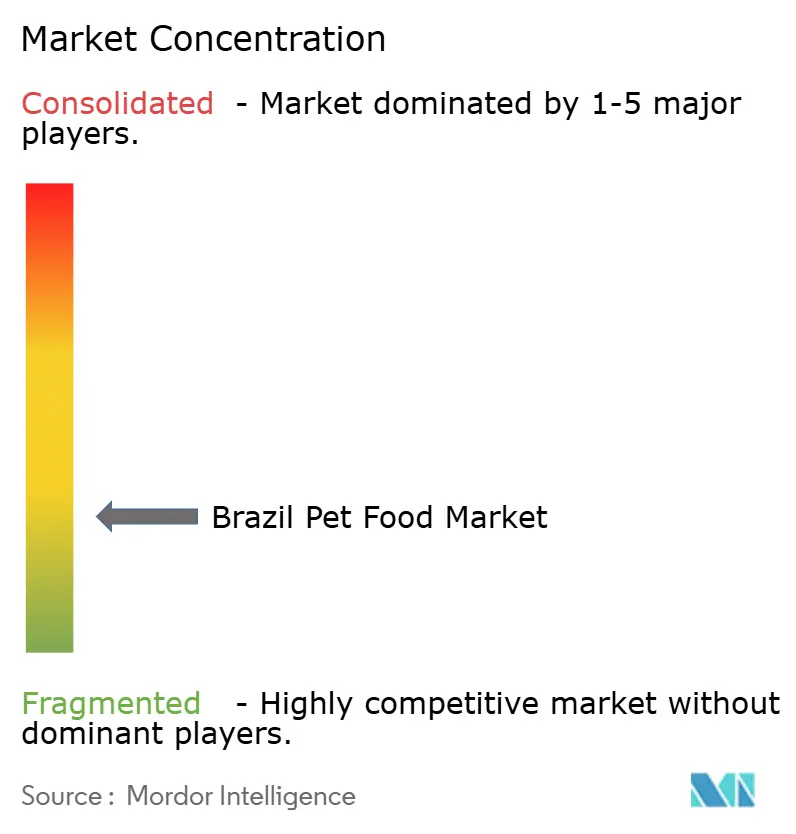
| Market Concentration | Low |
Major Players *Disclaimer: Major Players sorted in no particular order Image © Mordor Intelligence. Reuse requires attribution under CC BY 4.0. | |
Brazil Pet Food Market Analysis by Mordor Intelligence
The Brazil pet food market was valued at USD 9.32 billion in 2025 and estimated to grow from USD 10.06 billion in 2026 to reach USD 14.79 billion by 2031, at a CAGR of 7.98% during the forecast period (2026-2031). Robust growth is anchored in pet humanization, the gradual upgrade toward premium nutrition, and a companion-animal population that already exceeded 140 million dogs and cats in Brazil in 2022 [1]Source: USDA Foreign Agricultural Service, “Brazil: Paw-sitive Outlook for Pet Food,” usda.gov . Rapid online payment adoption is accelerating e-commerce penetration, while local agribusiness investment in novel proteins is easing supply pressures and supporting product innovation. Multinationals and domestic champions alike are deploying capacity. Mars opened a USD 90 million wet-food plant in Paraná in June 2025 to capture premium wet-food demand and insulate supply chains.
Key Report Takeaways
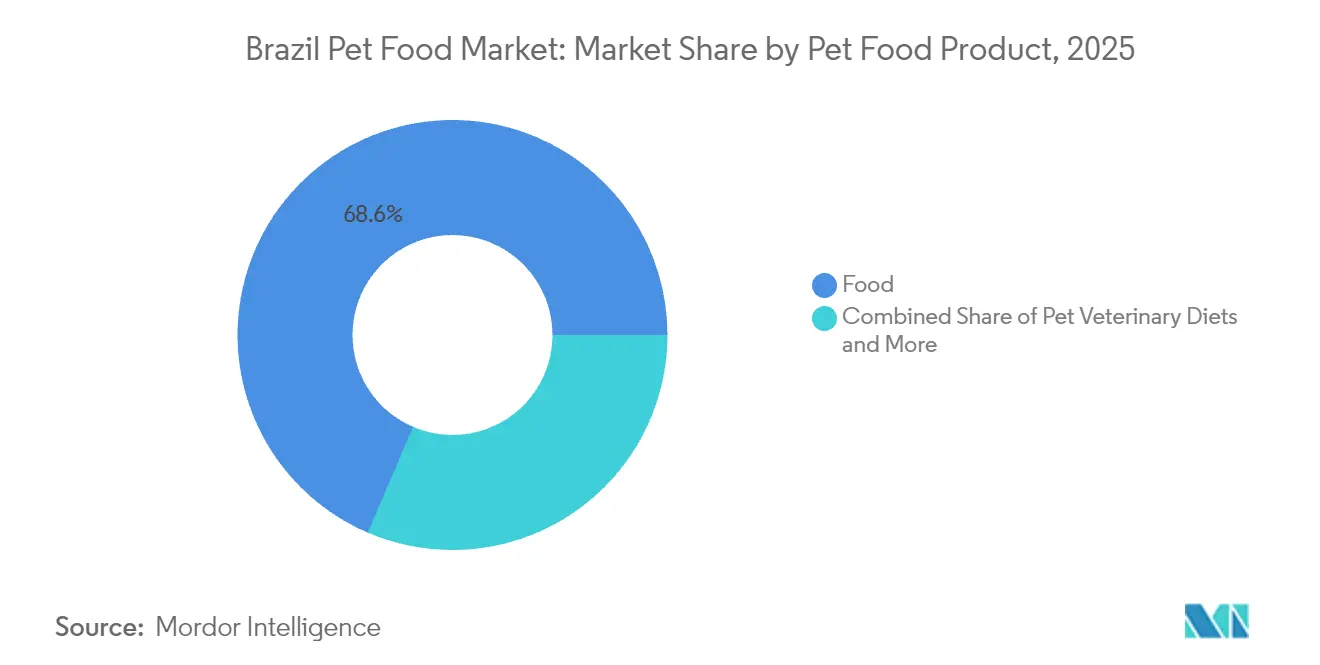
By product category, food products led the Brazil pet food market with a 69.1% share in 2024, while veterinary diets are projected to advance at a 10.2% CAGR through 2030.
By pets, dogs accounted for 74.1% of the Brazil pet food market size in 2024, whereas cat-focused products are set to expand at a 9.9% CAGR to 2030.
By distribution channel, specialty stores accounted for 47.6% of the Brazil pet food market size in 2024, while online platforms were projected to have the highest CAGR at 10.2% over the forecast horizon.
Note: Market size and forecast figures in this report are generated using Mordor Intelligence’s proprietary estimation framework, updated with the latest available data and insights as of January 2026.
Brazil Pet Food Market Trends and Insights
Drivers Impact Analysis
| Driver | (~) % Impact on CAGR Forecast | Geographic Relevance | Impact Timeline |
|---|---|---|---|
| Pet humanization trends are driving premiumization and higher per-capita spending | +2.1% | National, concentrated in the Southeast and South regions | Medium term (2-4 years) |
| A growing companion animal population, expanding market base, and volume demand | +1.8% | National, with urban concentration in São Paulo, Rio de Janeiro, and Belo Horizonte | Long term (≥ 4 years) |
| Veterinary prescription recommendations accelerating therapeutic diet adoption | +1.4% | Metropolitan areas with veterinary infrastructure concentration | Short term (≤ 2 years) |
| Digital commerce and Pix payments are transforming distribution and market accessibility | +1.2% | National, led by Southeast and South regions, with PIX adoption | Short term (≤ 2 years) |
| Domestic novel protein investments reducing ingredient costs and improving sustainability | +0.9% | Production concentrated in Paraná, São Paulo, and Minas Gerais | Medium term (2-4 years) |
| Potential tax reform creating opportunities for mass-market expansion and affordability | +0.8% | National impact with regional price sensitivity variations | Long term (≥ 4 years) |
| Source: Mordor Intelligence | |||
Understand The Key Trends Shaping This Market
Download PDF
Pet Humanization Trends Driving Premiumization and Higher Per-Capita Spending
Brazilian pet owners increasingly treat companion animals as family members, driving sustained premiumization across nutrition categories that extends beyond traditional price-performance trade-offs. This behavioral shift manifests in growing demand for human-grade ingredients, organic formulations, and specialized life-stage nutrition that mirrors trends in developed markets but occurs within Brazil's unique socioeconomic context. Mars' strategic focus on wet food expansion through its new Paraná facility directly targets this premiumization trend, as wet products command higher margins and align with humanization preferences for fresh, appetizing nutrition. The trend's durability stems from emotional bonding that proves resilient during economic downturns, distinguishing pet spending from other discretionary categories.
Growing Companion Animal Population Expanding Market Base and Volume Demand
Brazil adds around 2 million companion animals annually, expanding the addressable market base while creating sustained volume growth independent of per-capita consumption increases. This demographic expansion occurs through both natural population growth and rising pet adoption rates, particularly in urban areas where apartment living drives preference for smaller dog breeds and cats. The growth pattern favors dogs at a 3:1 ratio versus cats, reflecting cultural preferences and housing patterns that support canine ownership across income segments. Cat adoption accelerates in major cities as working professionals seek lower-maintenance companionship, creating opportunities for feline-specific nutrition products that currently represent an underdeveloped market segment. Population expansion also drives geographic market development as pet ownership spreads from traditional strongholds in Southeast Brazil to emerging regions in the Northeast and Center-West [2]Source: USDA Foreign Agricultural Service, “Brazil: Paw-sitive Outlook for Pet Food,” usda.gov .
Veterinary Prescription Recommendations Accelerating Therapeutic Diet Adoption
Rising chronic pet diseases, including diabetes, kidney disorders, and obesity, push veterinarians to recommend prescription diets that command premium pricing and create switching barriers through professional endorsement. This trend accelerates as Brazilian veterinary education emphasizes nutrition's role in disease management, while pet insurance adoption increases owner willingness to invest in therapeutic solutions. The prescription diet segment benefits from regulatory barriers that limit distribution to veterinary channels, protecting margins while building professional relationships that influence broader product recommendations. Hill's Pet Nutrition and Royal Canin dominate this segment through established veterinary partnerships, but domestic players like BRF Pet increasingly develop therapeutic formulations to capture local market share. The trend's sustainability relies on continued veterinary education and pet owner awareness of nutrition's role in health outcomes, supported by Brazil's expanding veterinary infrastructure.
Digital Commerce and PIX Payments Transforming Distribution and Market Accessibility
Online payment system adoption revolutionizes pet food e-commerce by eliminating credit card barriers and enabling instant transactions that previously constrained online purchasing among Brazil's unbanked population. This payment innovation, combined with improved logistics infrastructure, drives online channel growth at 10.2% annually while enabling subscription models that increase customer lifetime value and reduce acquisition costs. The e-commerce expansion particularly benefits premium and specialized products that require detailed product information and customer education, areas where online platforms excel compared to traditional retail environments. Subscription models create predictable revenue streams while reducing price sensitivity through convenience value, though success requires sophisticated logistics capabilities to maintain delivery reliability
Restraints Impact Analysis
| Restraint | (~) % Impact on CAGR Forecast | Geographic Relevance | Impact Timeline |
|---|---|---|---|
| Punitive tax burden limiting affordability and constraining market penetration | -1.9% | National, with an acute impact on price-sensitive Northeast and North regions | Long term (≥ 4 years) |
| Economic volatility and income inequality are restricting premium product adoption | -1.3% | National, concentrated in lower-income segments and rural areas | Medium term (2-4 years) |
| The meat export boom is tightening domestic protein availability and increasing ingredient costs | -0.8% | Production regions: South and Southeast, with meat processing concentration | Short term (≤ 2 years) |
| Limited commercial feed penetration restricts the addressable market size in underserved regions | -0.6% | Northeast, North, and rural areas with limited retail infrastructure | Long (≥ 4 years) |
| Source: Mordor Intelligence | |||
Punitive Tax Burden Limiting Affordability and Constraining Market Penetration
In 2024, Brazil's cascading tax structure creates a 50% effective burden on pet food retail prices through combined federal contributions (COFINS Contribution for the Financing of Social Security, PIS/PASEP Program of Social Integration (PIS), and Public Servant Asset Formation Program), import duties, state ICMS (Imposto sobre Circulação de Mercadorias e Serviços) taxes, and municipal levies that compound throughout the distribution chain. The burden particularly impacts imported premium products and specialized nutrition categories where additional regulatory compliance costs compound the tax disadvantage. The tax reform exclusion of the pet industry from recent legislative proposals indicates continued political challenges in achieving relief, while state governments resist ICMS (Imposto sobre Circulação de Mercadorias e Serviços) reductions that would impact their revenue streams. The constraint's persistence limits market expansion potential, forcing manufacturers to compete primarily on cost rather than innovation or quality differentiation.
Economic Volatility and Income Inequality Restricting Premium Product Adoption
Economic volatility and income inequality maintain price sensitivity across Brazilian consumer segments, constraining premium product adoption and forcing trade-downs during economic stress periods that can reverse years of premiumization progress. This sensitivity manifests in bulk purchasing behavior, private label preference, and delayed adoption of specialized nutrition products despite growing pet humanization trends. The constraint particularly affects middle-income households that aspire to premium nutrition but face competing financial priorities, including healthcare, education, and housing costs. Manufacturers respond through value engineering, smaller package sizes, and promotional strategies, though these approaches can erode brand positioning and margin structure. The challenge intensifies in regions with limited economic diversification, where employment volatility creates unpredictable demand patterns that complicate inventory management and distribution planning.
Segment Analysis
By Pet Food Product: Therapeutic Diets Drive Innovation
Food products maintain a commanding 68.55% Brazil pet food market size in 2025, reflecting their essential role in daily pet nutrition and established consumer purchasing patterns that prioritize complete nutrition solutions over supplementary products. Within this dominant segment, dry pet food represents the largest subsegment due to its convenience, shelf stability, and cost advantages, which align with Brazilian consumer preferences and retail infrastructure capabilities. The segment's strong performance is further supported by the growing trend of pet humanization, where pets are increasingly regarded as family members, leading to higher spending on quality Brazilian pet foods.
The fastest-growing subsegment, pet veterinary diets, expands at a 9.78% CAGR through 2031 as chronic pet diseases drive prescription nutrition demand and veterinary recommendations influence purchasing decisions. Pet nutraceuticals and supplements are capturing growing attention from health-conscious pet owners seeking preventive care solutions, while pet treats are benefiting from humanization trends that drive frequent purchase occasions and emotional bonding activities. Major pet food manufacturers are responding to this trend by developing innovative formulations that target specific health conditions while maintaining palatability. The segment is also benefiting from the increasing availability of these specialized diets through various distribution channels, particularly veterinary clinics and specialty pet stores, making them more accessible to pet owners across Brazil.
Note: Segment shares of all individual segments available upon report purchase
Get Detailed Market Forecasts at the Most Granular Levels
Download PDF
By Pets: Canine Dominance with Feline Growth
Dogs represent 73.35% of Brazil pet food market size in 2025, reflecting Brazil's cultural preference for canine companionship and housing patterns that accommodate larger pets across urban and rural environments. This dominance stems from historical cultural factors, security considerations, and social aspects of dog ownership that create strong emotional bonds and sustained spending commitment from Brazilian families. The shift toward premiumization is particularly evident in specialized dietary products, premium treats, supplements, and natural food options.
Cat-focused products achieve the fastest growth at 9.52% CAGR through 2031, driven by urban apartment living trends, working professional lifestyles, and changing demographics that favor lower-maintenance pet ownership. Other pets, including birds, fish, and small mammals, maintain niche market positions due to their specialized nutritional requirements and limited commercial product availability. The trend is particularly strong in wet food categories, as cats naturally prefer food with higher moisture content. The expansion of premium and specialized cat food offerings, including veterinary diets and natural products, is also contributing to the segment's rapid growth trajectory.
By Distribution Channel: Digital Transformation Accelerates
Specialty stores maintain a 46.85% Brazil pet food market size in 2025, through deep product knowledge, professional recommendations, and service capabilities that create value beyond product transactions for pet owners seeking guidance and expertise. These stores have established themselves as the preferred destination for pet owners due to their comprehensive product offerings and specialized expertise. The success of specialty stores can be attributed to their ability to provide expert guidance, premium brand selections, and customized solutions for pet nutrition needs. These stores typically employ knowledgeable staff who can offer personalized recommendations based on specific pet requirements, which has become increasingly important as pet owners become more conscious about their pets' health and dietary needs. Additionally, specialty stores often carry exclusive and premium pet food brands that may not be available through other retail channels, making them particularly attractive to pet owners seeking high-quality products.
Online channels achieve the fastest growth at 9.81% CAGR through 2031, driven by online payment adoption, improved logistics infrastructure, and convenience preferences that particularly appeal to urban professionals and premium product purchasers. This substantial growth is driven by several factors, including the increasing digitalization of retail and changing consumer preferences toward convenient shopping options. E-commerce platforms are revolutionizing the pet food purchasing experience by offering features such as automated subscription services, detailed product information, and customer reviews that help pet owners make informed decisions. The segment's growth is further supported by the expansion of major pet retailers into the digital space, with companies like Petz and Petlove leading the way in online pet food retail. These platforms are enhancing their service offerings with features such as same-day delivery, competitive pricing, and loyalty programs, making online shopping an increasingly attractive option for pet owners.

Note: Segment shares of all individual segments available upon report purchase
Get Detailed Market Forecasts at the Most Granular Levels
Download PDF
Geography Analysis
Brazil's pet food market exhibits strong regional concentration patterns that reflect economic development, urbanization levels, and cultural preferences across the country's diverse geographic landscape. The Southeast region dominates with a significant share, driven by São Paulo and Rio de Janeiro metropolitan areas, where high disposable incomes, urban lifestyles, and established retail infrastructure create optimal conditions for premium product adoption and frequent purchase occasions. This regional leadership stems from industrial concentration, higher education levels, and cultural openness to pet humanization trends that drive sustained market expansion.
The South region accounts for a significant share of market demand despite its smaller population, reflecting high per-capita incomes, strong agricultural traditions, and cultural affinity for pet ownership that creates above-average spending patterns. This region benefits from proximity to major manufacturing facilities and agricultural inputs, reducing distribution costs while supporting local production capabilities. ANVISA's (Agência Nacional de Vigilância Sanitária) streamlined foreign regulatory approval process, implemented in February 2025, particularly benefits import-dependent regions by reducing compliance barriers and accelerating product availability .
Regional growth dynamics reflect broader economic and demographic trends that reshape pet ownership patterns across Brazil's continental territory. Urban centers drive premiumization and specialized product demand, while rural areas maintain traditional feeding practices that limit commercial penetration but offer substantial expansion potential. The geographic distribution of veterinary services creates regional variations in prescription diet adoption, with metropolitan areas showing higher therapeutic nutrition penetration compared to underserved rural regions.
Competitive Landscape
Brazil's pet food market exhibits a fragmented market, with the top players, including Mars, Incorporated, Nestlé (Purina), BRF Global, PremieRpet, and Colgate-Palmolive Company (Hill's Pet Nutrition, Inc.), accounting for a share of 28.1% in 2024, creating competitive dynamics that balance multinational scale advantages against domestic market knowledge and agility. Product innovation has emerged as a key competitive strategy, with companies focusing on developing specialized formulations, natural ingredients, and premium offerings to meet evolving consumer preferences. Operational agility is demonstrated through investments in manufacturing facilities and distribution networks, particularly in strategic locations across Brazil.
Companies are actively pursuing strategic partnerships with research institutes, e-commerce platforms, and veterinary networks to strengthen their market presence. Expansion strategies have centered on increasing production capacity, establishing new manufacturing plants, and enhancing distribution capabilities to meet growing demand and improve market penetration. The Brazilian pet food market exhibits a balanced mix of global conglomerates and regional specialists, creating a dynamic competitive environment. Global players like Mars Incorporated and Nestlé Purina leverage their international expertise and extensive research capabilities to maintain market leadership, while regional players such as PremieRpet and BRF Global capitalize on their deep understanding of local preferences and established distribution networks.
The market has witnessed significant consolidation activity through strategic acquisitions and partnerships, particularly among larger players seeking to expand their product portfolios and geographic reach. Companies are increasingly focusing on vertical integration to control quality and costs throughout the supply chain. Regional players are strengthening their positions through partnerships with international companies, while global players are acquiring local brands to enhance their market presence. This consolidation trend has led to improved operational efficiencies and broader product offerings, benefiting both manufacturers and consumers.
Brazil Pet Food Industry Leaders
Mars, Incorporated
Nestle (Purina)
BRF Global
PremieRpet
Colgate-Palmolive Company (Hill's Pet Nutrition, Inc.)
- *Disclaimer: Major Players sorted in no particular order
Need More Details on Market Players and Competitors?
Download PDF
Recent Industry Developments
- June 2025: Mars Incorporated opened a USD 90 million wet food manufacturing facility in Paraná, Brazil, targeting 30% market share in the wet pet food segment through enhanced production capacity and localized supply chain advantages. This strategic investment reflects growing demand for premium wet food products and Mars' commitment to capturing premiumization trends in South America's largest pet food
- May 2023: Nestlé Purina Brazil, a leading pet food company in the country, opened a new wet pet food production facility in Florestal, Vargeão. While dry pet food remains more popular in Brazil, the Purina Vargeão facility will initially focus on wet food products, with an estimated annual production capacity of 30,000 metric tons. This investment in wet pet food production could position Nestlé Purina as the third-largest domestic pet food producer in Brazil.
- March 2023: PremieRpet launched a line of superpremium, "Protein-packed" meal toppers/treats for dogs and cats under the brand Natoo. These are produced at PremieRpet's facility in Brazil.
Brazil Pet Food Market Report Scope
Food, Pet Nutraceuticals/Supplements, Pet Treats, and Pet Veterinary Diets are covered as segments by Pet Food Product. Cats and dogs are covered as segments by Pets. Convenience Stores, Online Channel, Specialty Stores, and Supermarkets/Hypermarkets are covered as segments by the Distribution Channel.
Pet Food Product
| Food | By Sub Product | Dry Pet Food | By Sub Dry Pet Food | Kibbles |
| Other Dry Pet Food | ||||
| Wet Pet Food | ||||
| Pet Nutraceuticals/Supplements | By Sub Product | Milk Bioactives | ||
| Omega-3 Fatty Acids | ||||
| Probiotics | ||||
| Proteins and Peptides | ||||
| Vitamins and Minerals | ||||
| Other Nutraceuticals | ||||
| Pet Treats | By Sub Product | Crunchy Treats | ||
| Dental Treats | ||||
| Freeze-dried and Jerky Treats | ||||
| Soft and Chewy Treats | ||||
| Other Treats | ||||
| Pet Veterinary Diets | By Sub Product | Diabetes | ||
| Digestive Sensitivity | ||||
| Oral Care Diets | ||||
| Renal | ||||
| Urinary tract disease | ||||
| Obesity Diets | ||||
| Derma Diets | ||||
| Other Veterinary Diets |
Pets
| Cats |
| Dogs |
| Other Pets |
Distribution Channel
| Convenience Stores |
| Online Channel |
| Specialty Stores |
| Supermarkets/Hypermarkets |
| Other Channels |
| Pet Food Product | Food | By Sub Product | Dry Pet Food | By Sub Dry Pet Food | Kibbles |
| Other Dry Pet Food | |||||
| Wet Pet Food | |||||
| Pet Nutraceuticals/Supplements | By Sub Product | Milk Bioactives | |||
| Omega-3 Fatty Acids | |||||
| Probiotics | |||||
| Proteins and Peptides | |||||
| Vitamins and Minerals | |||||
| Other Nutraceuticals | |||||
| Pet Treats | By Sub Product | Crunchy Treats | |||
| Dental Treats | |||||
| Freeze-dried and Jerky Treats | |||||
| Soft and Chewy Treats | |||||
| Other Treats | |||||
| Pet Veterinary Diets | By Sub Product | Diabetes | |||
| Digestive Sensitivity | |||||
| Oral Care Diets | |||||
| Renal | |||||
| Urinary tract disease | |||||
| Obesity Diets | |||||
| Derma Diets | |||||
| Other Veterinary Diets | |||||
| Pets | Cats | ||||
| Dogs | |||||
| Other Pets | |||||
| Distribution Channel | Convenience Stores | ||||
| Online Channel | |||||
| Specialty Stores | |||||
| Supermarkets/Hypermarkets | |||||
| Other Channels | |||||
Need A Different Region or Segment?
Customize Now
Market Definition
- FUNCTIONS - Pet foods are usually intended to provide complete and balanced nutrition to the pet but are primarily used as functional products. The scope includes the food and supplements consumed by pets including veterinary diets. Supplements/nutraceuticals that are directly supplied to pets are considered within the scope.
- RESELLERS - Companies engaged in reselling of pet food without value addition have been excluded from the market scope, in order to avoid double counting.
- END CONSUMERS - Pet owners are considered to be the end-consumers in the market studied.
- DISTRIBUTION CHANNELS - Supermarkets/hypermarkets, specialty stores, convenience stores, online channels and other channels are considered within the scope. The stores which are exclusively providing pet related basic and custom products are considered within the scope of specialty stores.
| Keyword | Definition |
|---|---|
| Pet Food | The scope of pet food includes the food that is eatable by pets including food, treats, veterinary diets, and nutraceuticals/supplements. |
| Food | Food is animal feed intended for consumption by pets. It is formulated to provide essential nutrients and meet the dietary needs of various types of pets, including dogs, cats, and other animals. These are generally segmented into dry and wet pet foods. |
| Dry Pet Food | Dry pet foods may be extruded/baked (kibbles) or flaked. They have a lower moisture content, typically around 12-20%. |
| Wet Pet Food | Wet pet food, also known as canned pet food or moist pet food, generally has a higher moisture content compared to dry pet food, often ranging from 70-80%. |
| Kibbles | Kibbles are dry, processed pet food in small, bite-sized pieces or pellets. They are specifically formulated to provide balanced nutrition for various domestic animals, such as dogs, cats, and other animals. |
| Treats | Pet Treats are special food items or rewards given to pets, to show affection, and encourage good behavior. They are especially used during training. Pet treats are made from various combinations of meat or meat-derived materials with other ingredients. |
| Dental Treats | Pet dental treats are specialized treats that are formulated to promote good oral hygiene in pets. |
| Crunchy Treats | It is a type of pet treat that has a firm and crispy texture which can be a good source of nutrition for pets. |
| Soft and chewy treats | Soft and Chewy pet treats are a type of pet food product that is formulated to be easy to chewy and digest. They are usually made from soft and pliable ingredients, such as meat, poultry, or vegetables, that have been blended and formed into bite-sized pieces or strips. |
| Freeze-dried & Jerky Treats | Freeze-dried and jerky treats are snacks given to pets, that are prepared through a special preservation process, without damaging the nutritional content, resulting in long-lasting, nutrient-rich treats. |
| Urinary Tract Disease Diets | These are commercial diets that are specifically formulated to promote urinary health and reduce the risk of urinary tract infections and other urinary problems. |
| Renal Diets | These are specialized pet foods formulated to support the health of pets with kidney disease or renal insufficiency. |
| Digestive Sensitivity Diets | Digestive-sensitive diets are specially formulated to meet the nutritional needs of pets with digestive issues such as food intolerances, allergies, and sensitivities. These diets are designed to be easily digestible and to reduce the symptoms of digestive problems in pets. |
| Oral Care Diets | Oral care diets for pets are specially formulated diets produced to promote oral health and hygiene in pets. |
| Grain-Free Pet Food | Pet food that does not contain common grains like wheat, corn, or soy. Grain-free diets are often preferred by pet owners seeking alternative options or if their pets have specific dietary sensitivities. |
| Premium Pet Food | High-quality pet food formulated with superior ingredients often offers additional nutritional benefits compared to standard pet food. |
| Natural Pet Food | Pet food made from natural ingredients, with minimal processing and without artificial preservatives. |
| Organic Pet Food | Pet food is produced using organic ingredients, free from synthetic pesticides, hormones, and genetically modified organisms (GMOs). |
| Extrusion | A manufacturing process used to produce dry pet food, where ingredients are cooked, mixed, and shaped under high pressure and temperature. |
| Other Pets | Other pets include birds, fish, rabbits, hamsters, ferrets, and reptiles. |
| Palatability | The taste, texture, and aroma of pet food influence its appeal and acceptance by pets. |
| Complete and Balanced Pet Food | Pet food that provides all essential nutrients in appropriate proportions to meet the nutritional needs of pets without additional supplementation. |
| Preservatives | These are the substances that are added to pet food to extend its shelf life and prevent spoilage. |
| Nutraceuticals | Food products that offer health benefits beyond basic nutrition, often contain bioactive compounds with potential therapeutic effects. |
| Probiotics | Live beneficial bacteria that promote a healthy balance of gut flora, supporting digestive health and immune function in pets. |
| Antioxidants | Compounds that help neutralize harmful free radicals in the body, promoting cellular health and supporting the immune system in pets. |
| Shelf-Life | The duration of which pet food remains safe and nutritionally viable for consumption after its production date. |
| Prescription diet | Specialized pet food formulated to address specific medical conditions under veterinary supervision. |
| Allergen | A substance that can cause allergic reactions in some pets, leading to food allergies or sensitivities. |
| Canned food | Wet pet food that is packed in cans and contains higher moisture content than dry food. |
| Limited ingredient diet (LID) | Pet food formulated with a reduced number of ingredients to minimize potential allergens. |
| Guaranteed Analysis | The minimum or maximum levels of certain nutrients present in pet food. |
| Weight management | Pet food designed to help pets maintain a healthy weight or support weight loss efforts. |
| Other Nutraceuticals | It includes prebiotics, antioxidants, digestive fiber, enzymes, essential oils and herbs. |
| Other Veterinary Diets | It includes weight management diets, skin and coat health, cardiac care, and joint care. |
| Other Treats | It includes rawhides, mineral blocks, lickables, and catnips. |
| Other Dry Foods | It includes cereal flakes, mixers, meal toppers, freeze-dried foods, and air-dried foods. |
| Other Animals | It includes birds, fish, reptiles, and small animals (rabbits, ferrets, hamsters). |
| Other Distribution Channels | It includes veterinary clinics, local unregulated stores, and feed and farm stores. |
| Proteins and Peptides | Proteins are large molecules composed of basic units called amino acids which help in the growth and development of pets. Peptides are the short string of 2 to 50 amino acids. |
| Omega-3 fatty acids | Omega-3 fatty acids are essential polyunsaturated fats that play a crucial role in the overall health and well-being of Pets |
| Vitamins | Vitamins are the essential organic compounds that are essential for vital physiological functioning. |
| Minerals | Minerals are naturally occurring inorganic substances that are essential for various physiological functions in pets. |
| CKD | Chronic Kidney Disease |
| DHA | Docosahexaenoic Acid |
| EPA | Eicosapentaenoic Acid |
| ALA | Alpha-linolenic Acid |
| BHA | Butylated Hydroxyanisol |
| BHT | Butylated Hydroxytoluene |
| FLUTD | Feline Lower Urinary Tract Disease |
Need More Details on Market Definition?
Ask a Question
Research Methodology
Mordor Intelligence follows a four-step methodology in all our reports.
- Step-1: IDENTIFY KEY VARIABLES: In order to build a robust forecasting methodology, the variables and factors identified in Step-1 are tested against available historical market numbers. Through an iterative process, the variables required for market forecast are set and the model is built on the basis of these variables.
- Step-2: Build a Market Model: Market-size estimations for the forecast years are in nominal terms. Inflation is not a part of the pricing, and the average selling price (ASP) is kept constant throughout the forecast period.
- Step-3: Validate and Finalize: In this important step, all market numbers, variables and analyst calls are validated through an extensive network of primary research experts from the market studied. The respondents are selected across levels and functions to generate a holistic picture of the market studied.
- Step-4: Research Outputs: Syndicated Reports, Custom Consulting Assignments, Databases & Subscription Platforms

Get More Details On Research Methodology
Download PDF


