
Market Overview
| Study Period | 2020 - 2031 |
|---|---|
| Forecast Data Period | 2026 - 2031 |
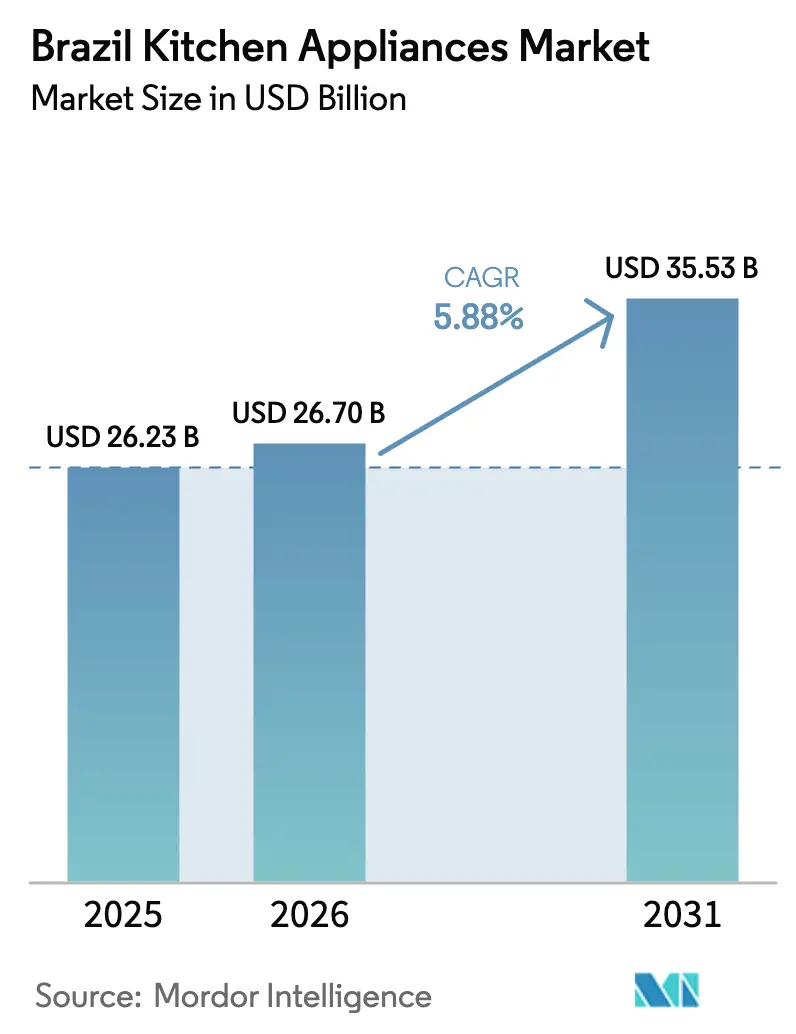
| Base Year Market Size (2025) | USD 26.23 Billion |
| Market Size (2026) | USD 26.70 Billion |
| Market Size (2031) | USD 35.53 Billion |
| Growth Rate (2026 - 2031) | 5.88 % |
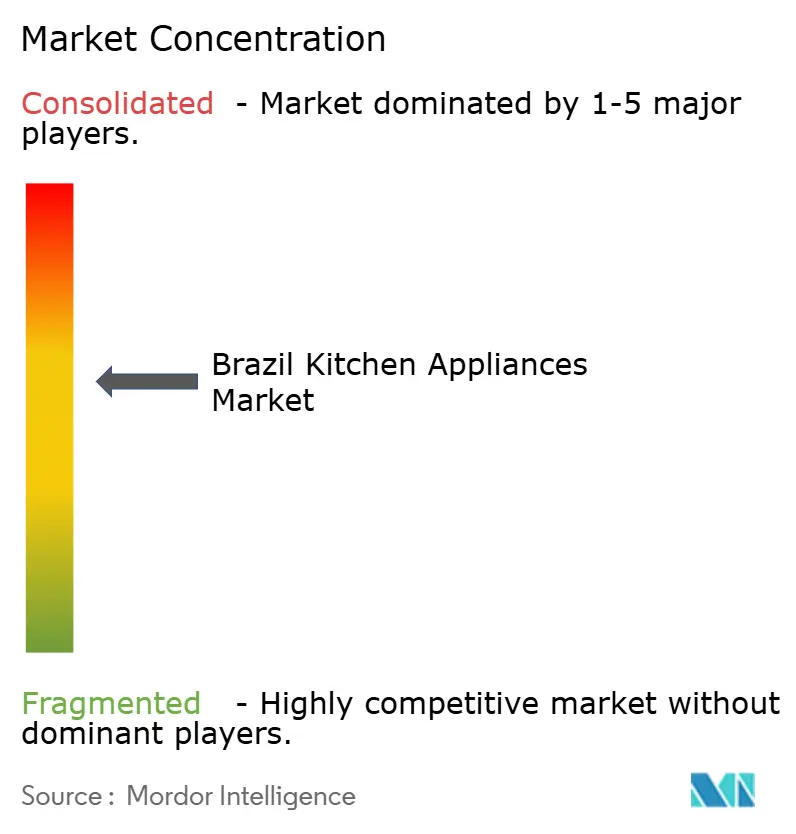
| Market Concentration | Medium |
Major Players *Disclaimer: Major Players sorted in no particular order Image © Mordor Intelligence. Reuse requires attribution under CC BY 4.0. | |
Brazil Kitchen Appliances Market Analysis by Mordor Intelligence
The Brazil Kitchen Appliances Market size is projected to be USD 26.23 billion in 2025, USD 26.70 billion in 2026, and reach USD 35.53 billion by 2031, growing at a CAGR of 5.88% from 2026 to 2031.
Large kitchen appliances continue to lead in value, while small kitchen appliances are expanding faster and shifting the product mix toward convenience-led categories. Residential demand remains the anchor, and commercial demand is recovering with support from robust food service activity. Retail still accounts for most transactions, although direct B2B routes are gaining momentum on the back of builder and hospitality procurement. A tight macro backdrop, including elevated policy rates, has constrained financed purchases, which raises the importance of energy-efficient offerings, omnichannel service, and targeted affordability in the Brazil kitchen appliances market.
Key Report Takeaways
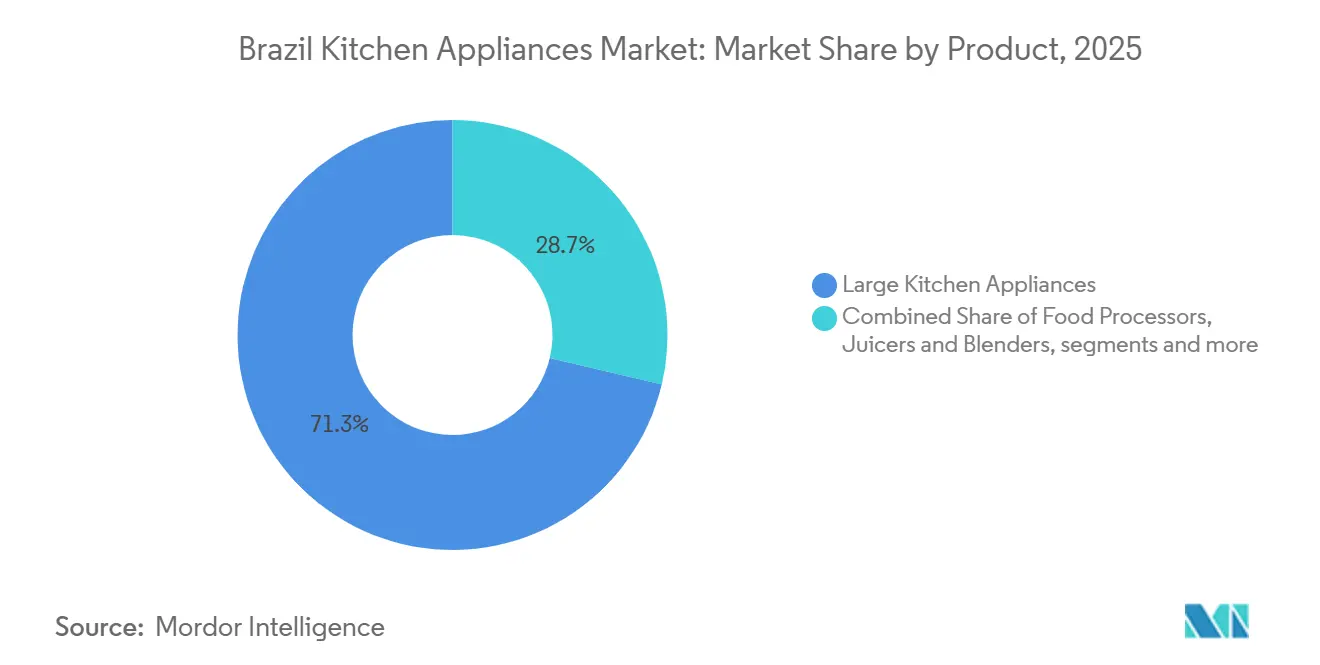
- By product type, large kitchen appliances led with 71.30% of the market size in 2025, while small kitchen appliances are forecast to expand at a 6.83% CAGR to 2031.
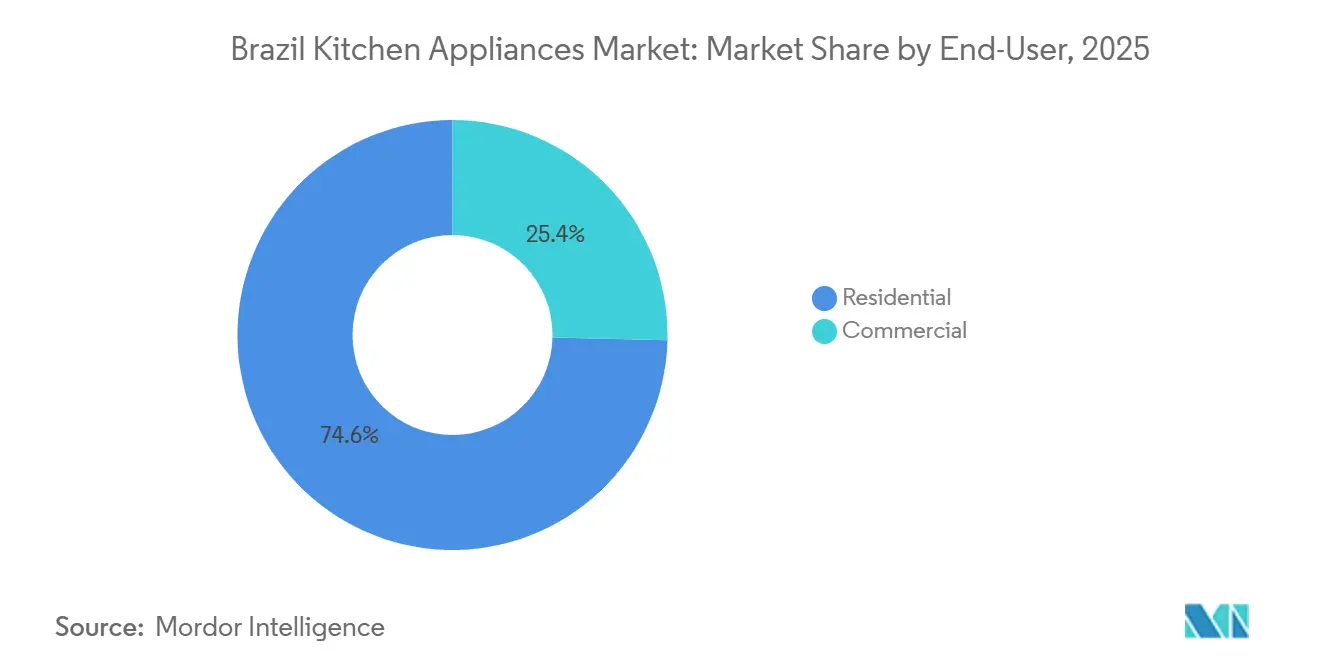
- By end user, residential accounted for a 74.61% market share in 2025, while commercial is projected to grow at a 6.27% CAGR through 2031.
- By distribution channel, B2C or retail held a 79.50% market share in 2025, while B2B is projected to record a 6.14% CAGR through 2031.
- By geography, the Southeast held a 53.47% market share in 2025, while the Northeast is set to register the highest projected 6.62% CAGR through 2031.
Note: Market size and forecast figures in this report are generated using Mordor Intelligence’s proprietary estimation framework, updated with the latest available data and insights as of January 2026.
Brazil Kitchen Appliances Market Trends and Insights
Drivers Impact Analysis*
| Driver | (~) % Impact on CAGR Forecast | Geographic Relevance | Impact Timeline |
|---|---|---|---|
| Rising disposable incomes & middle-class expansion | +1.2% | National, strongest in the Northeast, with faster real income growth | Medium term (2-4 years) |
| Rapid urbanization & smaller households | +0.9% | Southeast metropolitan cores, spillover to Northeast coastal cities | Long term (≥ 4 years) |
| Accelerating e-commerce penetration | +1.1% | National, led by Southeast hubs with distribution center density | Short term (≤ 2 years) |
| Government-backed energy-efficiency labelling | +0.7% | National, INMETRO compliance is mandatory | Medium term (2-4 years) |
| Surge in demand for smart or connected appliances | +0.8% | Southeast early adopters, diffusion to South and Central-West | Long term (≥ 4 years) |
| IoT-enabled pay-per-use financing pilots | +0.4% | National, concentrated in fintech-penetrated urban areas | Long term (≥ 4 years) |
| Source: Mordor Intelligence | |||
Rising Disposable Incomes & Middle-Class Expansion Propelling Replacement Cycles
Household purchasing power is improving in several regions, and that is lifting replacement demand for efficient refrigerators and other mid to premium models in the Brazil kitchen appliances market. In 2025, the national growth pulse in household consumption was moderate overall, yet the upgrade cycle moved forward in pockets with better formal employment and income momentum, especially across expanding urban centers in the Northeast and South [1]Source: Instituto Brasileiro de Geografia e Estatística, “PIB varia 0,1% no terceiro trimestre de 2025,” IBGE Agência de Notícias, agenciadenoticias.ibge.gov.br. Brazil's Northeast region recorded an 11.4% increase in mass income to USD 9.70 billion (R$53.7 billion) in Q1 2025, significantly outpacing the national household consumption growth of 2.4% for the year. Consumers are prioritizing energy savings and reliability when they replace older units, and that focus favors inverter compressors and products that carry top-tier labeling. Manufacturers that quantify real-world energy savings are seeing a clearer value proposition resonate with households, especially when utility bills remain top of mind. This dynamic supports a steady upgrade path in the Brazil kitchen appliances market, even when overall consumer spending is mixed, because energy performance delivers ongoing savings and a clearer payback window for buyers.
Rapid Urbanization & Smaller Households Reshaping Product Mix
The urban shift is compressing living space and is pushing more demand for built-in solutions and multifunctional small appliances in the Brazil kitchen appliances market. Compact housing in Brazil's accelerating urban centers is tilting demand toward space-efficient built-in appliances and multifunctional small appliances, a shift retailers like Magazine Luiza confirm through 5.2% same-store sales growth in Q3 2025. With more young workers entering cities and forming smaller households, compact cooktops and combination ovens are seeing a stronger pull in dense areas. Urban centers across the Southeast continue to anchor this effect, while a rising share of the Northeast is moving from agriculture to manufacturing and services, which supports household formation and appliance purchases. These transitions are creating steady opportunities for brands that design space-efficient form factors and usable features that fit constrained kitchens without sacrificing functionality. Urban-led growth is likely to stay central to the Brazil kitchen appliances market as demographic shifts and city-focused investment continue to drive household upgrades and first-time purchases [2]Source: World Bank Staff, “Brazil’s Northeast: Jobs, Clean Energy, and Economic Opportunity,” The World Bank, worldbank.org.
Accelerating E-Commerce Penetration: Fragmenting Traditional Retail Gatekeepers
Brazil's Black Friday 2025 e-commerce recorded USD 1.84 billion (R$10.19 billion) in transactions, a 7.8% increase, with refrigerators alone generating USD 100.5 million (R$556.8 million). Digital adoption is changing how consumers discover and purchase appliances, and it is altering channel power balances in the Brazil kitchen appliances market. Large brands are aligning product content, delivery options, and customer support to meet higher expectations for convenience and speed in online journeys. This has raised the bar for measurement of click-through to conversion, returns handling, and after-sales service integration within omnichannel models. As digital interfaces scale, manufacturers gain richer demand data to tune assortments and pricing, which can dilute the influence of traditional intermediaries. Although physical retail remains important for large appliances, the hybridization of retail and direct-to-consumer models is now a permanent feature of the Brazil kitchen appliances market, reinforcing the advantage for suppliers that can orchestrate logistics and service across both formats.
Government-Backed Energy-Efficiency Labelling Creating Quality Floors, but Implementation Gaps Persist
Energy labeling and minimum performance standards are shaping product development and buyer preferences in the Brazil kitchen appliances market. When standards tighten, the emissions and cost savings are material, as evidenced by the 2020 air conditioner label update that translated into an estimated 21.5 million metric tons of avoided CO2 by 2030 under Brazil’s program design[3]Source: CLASP Team, “Doubling Energy Efficiency with Appliances,” CLASP, clasp.ngo. Leading manufacturers now showcase high-efficiency models with clear claims on power consumption reductions, which help differentiate in competitive categories where features blur. One public example is recent refrigerator lines built to cut electricity use by up to 45% versus prior comparable models, which positions energy performance as a simple and repeatable purchase argument for households. Studies also point to a large national energy savings potential if Brazil aligns key appliance MEPS with best-available technologies, highlighting untapped room for policy and market convergence over the coming decade[4]Source: Panasonic Editorial Team, “Reducing Refrigerator Electricity Consumption by 45%,” Panasonic Newsroom, news.panasonic.com. This framework creates a quality floor that nudges performance upward in the Brazil kitchen appliances market, even as enforcement and transitional timelines can introduce uneven competitive dynamics.
Restraints Impact Analysis*
| Restraint | (~) % Impact on CAGR Forecast | Geographic Relevance | Impact Timeline |
|---|---|---|---|
| Intense price competition & margin squeeze | -0.9% | National, most acute in B2C retail channels | Short term (≤ 2 years) |
| High interest-rate sensitivity of instalment sales | -1.3% | National, disproportionately affects linha branca durables | Medium term (2-4 years) |
| Semiconductor supply-chain bottlenecks | -0.5% | Global supply chains feeding Brazilian plants | Short term (≤ 2 years) |
| Stricter e-waste take-back obligations | -0.6% | National, compliance burden heaviest in Southeast industry | Medium term (2-4 years) |
| Source: Mordor Intelligence | |||
Intense Price Competition & Margin Squeeze Driving Consolidation and Differentiation
Price-led rivalry is compressing gross margins and encouraging product, service, and branding strategies that justify premiums in the Brazil kitchen appliances market. The most resilient players are leaning on energy performance claims, stronger after-sales networks, and product reliability as anchors for price realization. Brands are also assessing SKU complexity and rebalancing toward fewer, higher-velocity models to keep inventory risk controlled and procurement leverage intact. Industry investment announcements signal a shift toward automation and product development to improve cost positions and raise quality, which speaks to renewed focus on fundamentals over temporary price promotions. The emerging path forward is clear: sustained differentiation through energy labels, product reliability, and responsive service rather than pure price positioning. As a result, brand equity, installed service capacity, and compliance sophistication matter more than short-lived discount cycles in the Brazil kitchen appliances market.
High Interest-Rate Sensitivity of Instalment Sales Crimping Large Durables
Financing cost remains the chief cyclical headwind for big-ticket appliances in the Brazil kitchen appliances market. The Selic policy rate rose from 11.5% early in 2024 to 15.00% by November 2025, raising borrowing costs across household credit and instalment plans that underpin large appliance purchases[5]Source: Banco Central do Brasil, “Histórico das Taxas de Juros,” Banco Central do Brasil, bcb.gov.br. The rate environment makes lower-ticket small appliances more resilient because a larger share of those purchases occurs in cash. In this context, a diversified product mix that spans both large and small appliances can help smooth revenue and support capacity utilization. The macro sensitivity reinforces the need for clear household value propositions and stable after-sales service to reduce perceived risk in the Brazil kitchen appliances market.
*Our forecasts treat driver/restraint impacts as directional, not additive. The impact forecasts reflect baseline growth, mix effects, and variable interactions.
Segment Analysis
By Product: Small Appliances Outpacing Large Despite Commanding Lower Share
Large kitchen appliances accounted for 71.30% of the Brazil kitchen appliances market share in 2025, while small kitchen appliances are expected to post a 6.83% CAGR through 2031. This split reflects the high base of refrigerators, freezers, and laundry products, which continue to anchor replacement cycles even in tighter credit conditions. At the same time, smaller appliances benefit from shorter replacement intervals and lower ticket sizes that fit household budgets without financing. Brands that demonstrate tangible energy savings and credible durability are retaining share in large appliances, while new formats and convenience features give small appliances the edge in unit volume. These combined trends keep both categories relevant and sustain a balanced product portfolio in the Brazil kitchen appliances market.
Within small kitchen appliances, renewed blender ranges and coffee equipment are seeing steady traction, aided by product refreshes that emphasize ease of use and performance. Product introductions in full-auto coffee machines for South America are aligned with a broad premium coffee trend in Brazilian households and hospitality, which lifts both brand engagement and average selling prices. Corporate disclosures indicate that the category baseline remains resilient even when weather-related items like fans create volatility in year-over-year comparisons. In large appliances, energy-efficient refrigerators and air conditioners continue to differentiate through labeling and verified consumption reductions, which are now visible to consumers at the point of sale. The result is a stable demand core driven by replacements and a faster-growth fringe fueled by new small appliance formats in the Brazil kitchen appliances market.


By End User: Commercial Segment Expansion Tied to HRI Recovery and Built-In Installations
Residential end users accounted for 74.61% of the Brazil kitchen appliances market size in 2025, with commercial demand set to grow faster at a 6.27% CAGR through 2031. Commercial kitchens in hotels, restaurants, and institutional settings are ramping up equipment upgrades as food service revenues expand, which supports specialized refrigeration, cooking, and beverage equipment purchases. The HRI segment recorded USD 96 billion in revenues in 2023, along with solid growth in imports of consumer-oriented products, reinforcing a broad upgrade path for food service operators. As commercial operators standardize on reliable, easy-to-service equipment, direct sourcing from manufacturers becomes more common and shifts volume toward B2B channels. These patterns suggest that the next leg of commercial growth will be driven by consistent dining traffic and hospitality investment that increases kitchen capacity across formats in the Brazil kitchen appliances market.
Residential demand remains the volume anchor and benefits from product innovation and better labeling that simplifies efficient choice. Within upper-income households, fitted or built-in projects continue to pull through premium appliances that deliver energy savings and aesthetic integration. The mid-market is most sensitive to borrowing costs, which slows larger purchases when interest rates are high and accelerates them as financing eases. This split underscores the importance of matching product and price points to regional affordability thresholds across Brazil. A balanced offer that spans entry models to premium built-ins puts suppliers in a stronger position to serve varied household needs in the Brazil kitchen appliances industry.
By Distribution Channel: B2B Direct Gains Reflect Builder Partnerships and Hospitality Procurement
B2C or retail channels held 79.50% of the Brazil kitchen appliances market share in 2025, while B2B direct is expected to grow at a 6.14% CAGR through 2031. Retail continues to dominate large appliance transactions due to in-store assessment needs and financing programs that are tailored to consumers. The B2B route is expanding as property developers, hotel chains, and restaurant groups source directly for standardization, warranty management, and total cost advantages. This trend is strongest in new-build residential projects and hospitality expansions where appliance packages are specified at the design stage to ensure performance and aesthetics. As B2B matures, service-level agreements and post-installation support become central to supplier selection in the Brazil kitchen appliances market.
The distribution mix is also influenced by omnichannel behavior as buyers research online and complete purchases in the most convenient path. Supply partners that offer transparent delivery timelines, installation services, and responsive support see higher conversion in both online and offline environments. For large-scale commercial orders, direct relationships reduce intermediation and create room for tailored service, spare parts planning, and technician training. For consumer orders, retail remains important for discovery and hands-on evaluation, especially for refrigerators, ovens, and washers. Over the forecast period, a dual-channel approach is expected to persist, with B2B gaining incremental ground in the Brazil kitchen appliances industry.
Geography Analysis
The Southeast region captured 53.47% of the Brazil kitchen appliances market size in 2025, reflecting the concentration of retail infrastructure and high-income urban clusters. The region hosts a dense installed base that sustains a steady replacement cycle for large appliances even when overall growth moderates. Elevated financing costs have reduced the pace of discretionary upgrades, which places more emphasis on products that can demonstrate measurable energy savings and reliability. Southeast consumers are also receptive to advanced features and premium finishes that justify their price points through durability and performance. These dynamics ensure the Southeast remains the largest region by value in the Brazil kitchen appliances market, even as its growth pace trends closer to the national average.
The Northeast is the fastest-growing region with a projected 6.62% CAGR, supported by labor market gains and an economic transition that raises the non-farm employment share. Policy and investment focus on jobs and clean energy is accelerating industrial and services activity, which lifts incomes and supports first-time and replacement demand for core appliances across key urban centers. As retail and logistics footprints deepen in the region, product availability and delivery reliability improve, which helps to reduce the historical access gap compared with the Southeast. Household budgets in the Northeast remain price sensitive, so energy efficiency and durability are important purchase criteria when credit conditions are tight. The trajectory of the region makes it a priority for suppliers seeking volume growth in the Brazil kitchen appliances market.
The South and Central-West add balanced growth as formal employment and steady consumption support both residential and selected commercial demand. The South shows a higher share of built-in and premium features in urban centers, while the Central-West benefits from stable public sector and agribusiness-linked incomes. Across Brazil, policy rates remained high through late 2025, which slowed household consumption and encouraged more deliberate big-ticket purchases. In this environment, suppliers that tailor price points, energy labels, and channel strategies by region will better capture demand pockets. Over the forecast horizon, the regional growth hierarchy is expected to persist, led by the Northeast and followed by steady gains in the South, while the Southeast remains the largest revenue base in the Brazil kitchen appliances market.
Value Chain Analysis
The Brazil kitchen appliances value chain starts with upstream inputs such as steel, plastics, glass, compressors, electronic controls, and semiconductors, supplied through a mix of domestic inputs and imported components. Manufacturers and assemblers (including multinational and local brands) concentrate production in established industrial corridors, supported by automation and Industry 4.0 upgrades. Eletros reported 117.7 million units sold across the broader electronics and appliance industry in 2024 (+29% vs 2023), followed by a 1% decline in 2025 sales versus 2024, pointing to a more cautious downstream replenishment cycle.
Midstream activity includes local component localization, sub-assembly, final assembly, quality testing, and compliance labeling. The import tax structure (federal Importation Tax, IPI, plus state ICMS) increases the landed cost of imported parts and finished goods, which pushes manufacturers toward local content strategies. In the downstream market, national retailers and marketplaces handle most B2C transactions, while direct sourcing by builders and hospitality operators supports growing B2B sales, where installation, warranties, spare parts, and service networks influence supplier selection. Recent supply-chain moves, including Whirlpool's May 2026 plan to invest in domestic component sourcing at Rio Claro and Midea Carrier's expansion actions at Pouso Alegre, indicate a shift toward more Brazil-centered supply chains to reduce FX exposure and lead-time volatility.
Competitive Landscape
The Brazil kitchen appliances market exhibits high intensity despite concentration among Eletros-member companies. Company disclosures and investment plans show a focus on production efficiency and local manufacturing improvements that can lower unit costs and strengthen quality. One manufacturer highlighted automated upgrades at a São Paulo plant to bolster productivity while preserving design and energy performance priorities that support premium pricing. Industry associations also flagged planned capital expenditures for 2025 to 2027 across white goods, air conditioning, and portable appliances to expand capacity and develop new products, signaling a multi-year commitment to innovation and quality. The net effect is a market where top-line growth coexists with selective margin pressure, which compels clearer product positioning in the Brazil kitchen appliances market.
Technology and software are now integral to product lifecycles, and some manufacturers have extended support timelines for home appliance software to enhance longevity and performance. A case in point is the roll-out of a unified interface across refrigerators and ovens with up to seven years of software updates for 2024 models, which strengthens trust in long-lived connected products. At the same time, regional portfolio plans can differ based on infrastructure readiness and demand depth, with some global AI-enabled models slated for broader international release but without a launch forecast for Brazil as of early 2026. In small appliances, product refreshes in blenders and full-auto coffee machines target consistent home use cases and quality improvements, which help defend share in competitive price bands. These product and software moves underscore a broader pivot to lifecycle value and sustained performance in the Brazil kitchen appliances market.
Energy efficiency remains a decisive battleground. Field-proven claims around reduced power consumption are resonating with buyers who seek predictable operating cost savings. High-performing refrigerators that cut energy use by up to 45% position brands to win replacement cycles when interest rates complicate financing for big-ticket items. Policy studies indicate the system-wide gains possible when national standards align with best-available technology, which encourages ongoing product and process investment by manufacturers. As suppliers execute on differentiated energy labels, robust service networks, and reliable logistics, competitive narratives will continue to shift from short-term discounting to durable value creation in the Brazil kitchen appliances market.
Brazil Kitchen Appliances Industry Leaders
Whirlpool Corporation
Samsung Electronics Co., Ltd.
LG Electronics Inc.
Electrolux AB
Groupe SEB (incl. Arno)
- *Disclaimer: Major Players sorted in no particular order

Market Opportunities and Future Outlook
Localization and capacity additions are creating room for suppliers that can pair lower cost structures with compliant, energy-efficient portfolios. LG's January 2026 inauguration of a BRL 1.5 billion refrigerator plant in Fazenda Rio Grande (PR) with 500,000 units per year capacity, and Whirlpool's May 2026 plan to localize components for front-load washing machines at Rio Claro (SP), are aligned with this direction. Whirlpool is also preparing induction cooktop production at Manaus (AM) during August to September 2026, which would further support locally produced, region-optimized models that reduce exposure to import duties, FX swings, and global component disruptions.
At the product level, the clearest openings are in (i) smart and connected kitchen ecosystems and (ii) built-in and space-efficient solutions that fit urban household formation and premium renovation cycles, especially in the Southeast and South. Portfolio actions already point to this focus, including Samsung's April 2026 expansion of premium kitchen offerings (Bespoke AI refrigerators, dishwashers, and induction cooking) and LG's May 2026 launch of a Bivolt side-by-side refrigerator designed for Brazil's mixed voltage infrastructure. On the channel side, omnichannel purchase journeys and builder and hospitality procurement support demand for suppliers that can bundle delivery, installation, and after-sales service, with service coverage and parts availability shaping competitiveness alongside price.
Recent Industry Developments
- May 2026: LG Electronics launched the Side by Side L267 refrigerator in Brazil with Bivolt compatibility (127V/220V) and a large-capacity format aimed at premium kitchen buyers. The product positioning addresses an installation friction point across regions with different voltage standards while supporting LG's push in higher-ticket refrigeration.
- December 2025: Whirlpool inaugurated a "Factory of the Future" at its Rio Claro (SP) unit to expand the use of AI, automation, and robotics in manufacturing lines that include washers, stoves, and cooktops. The upgrade strengthens local productivity and quality capabilities, supporting faster product cycles and cost competitiveness in a price-pressured market.
- December 2024: Midea Group opened its third manufacturing facility in Pouso Alegre, Minas Gerais, producing refrigerators and washing machines for Brazil and wider South America. The plant expanded local capacity and reinforced Midea's localization strategy, increasing competitive intensity for domestically produced large appliances.


Research Methodology Framework and Report Scope
Market Definition and Coverage
For this study, the market is defined as the value of kitchen appliance products sold in Brazil, covering revenue generated from major and small kitchen appliances across residential and commercial end users.
Scope exclusions: We exclude non-kitchen home appliance categories that are not primarily used for food storage, preparation, or cooking, and we also exclude used product re-sales.
Segmentation Overview
- By Product
- Large Kitchen Appliances
- Refrigerators & Freezers
- Dishwashers
- Range Hoods
- Cooktops
- Ovens
- Other Large Kitchen Appliances (water purifiers, etc.)
- Small Kitchen Appliances
- Food Processors
- Juicers and Blenders
- Grills and Roasters
- Air Fryers
- Coffee Makers
- Electric Cookers
- Toasters
- Electric Kettles
- Countertop Ovens
- Other Small Kitchen Appliances (bread makers,waffle makers, egg cookers, etc.)
- Large Kitchen Appliances
- By End User
- Residential
- Commercial
- By Distribution Channel
- B2C/Retail
- Multi-brand Stores
- Exclusive Brand Outlets
- Online
- Other Distribution Channels
- B2B (directly from the manufacturers)
- B2C/Retail
- By Geography
- North
- Northeast
- Southeast
- South
- Central-West
Data Sources, Market Sizing, and Validation
Desk Research
Desk work was used to build the factual base and to set realistic ranges before we started modeling. We leaned on public statistics and reference documents such as IBGE household and income indicators, Brazil customs trade series for relevant appliance HS codes, Banco Central do Brasil inflation and FX series, and energy and efficiency references from bodies such as INMETRO and related government portals.
To complete the picture, we also reviewed company filings and investor materials for manufacturers and retailers that disclose Brazil performance, along with association websites and credible press coverage that tracks retail demand and promotions. A paid subscription focused on company financials and another focused on shipment-level trade records were used selectively to cross-check revenue direction and import intensity when public data was not granular enough. These desk sources are illustrative only, and many other public references were consulted to collect, validate, and clarify data points throughout the work.
Primary Interviews and Surveys
Primary work centered on interviews and short surveys with manufacturers, distributors, large-format retailers, e-commerce sellers, service networks, and industry consultants active in Brazil. Inputs were used to confirm category coverage, typical pricing moves, channel splits, and regional demand differences, for example Southeast versus South. We then used these inputs to pressure-test assumptions coming from desk work so the final model stays realistic.
Distribution of primary research fieldwork respondents
| Company type | Respondent position |
|---|---|
| Top tier: 38% | CXOs: 13% |
| Mid tier: 46% | Functional/Unit leaders: 30% |
| Smaller Players: 16% | Managers: 57% |
Market-Sizing & Forecasting
Sizing starts from a top-down demand pool build where household formation, appliance penetration or replacement tendency, and retail sales intensity are used to reconstruct the addressable value for Brazil. Once that structure was stable, the totals were corroborated with selective bottom-up checks, such as sampled average selling price by category multiplied by estimated volumes, and channel checks that compare offline versus online contribution so the number does not drift away from market reality.
Key inputs used in the model include appliance import and export direction, BRL to USD conversion timing, inflation-driven price progression, changes in housing and renovation activity, and the adoption pace for higher-ticket large appliances versus faster-turn small appliances. Where volume signals were incomplete for a category, we filled the gap using proxy indicators like trade flows, shelf price tracking, and interview-based replacement cycles. We then normalized results to avoid over-counting the same demand through multiple channels.
For forecasting, we used scenario analysis supported by short time series smoothing on category-level growth, since promotions, credit availability, and FX pass-through can shift demand quickly in Brazil. The final growth path was adjusted only after primary experts confirmed whether the assumed price and mix shifts looked achievable for the next few years.
Data Validation & Update Cycle
Validation was done through repeated checks where model outputs were compared against independent signals such as trade direction, reported sales commentary, and observed price movement, and then reviewed for large variances by another analyst before sign-off. If an outlier showed up, we re-checked definitions, re-ran sensitivity on the key inputs, and in some cases re-contacted respondents to confirm what changed and when.
The dataset is refreshed annually, and interim updates are triggered when there are material events like sudden FX swings, tariff changes, or major shifts in consumer credit conditions. Before delivery, a final pass is performed so that clients receive an updated view that reflects the latest available information.
Mordor Intelligence's Brazil Kitchen Appliances Products Market Market Size Compared With Other Published Estimates
Published market values for Brazil kitchen appliances can look far apart, even when the country and product set discussed by sources overlaps. The gaps usually come from what is counted as a kitchen appliance, whether commercial demand is included, and how pricing is treated when inflation and currency moves are uneven.
For this market, the biggest drivers are scope and pricing math. Some estimates stay household-only, or they narrow the basket to a few product groups, and then apply an average price path that does not fully reflect mix shifts between large and small appliances, which can pull the total down. Other figures can also be anchored to a different base year or a longer forecast window. That changes the implied growth pace and the USD conversion point used in the series.
Benchmark comparison
| Source | Market Size | Gaps in Research Methodology |
|---|---|---|
| Mordor Intelligence | USD 26.23 B (2025) | |
| Global Consultancy A | USD 11.97 B (2024) | Uses a household-only scope and a different base year, which can exclude commercial demand and shift the price and currency timing versus a broader kitchen appliance revenue view. |
| Industry Publisher B | USD 4.30 B (2025) | Applies a narrower product basket with limited category breadth and relies on a smaller value base, which can understate large appliance contribution and the combined channel mix in Brazil. |
The table shows that scope choices and pricing assumptions explain most of the spread. When commercial end users are counted alongside households and category coverage is kept broad (large and small appliances together), the total moves closer to USD 26.23 B (2025), which is why this approach is applied by Mordor Intelligence.


Key Questions Answered in the Report
What is the current size and projected growth of the Brazil kitchen appliances market?
The Brazil kitchen appliances market size stands at USD 26.70 billion in 2026 and is projected to reach USD 35.53 billion by 2031 at a 5.88% CAGR.
Which product category leads and which is growing fastest in the Brazil kitchen appliances market?
Large kitchen appliances lead with 71.30% share in 2025, while small kitchen appliances post the fastest growth at a 6.83% CAGR to 2031.
Which end user contributes most to revenue in the Brazil kitchen appliances market?
Residential accounts for 74.61% of the 2025 value, while commercial is the fastest-growing end user with a 6.27% CAGR through 2031.
Which sales channels are gaining momentum in the Brazil kitchen appliances market?
B2C or retail holds 79.50% share in 2025, while B2B direct channels are the fastest riser with a projected 6.14% CAGR through 2031.
Which regions are most important in the Brazil kitchen appliances market today?
The Southeast holds 53.47% of the 2025 value and remains the largest region, while the Northeast is the fastest growing with a 6.62% CAGR through 2031.
How are energy labeling and standards shaping choices in the Brazil kitchen appliances market?
Stricter labeling and potential MEPS alignment encourage efficient models and clearer value from energy savings, which influences upgrade decisions and product development priorities.
Page last updated on:


 Your data is secure and never sold or shared.


