Market Overview
| Study Period | 2017 - 2030 |
|---|---|
| Base Year For Estimation | 2024 |
| Forecast Data Period | 2025 - 2030 |
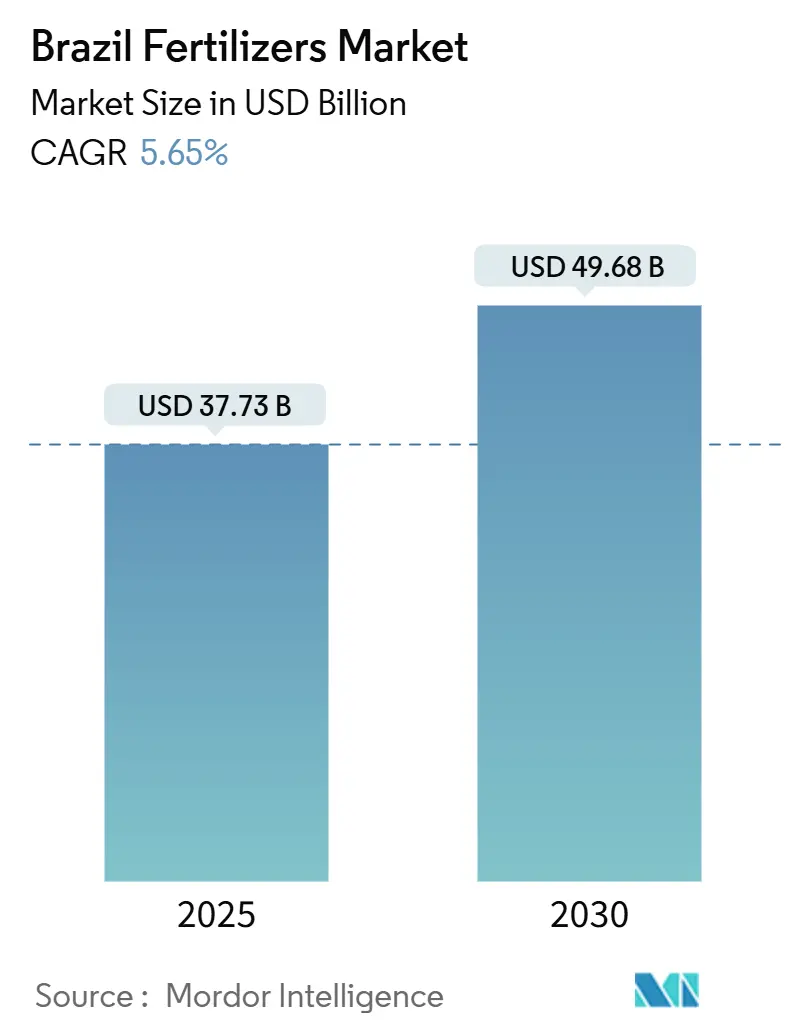
| Market Size (2025) | USD 37.73 Billion |
| Market Size (2030) | USD 49.68 Billion |
| Growth Rate (2025 - 2030) | 5.66% CAGR |
| Market Concentration | Low |
Major Players*Disclaimer: Major Players sorted in no particular order Image © Mordor Intelligence. Reuse requires attribution under CC BY 4.0. |
|
Brazil Fertilizers Market Analysis by Mordor Intelligence
The Brazil fertilizer market size reached USD 37.73 billion in 2025 and is forecasted to expand at a 5.66% CAGR, reaching USD 49.68 billion by 2030. Robust grain output, an import reliance for plant nutrients, and aggressive domestic capacity additions are the primary forces behind this trajectory. Record soybean production and expanding double-cropped corn acreage sustain year-round nutrient demand, while credit subsidies under Plano Safra strengthen farm input purchasing power. Supply chain diversification away from Russia toward Canada and Morocco is stabilizing potash and phosphate availability, and specialized blends that improve nutrient-use efficiency are gaining traction as environmental regulations tighten. Consolidation among producers, exemplified by Petrobras, ICL, and Mosaic, is reshaping competitive strategies even as digital farming tools shift procurement from bulk commodities to prescription-based solutions.
Key Report Takeaways
- By type, straight fertilizers led with 92.9% Brazil fertilizers market share in 2024; complex fertilizers are advancing at a 7.24% CAGR through 2030.
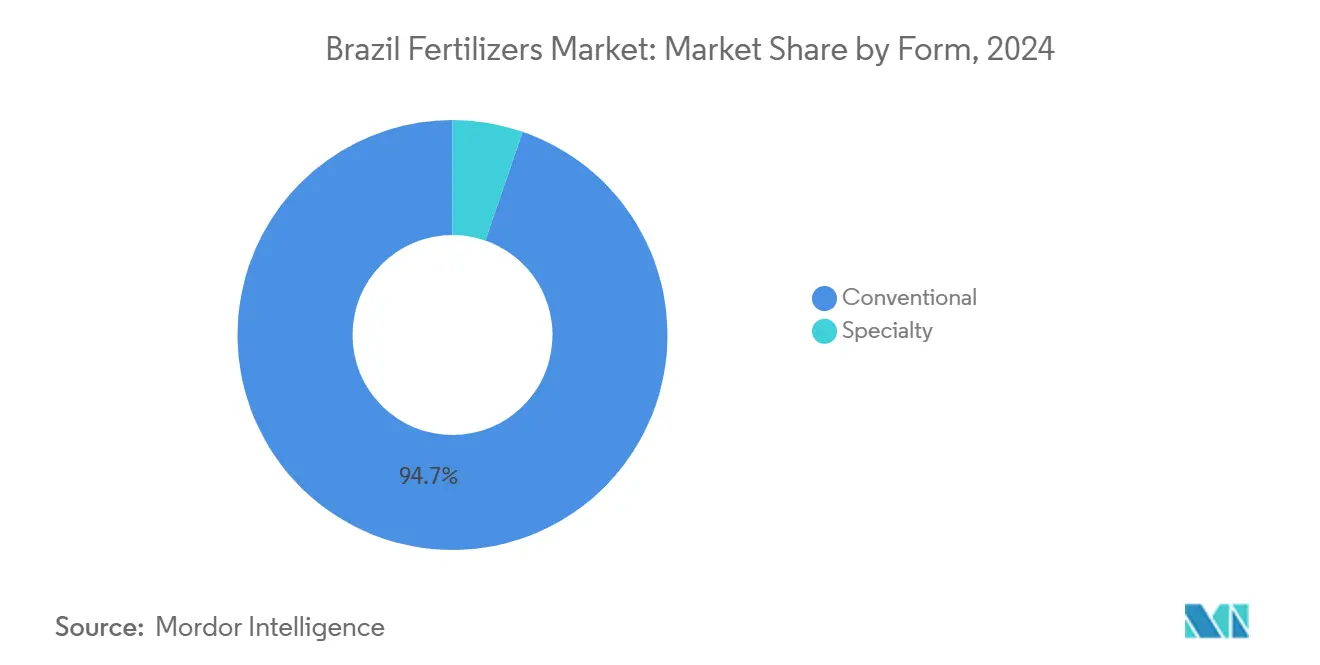
- By form, conventional products accounted for 94.8% share of the Brazil fertilizers market size in 2024, and specialty fertilizers are projected to expand at a 5.80% CAGR to 2030.
- By application mode, soil application held 94.9% of Brazil fertilizers market size in 2024, and fertigation is growing at a 5.90% CAGR through 2030.
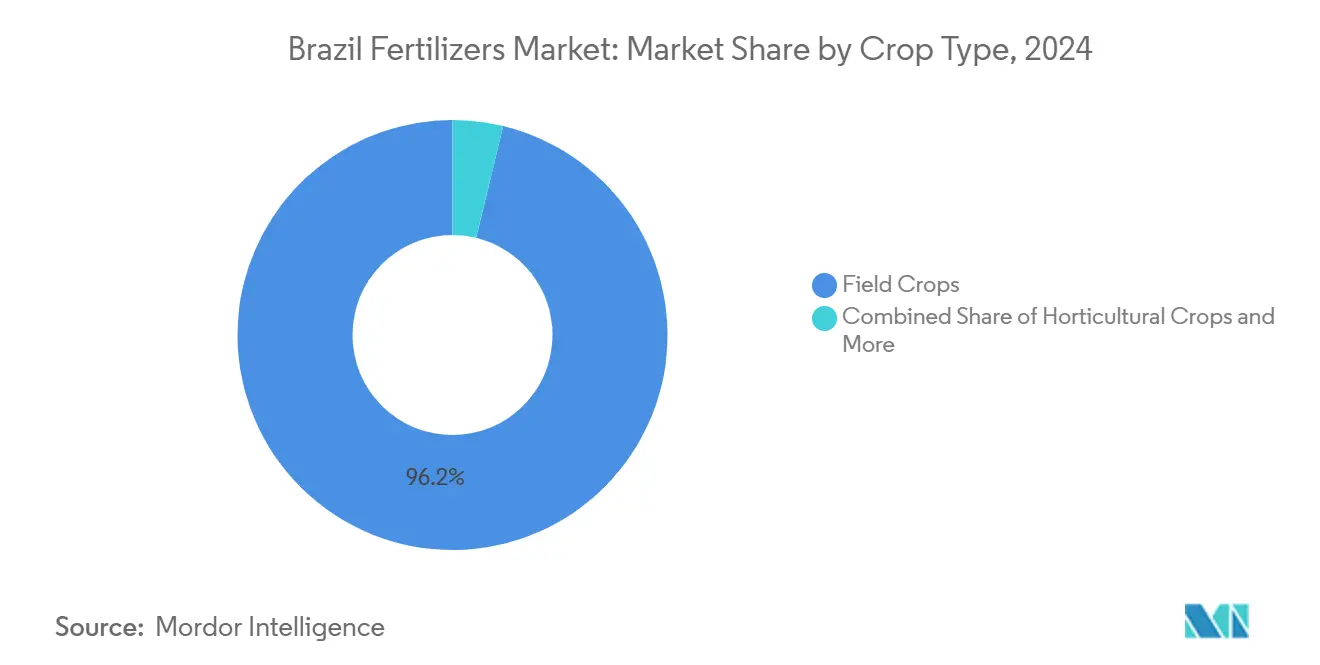
- By crop type, field crops commanded 96.2% of Brazil fertilizers market share in 2024 and are growing at a 5.70% CAGR through 2030.
Brazil Fertilizers Market Trends and Insights
Drivers Impact Analysis
| Driver | (~) % Impact on CAGR Forecast | Geographic Relevance | Impact Timeline |
|---|---|---|---|
| Rising global demand for cereals and oilseeds | +1.2% | National, concentrated in Mato Grosso, Paraná, and Goiás | Medium term (2-4 years) |
| Shift toward specialty fertilizers | +0.8% | National, with early gains in São Paulo, Paraná, and Mato Grosso | Long term (≥ 4 years) |
| Government subsidy programs in emerging economies | +0.9% | National, enhanced focus on the Northeast and the Center-West | Short term (≤ 2 years) |
| Precision agriculture led to micro-dosing practices | +0.7% | Center-West and South regions primarily | Medium term (2-4 years) |
| Carbon-credit incentives for low-emission fertilizers | +0.5% | National, with a concentration in sugarcane regions | Long term (≥ 4 years) |
| Biostimulant–fertilizer combinations gaining traction | +0.4% | National, led by soybean and corn production areas | Medium term (2-4 years) |
| Source: Mordor Intelligence | |||
Rising Global Demand for Cereals and Oilseeds
Brazil anchors global protein supply as the top soybean exporter and as a fast-growing corn shipper, so any uptick in Asian feed or vegetable-oil requirements quickly filters into nutrient demand. Mato Grosso alone contributes 28% of national soybean output, creating a logistics-centered fertilizer pull that improves scale economies for bulk importers. Corn plantings rose to 22.3 million hectares in 2024/25, and a widespread second-crop system sustains application across two calendar windows, smoothing seasonal volatility[1]Source: United States Department of Agriculture, “Crop Explorer Country Summary for Major Crop Regions – Brazil, Corn,” Foreign Agricultural Service, usda.gov. Export price premiums enlarge growers’ working-capital pools, allowing timely fertilizer purchases when global prices soften. Continuous grain rotations also intensify micronutrient depletion, boosting demand for zinc and boron products that complement primary NPK blends. Regional cooperatives increasingly leverage forward-purchase contracts to align fertilizer arrivals with harvest cash-flow peaks, reinforcing a virtuous cycle between export receipts and input spending.
Shift toward Specialty Fertilizers
Farmers now pursue nutrient-use efficiency as yields climb toward biome limits. Controlled-release granules and water-soluble liquids gain market share because they lower leaching losses and satisfy emerging watershed rules in São Paulo and Paraná. The specialty segment’s 5.90% CAGR, therefore, outpaces conventional demand by a wide margin, driven further by biological inoculants that unlock native soil nitrogen. Premium pricing is accepted because biological fixation saved an estimated high in synthetic nitrogen costs. Multinational suppliers respond by acquiring domestic innovators to blend microbes with coated NPKs, creating hybrid solutions marketed as “nutrient stewardship packages.”
Government Subsidy Programs in Emerging Economies
The "Plano Safra" is a Brazilian government initiative that provides financial support for agricultural and livestock production. The program allocated USD 65.5 billion in low-interest rural credit for 2024/25, with USD 12.7 billion designated for family farms. Concessional rates near 6% annually reduce working-capital friction and free cash for inputs. Credit cooperatives, often the sole lender in over 400 municipalities, accelerate fund disbursement and bundle fertilizer sales under input-financing schemes, broadening access beyond the traditional soybean heartland. Northeast states tapping irrigation projects under the Pro-Semiárido program, now channel fresh credit into drip-fed fruit crops that rely on soluble potassium nitrate. By cushioning price shocks and guaranteeing liquidity, subsidies lessen demand volatility even when international urea or MAP prices spike, supporting a steadier Brazil fertilizers market.
Precision-Agriculture Led Micro-Dosing Practices
Yield-mapping sensors, soil grids, and AI prescription platforms are transforming nutrient decisions from field averages to sub-hectare zones. Demonstration farms show productivity gains and fertilizer savings using variable-rate technology. Drone spraying, approved by the Ministry of Agriculture and Livestock, applies liquids at BRL 100-400 (USD 18-72) per hectare, making precision affordable to mid-size growers[2]Source: Embrapa, “Drones are viable option for farmers and service providers in Brazil,” embrapa.br. These tools stimulate demand for soluble and foliar products formulated for aerial delivery. Retailers adapt by stocking multi-pack micro-dosing kits instead of bulk truckloads, while software providers partner with fertilizer firms to embed nutrient algorithms into farm management dashboards.
Restraints Impact Analysis
| Restraint | (~) % Impact on CAGR Forecast | Geographic Relevance | Impact Timeline |
|---|---|---|---|
| Volatility in natural-gas and phosphate rock prices | -1.1% | National, with an acute impact on import-dependent regions | Short term (≤ 2 years) |
| Environmental regulations on nitrogen runoff | -0.6% | National, concentrated in water-sensitive areas | Medium term (2-4 years) |
| Supply-chain disruption risks from geopolitical shocks | -0.8% | National, particularly Northern Arc ports | Short term (≤ 2 years) |
| Farmer adoption gap for digital application tools | -0.4% | Rural areas with limited connectivity infrastructure | Long term (≥ 4 years) |
| Source: Mordor Intelligence | |||
Volatility in Natural-Gas and Phosphate-Rock Prices
Nitrogen fertilizer costs track international gas benchmarks, and phosphate FOB Morocco quotes feed directly into DAP and MAP invoices. Brazil, sourcing 8 5% of its nutrients abroad, remains a price-taker; a rapid gas rally in late 2024 lifted urea offers above USD 420 per metric ton, compressing farm margins before summer planting. Domestic producers cover only a small share of demand, so hedging tools are limited to importers with foreign-exchange credit lines. Freight surcharges linked to Red Sea tensions added USD 25 per metric ton on phosphate cargos in early 2025, exposing Mato Grosso growers to input shocks that co-op credit cannot fully absorb. Such volatility weighs on the near-term CAGR, although Petrobras’ planned nitrogen restarts could dilute import exposure later in the decade.
Environmental Regulations on Nitrogen Runoff
National Council for the Environment in Brazil (CONAMA ) resolutions mandate buffer strips and seasonal caps on nitrogen in priority basins such as the Piracicaba and Paraná rivers. Compliance audits performed by the Brazilian Institute of Environment and Renewable Natural Resources (IBAMA) levy an inspection fee that scales with excess application, pushing growers toward costlier controlled-release prills. São Paulo restricted autumn urea broadcast from 2024, encouraging split applications or urease inhibitors. Adoption costs for precision spreaders and soil nitrate sensors deter smaller operations, curbing conventional tonnage even as specialty demand rises.
Segment Analysis
By Type: Straight Fertilizers Retain Leadership amid Tailored-Blend Upswing
Straight formulations captured 92.9% of Brazil fertilizers market share in 2024, reflecting growers’ preference for single-nutrient precision that aligns with diverse soil prescriptions. Nitrogenous urea and ammonium nitrate remain the workhorses in corn and sugarcane rotations, whereas MAP and DAP fulfill phosphorus needs despite tight global supply. Within the Brazil fertilizers market size, complex blends are climbing at a 7.24% CAGR because variable-rate spreaders now calibrate multi-nutrient ratios on the fly, letting a single granule deliver balanced nutrition.
Crop consultants increasingly encourage site-specific mixes that address sulfur and boron deficiencies detected in Cerrado soils. Blenders respond by offering “N-P-K-S-B” packages labeled for region and crop, accelerating complex uptake. Yet the logistical convenience of straight fertilizers imported in Panamax lots, stored in inland terminals, and trucked in bulk preserves their cost advantage. The interplay of agronomic precision versus scale economics will define share movements through 2030, but straight products will likely keep a dominant majority as raw-material imports remain streamlined and price-competitive.
By Form: Conventional Products Dominate while Specialty Gains Momentum
Conventional fertilizers commanded 94.8% of the Brazil fertilizers market size in 2024, underpinned by established distribution chains and compatible farm machinery. Specialty products post a 5.86% CAGR as water-soluble powders and coated prills address efficiency and environmental targets. The Brazil fertilizers market increasingly values polymer-coated urea that slows volatilization, especially where urea prices have risen and nitrogen loss penalties have tightened.
Liquid formulations are another bright spot because fertigation acreage is rising in fruit and vegetable belts. Suppliers now pair micronutrient chelates with NPK liquids for homogenous tank-mixes that feed crops through growth peaks. Biological inoculants, registered across 37 crops, integrate into these solutions, creating multi-functional blends. Early adopters validate performance gains, prompting co-ops to stock refurbished mixing equipment to capture rising specialty margins, a trend likely to chip away at conventional share, albeit gradually.
Note: Segment shares of all individual segments available upon report purchase
Get Detailed Market Forecasts at the Most Granular Levels
Download PDF
By Application Mode: Soil Application Reigns yet Fertigation Accelerates
Broadcast and banded soil application held 94.9% share of Brazil fertilizers market in 2024, favored by large grain farms equipped with high-capacity spreaders. Even so, fertigation’s 5.91% CAGR indicates shifting agronomic practice in drought-prone Northeast valleys and high-value horticulture clusters. Drip and center-pivot systems now double as nutrient conduits, enabling smaller incremental doses aligned with evapotranspiration data.
Foliar routes, though niche, deliver quick micronutrient fixes and show promise when paired with drone application, which reached regulatory clearance in 2024. Service providers price drone spraying competitively, and liquid micronutrient suppliers formulate low-viscosity concentrates to match nozzle specs. These evolving delivery options encourage farmers to diversify away from single pre-plant applications, gradually redistributing volume across the season and influencing importer stocking cycles.
By Crop Type: Field Crops Anchor Demand while High-Value Niches Emerge
Field crops accounted for 96.2% of nutrient use in 2024 and are advancing at a 5.70% CAGR, cementing their centrality to the Brazil fertilizers market. Soybean acreage expansion in frontier municipalities and double-cropped corn intensity consume most nitrogen and phosphate imports. Sugarcane, though classified within field crops, presents distinct multi-year nutrient curves that favor split potassium and silicon applications.
Apart from grains, horticulture mangoes in Bahia, grapes in Rio Grande do Sul, and melons in Rio Grande do Norte demand high-analysis soluble products that sell at premium prices. Turf and ornamentals remain small yet profitable, underpinning specialty and micronutrient innovation. Although total tonnage remains grain-driven, these niche segments shape differentiated product portfolios, compelling suppliers to balance bulk logistics with tailor-made lines.
Note: Segment shares of all individual segments available upon report purchase
Get Detailed Market Forecasts at the Most Granular Levels
Download PDF
Geography Analysis
Fertilizer off-take mirrors Brazil’s crop geography. Mato Grosso absorbed 24.2% of deliveries in 2025, leveraging proximity to Northern Arc ports that moved a large share of fertilizers in 2024. The port shift cuts freight by up to USD 35 per metric ton relative to Santos, encouraging early bookings and higher import volumes. Paraná, Goiás, Rio Grande do Sul, and São Paulo collectively add another 45% share, forming a logistics corridor with abundant warehouses and rail links that sustain just-in-time deliveries.
Technology adoption diverges by region. Southern states, typified by smaller, intensively managed farms, lead the adoption of precision spreaders and coated fertilizers, spurred by stricter state water regulations. Center-West operations, operating on thousands of hectares, prioritize bulk urea and MAP metric tons but increasingly trial variable-rate towers to curb cost per bushel. The Northeast, traditionally fertilizer-light, becomes the fastest-growing pocket as irrigation projects unlock fruit exports; credit subsidies accelerate drip-fertilizer uptake.
The Amazon basin introduces sustainability complexity. Environmental licensing slows broad-acre expansion yet opens demand for biological and controlled-release products that satisfy low-impact criteria. Brazil Potash’s Autazes initiative, pending approval, could supply 20% of national potash needs from within Amazonas, slashing inland freight costs and reshaping north-bound trade flows. Collectively, these geographic dynamics ensure the Brazil fertilizers market evolves as a mosaic of localized demands rather than a single monolith.
Competitive Landscape
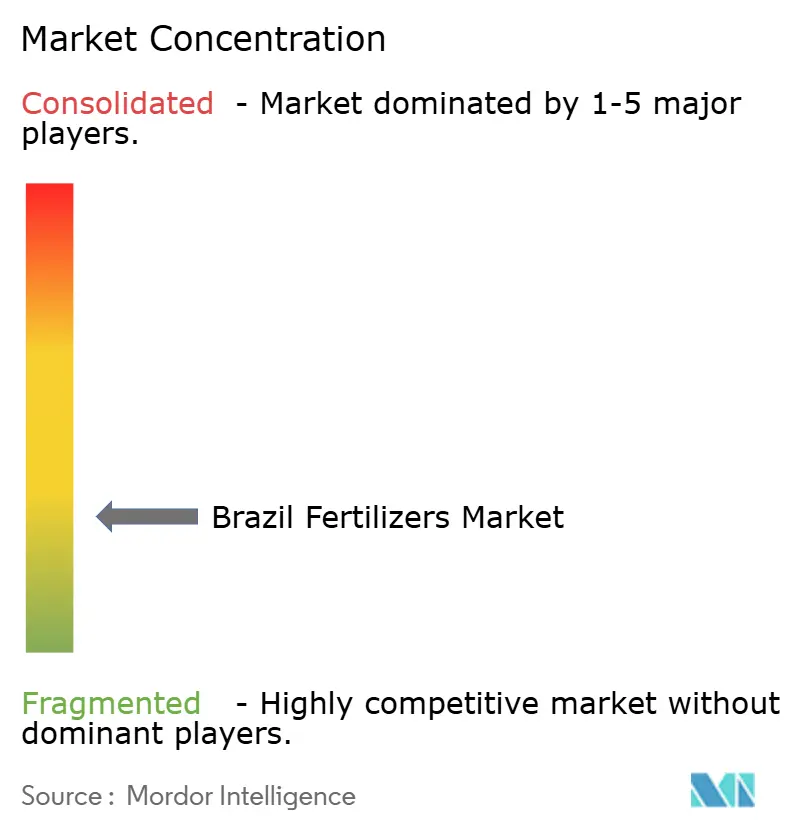
The Brazil fertilizers market remains fragmented despite rising consolidation moves. The Mosaic Company, Yara International ASA, Nutrien Ltd., Nortox, and ICL Group Ltd anchor imports and operate blending hubs near key ports, yet combined they hold significantly less share, leaving room for regional players and co-ops. ICL’s USD 420 million purchase of Compass Minerals’ South American business in April 2025 instantly doubled its local specialty capacity, signaling a pivot toward high-margin coated and soluble lines[3]Source: ICL Group, “ICL Completes Acquisition of Compass Minerals South American Plant Nutrition Business,” icl-group.com. Petrobras reinforces supply security by investing to bring dormant urea and ammonia plants back on stream by 2029, a strategic play that could recapture domestic nitrogen share.
Technology partnerships are the new battleground. Nutrien and Mosaic integrate agronomic advisory apps into loyalty programs, while Yara’s Atfarm platform links satellite imagery to variable-rate nitrogen recommendations. Distributors form joint ventures with input-financing fintechs, bundling credit and product to lock in volumes. Environmental compliance gains strategic weight; companies that can certify lower emission factors or offer CBIO-eligible products differentiate themselves in bidding rounds with ethanol mills. The race for rail-side storage near Northern Arc ports further intensifies competition, as bulk importers seek to guarantee berth access and shorten inland truck hauls.
As specialty penetration rises, niche innovators command acquisition premiums. Domestic firm Fertiláqua, acquired in 2024, brings biostimulant know-how that multinationals fold into global portfolios. Meanwhile, cooperatives such as Coamo and Cocamar extend private-label fertilizers, leveraging farmer allegiance to retain margin in the value chain. Taken together, the industry heads toward a moderately concentrated structure where scale and technology weave together to raise barriers for late entrants.
Brazil Fertilizers Industry Leaders
-
ICL Group Ltd
-
Nortox
-
Nutrien Ltd.
-
The Mosaic Company
-
Yara International ASA
- *Disclaimer: Major Players sorted in no particular order
Need More Details on Market Players and Competitors?
Download PDF
Recent Industry Developments
- October 2024: Eurochem Group invested BRL 185 million (USD 33.3 million) in storage capacity expansion across Brazil, enhancing supply chain resilience and enabling more efficient seasonal inventory management for imported fertilizer products.
- June 2024: Petrobras confirmed the restart of its ANSA fertilizer plant after completing a rehabilitation program. This restart increases Brazil's domestic nitrogen production capacity and reduces its dependence on urea and ammonia imports.
- April 2024: Brazil Potash Corporation advanced environmental licensing procedures for the Autazes potash project in Amazonas, representing a potential game-changer for Brazil's potash import dependency with estimated production capacity targeting 20% of global market share.
Brazil Fertilizers Market Report Scope
Complex, Straight are covered as segments by Type. Conventional, Speciality are covered as segments by Form. Fertigation, Foliar, Soil are covered as segments by Application Mode. Field Crops, Horticultural Crops, Turf & Ornamental are covered as segments by Crop Type.
Type
| Complex | ||
| Straight | Micronutrients | Boron |
| Copper | ||
| Iron | ||
| Manganese | ||
| Molybdenum | ||
| Zinc | ||
| Others | ||
| Nitrogenous | Ammonium Nitrate | |
| Urea | ||
| Others | ||
| Phosphatic | DAP | |
| MAP | ||
| SSP | ||
| TSP | ||
| Others | ||
| Potassic | MoP | |
| SoP | ||
| Others | ||
| Secondary Macronutrients | Calcium | |
| Magnesium | ||
| Sulfur | ||
Form
| Conventional | |
| Specialty | CRF |
| Liquid Fertilizer | |
| SRF | |
| Water Soluble |
Application Mode
| Fertigation |
| Foliar |
| Soil |
Crop Type
| Field Crops |
| Horticultural Crops |
| Turf & Ornamental |
| Type | Complex | ||
| Straight | Micronutrients | Boron | |
| Copper | |||
| Iron | |||
| Manganese | |||
| Molybdenum | |||
| Zinc | |||
| Others | |||
| Nitrogenous | Ammonium Nitrate | ||
| Urea | |||
| Others | |||
| Phosphatic | DAP | ||
| MAP | |||
| SSP | |||
| TSP | |||
| Others | |||
| Potassic | MoP | ||
| SoP | |||
| Others | |||
| Secondary Macronutrients | Calcium | ||
| Magnesium | |||
| Sulfur | |||
| Form | Conventional | ||
| Specialty | CRF | ||
| Liquid Fertilizer | |||
| SRF | |||
| Water Soluble | |||
| Application Mode | Fertigation | ||
| Foliar | |||
| Soil | |||
| Crop Type | Field Crops | ||
| Horticultural Crops | |||
| Turf & Ornamental | |||
Need A Different Region or Segment?
Customize Now
Market Definition
- MARKET ESTIMATION LEVEL - Market Estimations for various types of fertilizers has been done at the product-level and not at the nutrient-level.
- NUTRIENT TYPES COVERED - Primary Nutrients: N, P and K, Secondary Macronutrients: Ca, Mg and S, Micronutients: Zn, Mn, Cu, Fe, Mo, B, and Others
- AVERAGE NUTRIENT APPLICATION RATE - This refers to the average volume of nutrient consumed per hectare of farmland in each country.
- CROP TYPES COVERED - Field Crops: Cereals, Pulses, Oilseeds, and Fiber Crops Horticulture: Fruits, Vegetables, Plantation Crops and Spices, Turf Grass and Ornamentals
| Keyword | Definition |
|---|---|
| Fertilizer | Chemical substance applied to crops to ensure nutritional requirements, available in various forms such as granules, powders, liquid, water soluble, etc. |
| Specialty Fertilizer | Used for enhanced efficiency and nutrient availability applied through soil, foliar, and fertigation. Includes CRF, SRF, liquid fertilizer, and water soluble fertilizers. |
| Controlled-Release Fertilizers (CRF) | Coated with materials such as polymer, polymer-sulfur, and other materials such as resins to ensure nutrient availability to the crop for its entire life cycle. |
| Slow-Release Fertilizers (SRF) | Coated with materials such as sulfur, neem, etc., to ensure nutrient availability to the crop for a longer period. |
| Foliar Fertilizers | Consist of both liquid and water soluble fertilizers applied through foliar application. |
| Water-Soluble Fertilizers | Available in various forms including liquid, powder, etc., used in foliar and fertigation mode of fertilizer application. |
| Fertigation | Fertilizers applied through different irrigation systems such as drip irrigation, micro irrigation, sprinkler irrigation, etc. |
| Anhydrous Ammonia | Used as fertilizer, directly injected into the soil, available in gaseous liquid form. |
| Single Super Phosphate (SSP) | Phosphorus fertilizer containing only phosphorus which has lesser than or equal to 35%. |
| Triple Super Phosphate (TSP) | Phosphorus fertilizer containing only phosphorus greater than 35%. |
| Enhanced Efficiency Fertilizers | Fertilizers coated or treated with additional layers of various ingredients to make it more efficient compared to other fertilizers. |
| Conventional Fertilizer | Fertilizers applied to crops through traditional methods including broadcasting, row placement, ploughing soil placement, etc. |
| Chelated Micronutrients | Micronutrient fertilizers coated with chelating agents such as EDTA, EDDHA, DTPA, HEDTA, etc. |
| Liquid Fertilizers | Available in liquid form, majorly used for application of fertilizers to crops through foliar and fertigation. |
Need More Details on Market Definition?
Ask a Question
Research Methodology
Mordor Intelligence follows a four-step methodology in all our reports.
- Step-1: IDENTIFY KEY VARIABLES: In order to build a robust forecasting methodology, the variables and factors identified in Step-1 are tested against available historical market numbers. Through an iterative process, the variables required for market forecast are set and the model is built on the basis of these variables.
- Step-2: Build a Market Model: Market-size estimations for the forecast years are in nominal terms. Inflation is not a part of the pricing, and the average selling price (ASP) is kept constant throughout the forecast period for each country.
- Step-3: Validate and Finalize: In this important step, all market numbers, variables and analyst calls are validated through an extensive network of primary research experts from the market studied. The respondents are selected across levels and functions to generate a holistic picture of the market studied.
- Step-4: Research Outputs: Syndicated Reports, Custom Consulting Assignments, Databases & Subscription Platforms

Get More Details On Research Methodology
Download PDF


