
Market Overview
| Study Period | 2020 - 2031 |
|---|---|
| Forecast Data Period | 2026 - 2031 |
| Base Year Market Size (2025) | USD 52.01 Billion |
| Market Size (2026) | USD 54.76 Billion |
| Market Size (2031) | USD 68.84 Billion |
| Growth Rate (2026 - 2031) | 4.68 % |
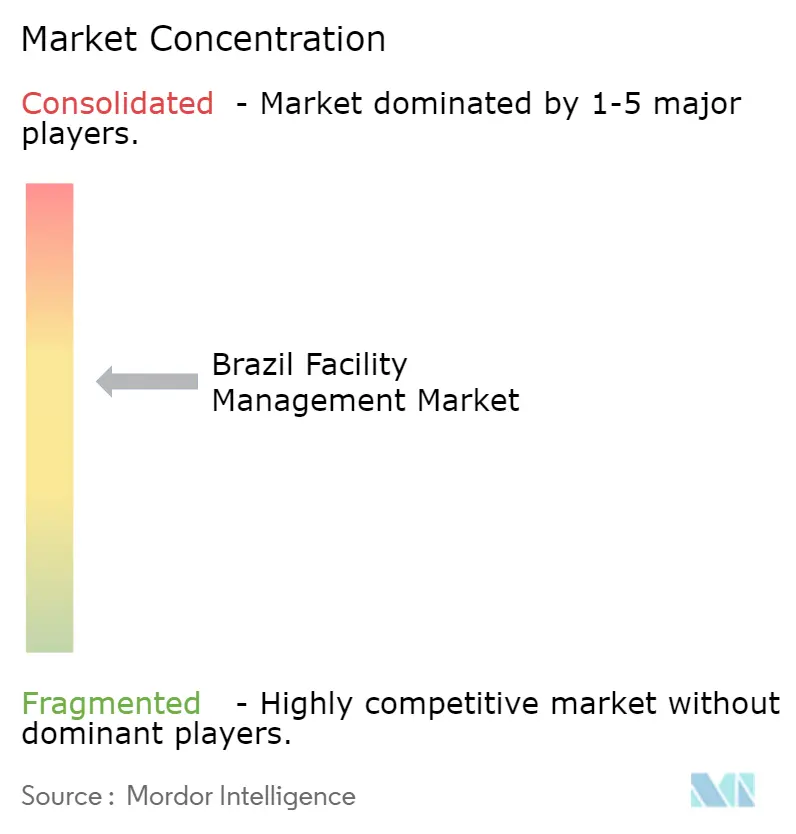
| Market Concentration | Medium |
Major Players *Disclaimer: Major Players sorted in no particular order Image © Mordor Intelligence. Reuse requires attribution under CC BY 4.0. | |
Brazil Facility Management Market Analysis by Mordor Intelligence
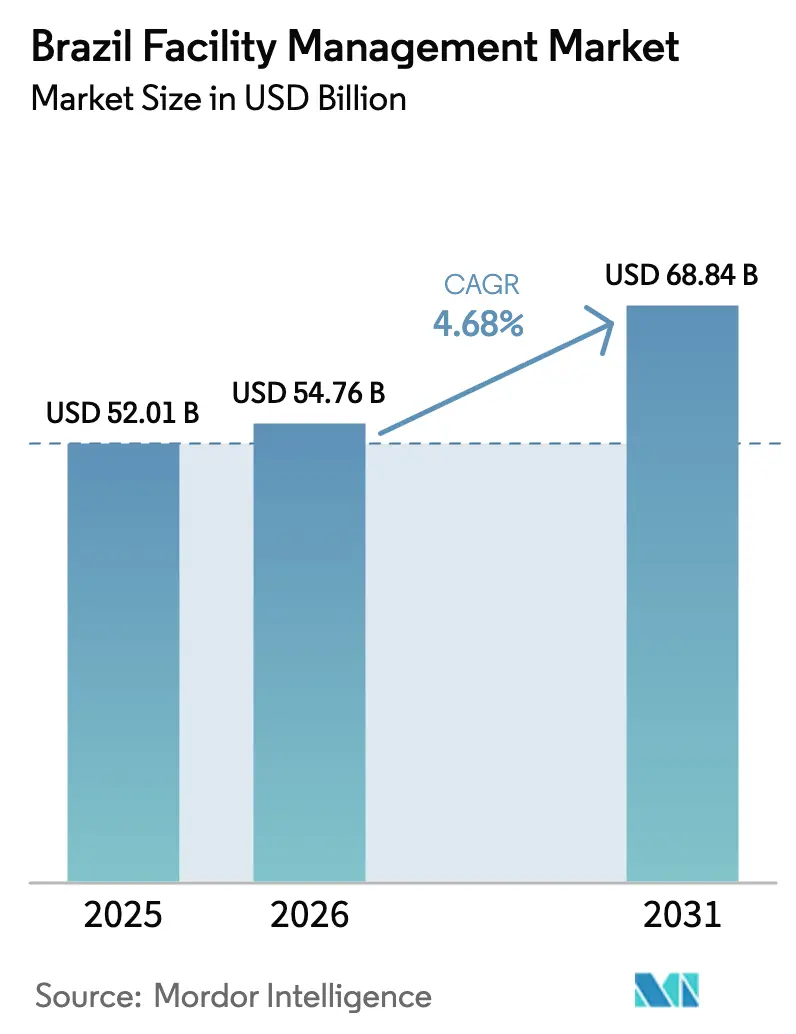
The Brazil facility management market size is projected to expand from USD 52.01 billion in 2025 and USD 54.76 billion in 2026 to USD 68.84 billion by 2031, registering a CAGR of 4.68% between 2026 and 2031. Organizations are shifting real-estate risk off balance sheets, while the federal PAC program channels capital into public-private partnerships that embed multi-decade facility obligations. Demand is also expanding as data-center developers outsource non-core functions to preserve uptime guarantees, and as sustainability investors insist on ISO-aligned building operations. Integrated platforms that fuse IoT sensors, AI analytics, and BIM models are therefore evolving from optional add-ons into baseline tender criteria, especially in São Paulo and Rio de Janeiro. Mid-sized regional contractors are responding by forming alliances with global technology firms to keep pace with multinationals that already run predictive maintenance globally.
Key Report Takeaways
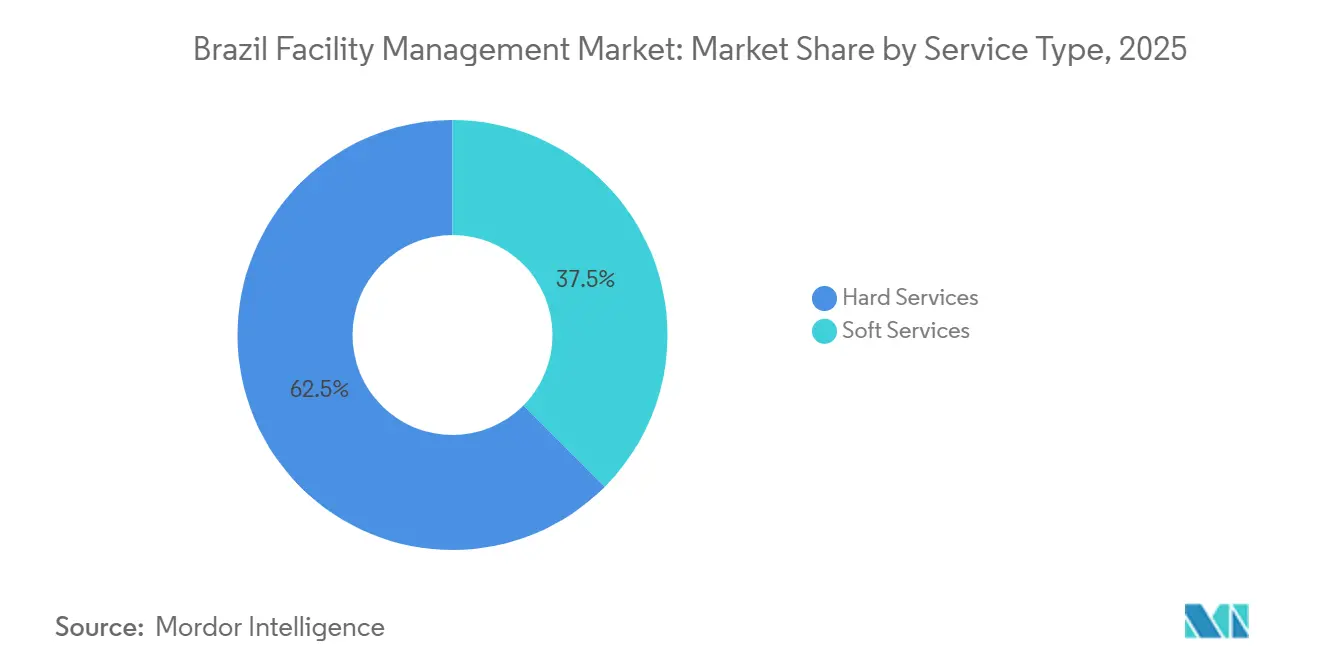
- By service type, hard services led with 62.54 % of the Brazil facility management market share in 2025. Soft services are forecast to expand at a 5.26 % CAGR through 2031.
- By offering, in-house delivery commanded 54.43 % of the Brazil facility management market size in 2025. Outsourced models are projected to grow at a 5.01 % CAGR over 2026-2031.
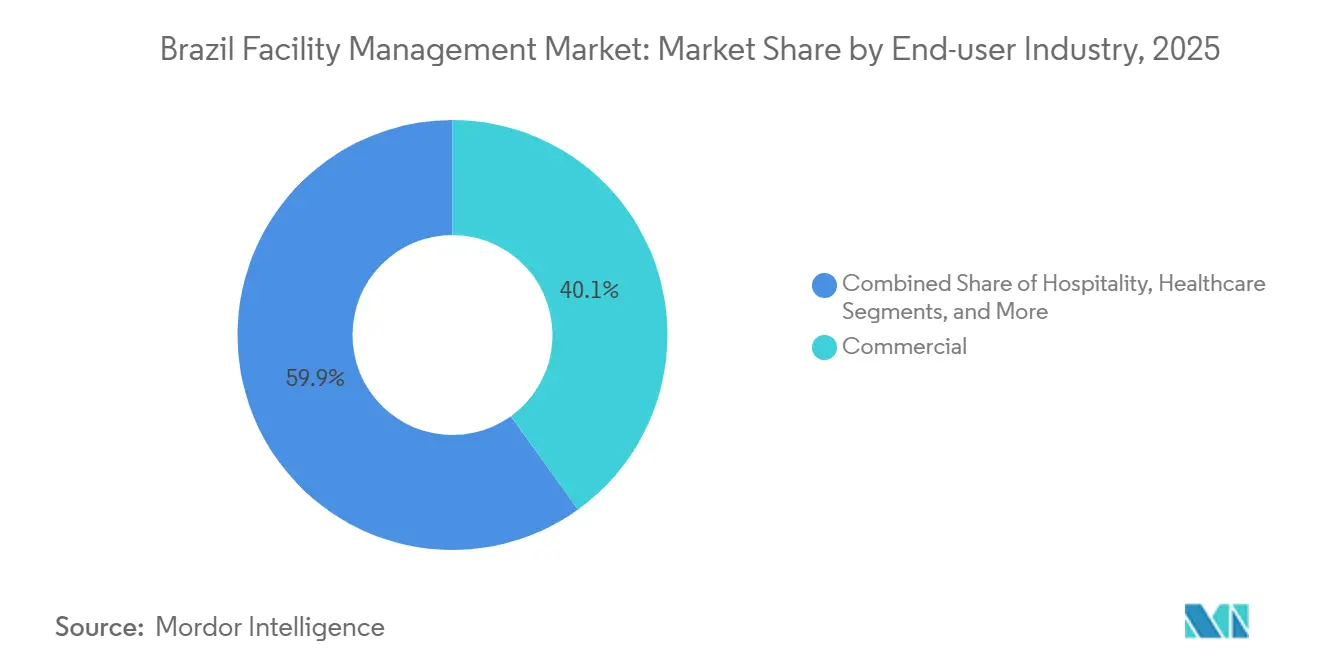
- By end-user, commercial buildings held 40.07 % of 2025 revenue, whereas institutional and public infrastructure is advancing at a 5.37 % CAGR to 2031.
Note: Market size and forecast figures in this report are generated using Mordor Intelligence’s proprietary estimation framework, updated with the latest available data and insights as of 2026.
Brazil Facility Management Market Trends and Insights
Drivers Impact Analysis*
| Driver | (~) % Impact on CAGR Forecast | Geographic Relevance | Impact Timeline |
|---|---|---|---|
| Accelerating Outsourcing of Non-Core Operations | +1.2% | National, concentrated in São Paulo, Rio de Janeiro, Brasília | Medium term (2-4 years) |
| Digitalization via IoT, AI and BIM in Facility Management | +0.9% | São Paulo, Rio de Janeiro, Belo Horizonte with spillover to Curitiba and Porto Alegre | Long term (≥ 4 years) |
| Public-Private Infrastructure Pipeline (PAC) | +1.5% | National, priority corridors in Southeast and Northeast | Long term (≥ 4 years) |
| Surge in Hyperscale and Edge Data-Center Builds | +0.7% | São Paulo metro, Rio de Janeiro, Campinas | Medium term (2-4 years) |
| ESG-Linked Investor Pressure on Building Operations | +0.5% | National, led by São Paulo and Rio de Janeiro corporate districts | Medium term (2-4 years) |
| Green Tax-Incentives for Energy-Efficient Retrofits | +0.3% | National, higher uptake in São Paulo and Rio de Janeiro | Short term (≤ 2 years) |
| Source: Mordor Intelligence | |||
Accelerating Outsourcing of Non-Core Operations
Corporations continue to convert fixed labor into variable service contracts, guided by benchmarks that show 15-20 % savings versus in-house teams. Sodexo’s 2025 expansion of self-service micro-markets, from 70 to 190 units, illustrates how bundled catering and cleaning can shrink on-site payroll while lifting revenue per square meter. The 2024 exit of Compass Group and subsequent GRSA sale to GPS underline margin pressure on single-line soft-service providers, but also signal confidence that bundled offerings yield cross-sell gains. Outsourcing penetration still trails the 65-70 % seen in the United Kingdom and United States, leaving a sizeable runway. Mid-market firms and public entities now issue integrated RFQs that consolidate hard and soft scopes, accelerating the shift.
Digitalization Via IoT, AI And BIM
Building-management systems are evolving from reactive logs into predictive platforms that trim energy use and unplanned downtime. Siemens and CPFL Energia’s plan to install 1.6 million smart meters by 2029 will feed real-time load data into AI algorithms that flag HVAC anomalies before failure.[1]“Siemens and CPFL Energia Partner on 1.6 Million Smart Meters in Brazil,” Siemens, press.siemens.com JLL’s integration of IBM Maximo, TRIRIGA and Envizi across 4 million m² lets owners track asset health, space utilization and carbon metrics in a single dashboard.[2]“JLL Brazil Management Platform Integrates IBM Technologies,” JLL, jll.com Federal BIM mandates on projects above BRL 20 million (USD (3.9 million) force engineering firms and facility managers to adopt model-based workflows. Early adopters report 8-12 % maintenance cost cuts, validating the ROI narrative. As hardware prices fall, smaller portfolios in Curitiba and Porto Alegre begin to follow São Paulo’s lead.
Public-Private Infrastructure Pipeline (PAC)
Brazil’s BRL 1.7 trillion (USD 0.32 trillion) PAC program funnels capital into highways, hospitals and schools, each concession embedding 25-30 year facility management obligations that shift maintenance risk to private consortia.[3]Brazilian Government, “PAC - Programa de Aceleração do Crescimento,” gov.br The February 2025 announcement of BRL 15.4 billion (USD 3 billion) hospital and school PPPs, along with the BRL 4.7 billion (USD 0.9 billion) São Paulo state headquarters project, created a backlog of multi-decade service contracts requiring ANVISA and ISO 14001 compliance. Providers with balance-sheet capacity and certified staff therefore enjoy preferred-bidder status. Because banks underwrite project finance only when operating risks are off-loaded, integrated facility specialists gain negotiating leverage. As more states replicate the PAC template, long-run demand visibility strengthens, underpinning the sector’s growth outlook.
Surge in Hyperscale and Edge Data-Center Builds
Cloud-service and colocation firms pour capital into campuses near Sao Paulo, Rio de Janeiro, and Campinas. GLP Brazil’s 2025 package exceeds BRL 1.6 billion (USD 0.3 billion) and links logistics hubs and edge nodes that need 24/7 uptime.[4]“Cushman & Wakefield Manages 600,000 sqm in Golgi Logistics Condominiums,” Cushman & Wakefield, cushmanwakefield.com Data centers sign integrated contracts that bundle MEP, fire-safety, security and cleaning under strict uptime SLAs with financial penalties for outages. These sites also adopt continuous monitoring, driving demand for sensors and predictive analytics platforms. Facility firms able to supply certified electrical engineers and 24/7 response teams capture premium fees. Spillover investment into edge nodes within logistics parks broadens geographic opportunity, even as talent shortages constrain the build-out pace.
Restraints Impact Analysis*
| Restraint | (~) % Impact on CAGR Forecast | Geographic Relevance | Impact Timeline |
|---|---|---|---|
| Shrinking Provider Margins amid Wage Inflation | -0.8% | National, Acute in São Paulo, Rio de Janeiro, Brasília | Short Term (≤ 2 Years) |
| Shortage of Certified Technical Labor | -0.6% | National, Most Severe Outside São Paulo and Belo Horizonte | Medium Term (2–4 Years) |
| High Import Tariffs on Smart-Building Equipment | -0.4% | National, Impacting Technology-Intensive Integrated Management | Medium Term (2–4 Years) |
| Persistent Commercial Vacancy Outside Tier-1 Metros | -0.3% | Secondary Cities: Recife, Fortaleza, Manaus, Cuiabá | Short Term (≤ 2 Years) |
| Source: Mordor Intelligence | |||
Shrinking Provider Margins Amid Wage Inflation
A 7.5 % federal minimum-wage jump that took effect in January 2025 squeezed soft-service margins because many contracts lacked automatic escalators. Labor accounts for up to 70 % of cleaning, catering and security costs, so providers either renegotiate scope or absorb the hit. Larger firms deploy robotic floor scrubbers and self-checkout food kiosks to mute payroll growth, but capital constraints limit adoption among regional players. Clients resistant to mid-contract price hikes sometimes accept reduced service frequency, denting satisfaction scores. Until inflation clauses become standard, profitability remains vulnerable to further wage actions.
Shortage of Certified Technical Labor
Demand for HVAC technicians, fire-safety engineers and automation specialists outstrips supply, delaying commissioning by three to six months in secondary metros. Training agency SENAI expanded apprenticeship slots, yet graduation volumes still fall short of project backlogs. Employers bid up pay 20-30 % above general facility grades, eroding contract margins. Some providers shuttle crews between cities, raising travel costs and fatigue risk. Without a near-term talent pipeline surge, staffing gaps will continue to cap growth in capital-intensive hard services.
*Our forecasts treat driver/restraint impacts as directional, not additive. The impact forecasts reflect baseline growth, mix effects, and variable interactions.
Segment Analysis
By Service Type: Hard Services Anchor Revenue, Soft Services Accelerate
Hard services captured 62.54 % of the Brazil facility management market share in 2025, reflecting heavy investment in chiller overhauls, electrical-panel upgrades, and fire-safety retrofits. Asset owners in Sao Paulo’s 1980s towers and Rio de Janeiro’s seaside hotels prioritize these capital-intensive tasks to cut energy bills and satisfy tightened municipal codes. MEP and HVAC remain the largest sub-segment but face technician shortages that inflate overtime costs. Fire-systems work, while smaller, rises the fastest following ANVISA’s December 2025 manual that shortens inspection cycles.
Soft services, ranging from security to catering, will expand at a 5.26 % CAGR through 2031, overtaking hard-service growth. Post-pandemic hygiene rules make daily disinfection standard in hospitals and food plants, while AI video analytics let owners cut guard posts without raising risk. Sodexo’s self-serve micro-markets illustrate how automation can offset wage escalation by boosting revenue per square meter.


By Offering Type: Outsourced Models Gain Share
In-house teams held 54.43 % of the Brazil facility management market size in 2025, a legacy of government entities and industrial majors valuing direct control. Yet outsourced models, single, bundled, and integrated, are set to grow at 5.01 % CAGR as corporate treasurers spotlight non-core labor. Single contracts still dominate small enterprises, but mid-caps now migrate to bundled or integrated packages that promise 10-15 % operational savings.
Integrated facility management is the fastest-rising sub-segment because it unifies SLAs across hard and soft lines, which hyperscale data-centers and hospital PPPs require for 24/7 uptime. JLL’s 4 million m² Brazil platform serves as a proof point, coupling Maximo asset tracking, TRIRIGA space analytics, and Envizi carbon dashboards so clients see real-time performance on one screen. Bundled deals appeal to companies easing out of in-house structures but still wanting vendor diversity.
By End-User Industry: Institutional Surge Reshapes Demand
Commercial buildings commanded 40.07 % of 2025 revenue, but high vacancy in secondary districts tempers growth. Logistics and data-center assets buck the trend, drawing record capital and long-term maintenance contracts. Institutional and public-infrastructure sites will post the quickest expansion at a 5.37 % CAGR as PPPs worth billions of reals close financing and impose stringent uptime and sustainability clauses.
Hospitals now demand ANVISA-aligned hygiene, waste, and fire-safety regimes, creating barriers for generalist firms. Industrial plants seek predictive maintenance to ward off unplanned outages, while hospitality venues adopt variable-cost engineering to stabilize cash flows. Outcome-based models that tie payment to energy savings or satisfaction scores emerge across sectors, though metrics standardization still evolves.

Geography Analysis
Southeast Brazil, home to Sao Paulo, Rio de Janeiro, Belo Horizonte, and Campinas, generates roughly 55-60 % of national revenue. Sao Paulo alone hosts over 30 % of domestic data-center capacity and remains the launchpad for IoT-centric projects. Rio de Janeiro relies on hospitality and oil-and-gas clusters, obliging complex MEP tasks in aging seafront towers. Belo Horizonte and Campinas lure manufacturers seeking supply-chain diversification away from Sao Paulo congestion.
The South (Paraná, Santa Catarina, Rio Grande do Sul) grows above the national average thanks to agribusiness logistics and automotive assembly. Smart-city pilots in Curitiba and Porto Alegre integrate traffic, energy, and security, opening niches for IoT-savvy providers. The Northeast attracts PAC-led hospital and highway PPPs but struggles with office and retail vacancy beyond capital cities, capping near-term spend. North and Central-West demand centers on airports, mining, and government offices; yet low urbanization and sparse training facilities slow penetration.
Regulatory variance adds complexity. National ANVISA rules coexist with municipal fire codes, so compliance checklists differ by city. Labor inspectors audit more often in Sao Paulo than in interior states, escalating documentation workloads for multi-region operators. Execution risk around PPPs rises in fiscally weaker Northeast and North states where renegotiations happen more often.
Regulatory Landscape
Brazil facility management operations sit under a multi-layer compliance stack that blends building-maintenance standards, health and safety rules for regulated environments (especially healthcare), and an expanding set of digital and energy-efficiency obligations tied to connected buildings. ABNT NBR 5674 (2024 update) continues to anchor maintenance-system governance for buildings, while ANVISA-driven requirements raise the compliance bar in hospitals, reinforced by the December 2025 ANVISA manual that tightened fire-suppression and inspection routines in health facilities.
Digitalization in FM is increasingly influenced by telecom and data-governance regulation as sites adopt IoT and remote monitoring. Anatel advanced its 2025-2026 regulatory agenda to address AI use and to update cybersecurity rules across the telecommunications value chain, and Anatel Resolution No. 777/2025 (RGST) supports service delivery via any appropriate technology, shaping how FM providers manage on-site connectivity and service assurance. On sustainability and energy performance, Inmetro’s INI-C labeling framework for commercial, service, and public buildings and CGIEE Resolution No. 4/2025 mandating minimum energy-efficiency levels for new buildings push owners and FM vendors toward auditable controls over HVAC, lighting, and related automation, which increases demand for metering, monitoring, and documented operating procedures.
Value Chain Analysis
The Brazil facility management value chain starts with inputs such as labor (HVAC, electrical, fire-safety, and soft-service teams), consumables (cleaning chemicals, PPE, catering supplies), and imported or locally sourced building systems (BMS, sensors, controls, and critical spares). Technology and compliance content increasingly sit upstream as differentiators, including CMMS/CAFM platforms, BIM-enabled asset data for projects above the BRL 20 million threshold, and energy-performance documentation aligned with INI-C labeling and related efficiency requirements. International FM groups (CBRE, JLL, Cushman and Wakefield, Sodexo) and regional players (GPS Group, Brasanitas, ENGIE Servicos) typically coordinate specialist subcontractors for MEP, fire systems, security, and waste handling, while hard services dominate revenue due to the capital intensity of retrofits and uptime-critical environments.
Procurement and delivery follow a split channel. Long-duration bundled or integrated FM contracts (PPPs, hospitals, data centers, and large commercial portfolios) run through structured RFPs and SLA frameworks, while tactical services and tail-spend increasingly flow through digital purchasing and vendor-management platforms such as oHub, Bionexo, and Mercado Eletronico. Downstream, owners and occupiers emphasize outcomes (uptime, safety, energy, and ESG reporting), which increases reliance on connected workflows from technician dispatch to audit trails. Cushman and Wakefield’s wearable-device initiative in Brazil ties field execution to remote specialists for inspections and thermographic analyses in critical facilities. Key bottlenecks remain certified technical labor availability and the integration burden across OT/IT, cybersecurity, and multi-site reporting, which shapes partnering between FM firms and technology providers.
Competitive Landscape
Five international groups, CBRE, Jones Lang LaSalle, Cushman and Wakefield, Sodexo, and the Brazil division formerly owned by ISS,capture an estimated 35-40 % of revenue, leaving space for regionals like GPS Group, Brasanitas, and ENGIE Serviços. Technology now shapes bids more than headline price. CBRE’s 2024 takeovers of J&J Worldwide Services and Direct Line Global added healthcare and data-center depth, signaling a pivot to verticals that prize continuous uptime. JLL’s IBM-powered suite differentiates through unified dashboards that diminish manual data work.
Regional challengers defend niches: Brasanitas in healthcare, ENGIE Serviços in energy retrofits, and Leadec in automotive production lines. Their deep domain know-how and local relationships reduce churn despite the wider scale of multinationals. ISS’s 2020 exit and Compass Group’s 2024 departure show that margins can shrink below corporate thresholds when wage hikes are mis-priced. Conversely, GPS’s GRSA acquisition highlights confidence that bundled contracts yield cross-sell gains, cushioning wage shocks.
Outcome-based models gain traction, with clients rewarding energy savings and uptime rather than task counts. Yet measurement accuracy concerns, plus provider hesitation to assume inflation risk, delay mainstream adoption. Robotic scrubbers, AI video analytics, and self-serve food kiosks promise labor offsets, but capex hurdles keep deployments skewed to Sao Paulo and Rio de Janeiro spearhead projects.
Brazil Facility Management Industry Leaders
CBRE Group, Inc.
GPS Group
Sodexo Group
Jones Lang LaSalle IP, Inc. (JLL)
Cushman and Wakefield PLC
- *Disclaimer: Major Players sorted in no particular order

Market Opportunities and Future Outlook
Whitespace is expanding around technology-led integrated FM that can deliver auditable performance in regulated and uptime-critical estates. Data centers and multi-site infrastructure owners are operationalizing remote monitoring, alerting, and standardized asset workflows, creating room for providers that bundle MEP, fire-safety, security, and cleaning under a single SLA while integrating CMMS/CAFM, IoT telemetry, and BIM-based asset data. In March 2026, Cushman and Wakefield launched a wearable device pilot in Brazil to connect field technicians with remote specialists for maintenance and process optimization, showing a shift toward instrumenting frontline work rather than relying purely on labor-based delivery.
A second opportunity area is the convergence of facility operations with telecom infrastructure management and cyber-resilience as more buildings incorporate pervasive connectivity and edge compute. In March 2026, Brasil TecPar and IBM launched a cognitive operations center using AI and IBM Maximo to integrate operations across 57 regional operators and more than 3,300 network sites. This proof point indicates that centralized, AI-assisted asset operations are being scaled in-country and can extend to facilities with distributed critical assets. Public-sector and consortium procurement is also tightening around digital control of FM execution: COMGRANBEL issued a May 2026 tender for integrated facilities management that explicitly required a computerized facilities management system (SGF) to manage operations, maintenance, and technology, reinforcing demand for providers that can deliver both service execution and systems of record for compliance, budgeting, and reporting.
Recent Industry Developments
- July 2026: UFRRJ extended its maintenance contract with Aeon Facility Management S/A for 12 months and formalized prior value readjustments. The extension keeps continuity of planned preventive maintenance and compliance routines across campus facilities, and it underscores the role of structured FM contracts in public-institution estates where budget and service scope need periodic rebalancing.
- December 2025: ANVISA released a manual for health-use materials registration that tightened fire-suppression checks and related inspection routines inside hospitals. The update raises the compliance workload for healthcare FM providers and increases demand for documented testing, certified technicians, and integrated reporting across life-safety systems.
- September 2024: AWS committed USD 1.8 billion to enlarge data-center capacity in Brazil. The investment expands the installed base of uptime-critical facilities that typically outsource bundled MEP, safety, security, and monitoring services under strict SLAs, amplifying demand for integrated and technology-enabled FM delivery.


Research Methodology Framework and Report Scope
Market Definition and Coverage
This market covers the value of facility management services delivered for buildings and sites in Brazil, including day to day operational support and technical upkeep that keep facilities safe, compliant, and functional.
Scope exclusions: We exclude new building construction and one time major renovation projects, even if a service provider also offers facility services.
Segmentation Overview
- By Service Type
- Hard Services
- Asset Management
- MEP and HVAC Services
- Fire Systems and Safety
- Other Hard Facility Management Services
- Soft Services
- Office Support and Security
- Cleaning Services
- Catering Services
- Other Soft Facility Management Services
- Hard Services
- By Offering Type
- In-house
- Outsourced
- Single Facility Management
- Bundled Facility Management
- Integrated Facility Management
- By End-User Industry
- Commercial
- Hospitality
- Institutional and Public Infrastructure
- Healthcare
- Industrial and Process
- Other End-User Industries
Data Sources, Market Sizing, and Validation
Desk Research
To build the base demand picture, we start with public signals tied to the buildings and workplaces that require ongoing services. Common inputs include national statistics on employment, services output, and construction stock from sources such as IBGE, along with labor and wage references from sources such as the Ministry of Labor and Employment.
We also check procurement and compliance signals that influence outsourced FM activity, using sources such as the Federal Government procurement portal, municipal transparency portals, and technical guidance from bodies such as ABNT for facility and safety related standards. To ground revenue and pricing logic, we review company filings and investor presentations where available, plus reputable press and association websites such as ABRAFAC. In addition, we use approved paid subscriptions for company financials and intelligence, patent databases for building operations related innovation, and an import-export shipment level database for equipment categories that connect with maintenance intensity. The sources listed here are illustrative only, and we used many other public documents and datasets to collect data, validate assumptions, and clarify gaps.
Primary Interviews and Surveys
Primary interviews and surveys were used to test what portion of services is typically outsourced in Brazil, how contracts are priced, and how bundled and integrated delivery is counted in practice. We spoke with a mix of service providers, subcontractors, and buyer side facility teams across major Brazilian business centers, and we rechecked inputs when desk research showed wide ranges (for example, wage pass through and contract indexation).
Distribution of primary research fieldwork respondents
| Company type | Respondent position |
|---|---|
| Top tier: 25% | CXOs: 13% |
| Mid tier: 60% | Functional/Unit leaders: 40% |
| Smaller Players: 15% | Managers: 47% |
Market-Sizing & Forecasting
Sizing starts from a top-down reconstruction of the Brazil addressable facilities services pool, where service demand is tied back to the operating base of commercial, industrial, healthcare, hospitality, and public infrastructure sites, and then converted into annual spend. In the model, we apply realistic outsourcing levels by end user environment, and we separate single services from bundled and integrated contracts to avoid double counting of the same work.
Key inputs that shape the totals include: commercial and institutional building activity, the share of services delivered through outsourced contracts, wage and benefits movement (a major cost driver for cleaning, security, and support roles), contract duration and inflation indexation practices, and service mix shifts between hard services (such as MEP upkeep and fire systems) and soft services (such as cleaning and security). The outputs are then corroborated with selective bottom-up checks, using sampled contract price ranges, supplier revenue signals, and channel checks on common service bundles, and gaps are handled by using conservative ranges that are narrowed through follow up calls.
For forecasting, we use scenario analysis built on a base case anchored on macro and real estate operating indicators, and then adjusted using expert views on outsourcing penetration, ESG related compliance needs, and technology adoption that changes service intensity. The forecast is reviewed for plausibility at the service mix level so growth does not outpace the underlying facility operating base.
Data Validation & Update Cycle
Validation is done through multiple checks, where outputs are compared against independent signals such as services activity, employment intensity, and observed contract pricing ranges. When a segment shows unusual jumps, the assumptions are reopened, and respondents are recontacted to confirm whether the change is real or a modeling artifact.
Before sign off, the model goes through analyst reviews that test currency conversion timing, inflation handling, and double count risks across bundled contracts. Reports are refreshed annually, with interim updates when material events occur that can shift labor costs, outsourcing behavior, or procurement volumes. Right before delivery, a final pass is completed so clients receive the latest updated view.
Mordor Intelligence's Brazil Facility Management Market Estimate Compared With Other Published Estimates
Published market values for Brazil facility management can look far apart because the boundary of what counts as FM is not consistent, and some sources mix building services with adjacent construction or property activities. Differences also come from how in-house delivery is treated, what is counted inside integrated contracts, and whether values are stated in current USD or converted using a different exchange rate timing.
Contract pricing benchmarks, outsourced contract share checks by end user, and service mix splits between hard and soft delivery are the evidence points that keep Mordor Intelligence tied to an addressable annual spend definition for Brazil, rather than a broad building services roll up. When those checks are not applied, totals can move meaningfully, especially if security, staffing, and office support are treated as general outsourcing without filtering for facilities scope.
Benchmark comparison
| Source | Market Size | Gaps in Research Methodology |
|---|---|---|
| Mordor Intelligence | USD 52.01 B (2025) | |
| Industry Association A | USD 23.02 B (2022) | Uses an earlier year and can reflect a narrower reported FM pool, and it may not fully normalize for how bundled and integrated contracts are valued versus single service contracts. |
| Advisory Publisher B | USD 52.00 B (2024) | Often groups facility management with broader building services, and the year and conversion timing can shift the USD value if local inflation and contract indexation are not handled consistently. |
The spread in the table mainly follows two practical issues, scope boundaries and the year used for the stated number. By keeping the market tied to recurring facility operations spend and then cross checking it with observed contract and service mix signals, the sizing outcome stays traceable and can be repeated when assumptions are updated.


Key Questions Answered in the Report
How large will Brazil facility management spending be by 2031?
The Brazil facility management market is forecast to reach USD 68.84 billion by 2031, expanding at a 4.68 % CAGR over 2026-2031.
Which service type currently generates the most revenue?
Hard services led with 62.54 % of 2025 revenue because many commercial buildings in Sao Paulo and Rio de Janeiro need MEP and fire-safety upgrades.
What is driving the shift toward outsourced delivery models?
Corporations want to cut fixed labor, access predictive-maintenance technology, and simplify accountability, pushing outsourced models up at a 5.01 % CAGR.
Why are hospitals a priority growth segment?
Public-private hospital projects embed 25-30 year contracts that require ANVISA-compliant maintenance, giving qualified providers long-term revenue visibility.
How are providers responding to wage inflation?
Leading firms deploy robotics, self-serve food kiosks, and renegotiate contracts with escalation clauses to protect margins against statutory wage hikes.
Which regions outside the Southeast present the next wave of growth?
The South region, particularly Curitiba and Porto Alegre, is advancing smart-city pilots and expanding agribusiness logistics, offering above-average growth prospects.
Page last updated on:


