
Market Overview
| Study Period | 2021 - 2031 |
|---|---|
| Forecast Data Period | 2026 - 2031 |
| Base Year Market Size (2025) | USD 1.95 Billion |
| Market Size (2026) | USD 2.15 Billion |
| Market Size (2031) | USD 3.21 Billion |
| Growth Rate (2026 - 2031) | 8.40 % |
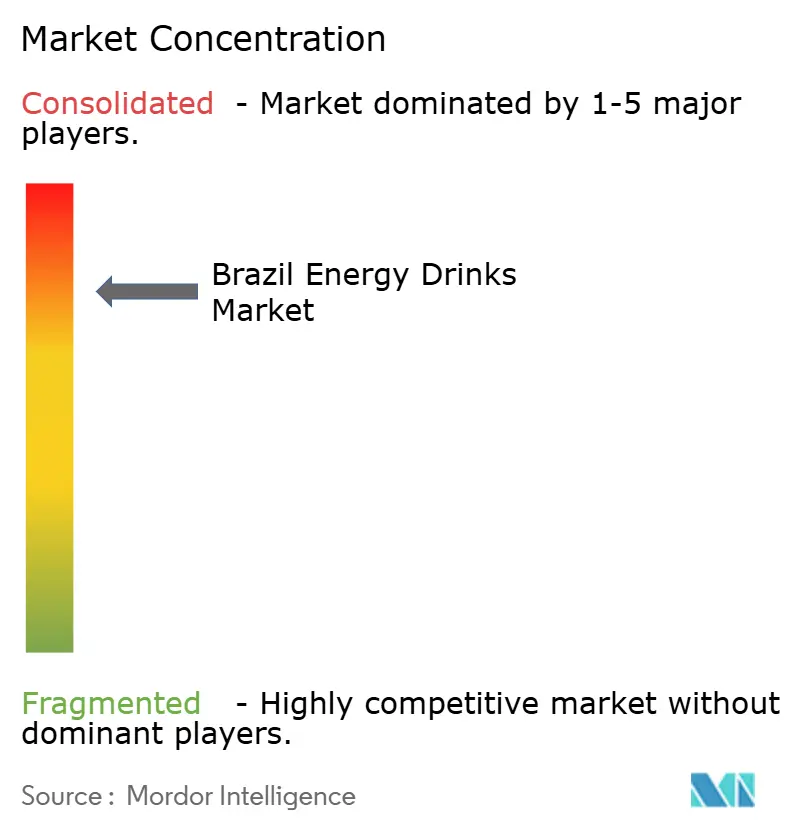
| Market Concentration | High |
Major Players *Disclaimer: Major Players sorted in no particular order Image © Mordor Intelligence. Reuse requires attribution under CC BY 4.0. | |
Brazil Energy Drinks Market Analysis by Mordor Intelligence
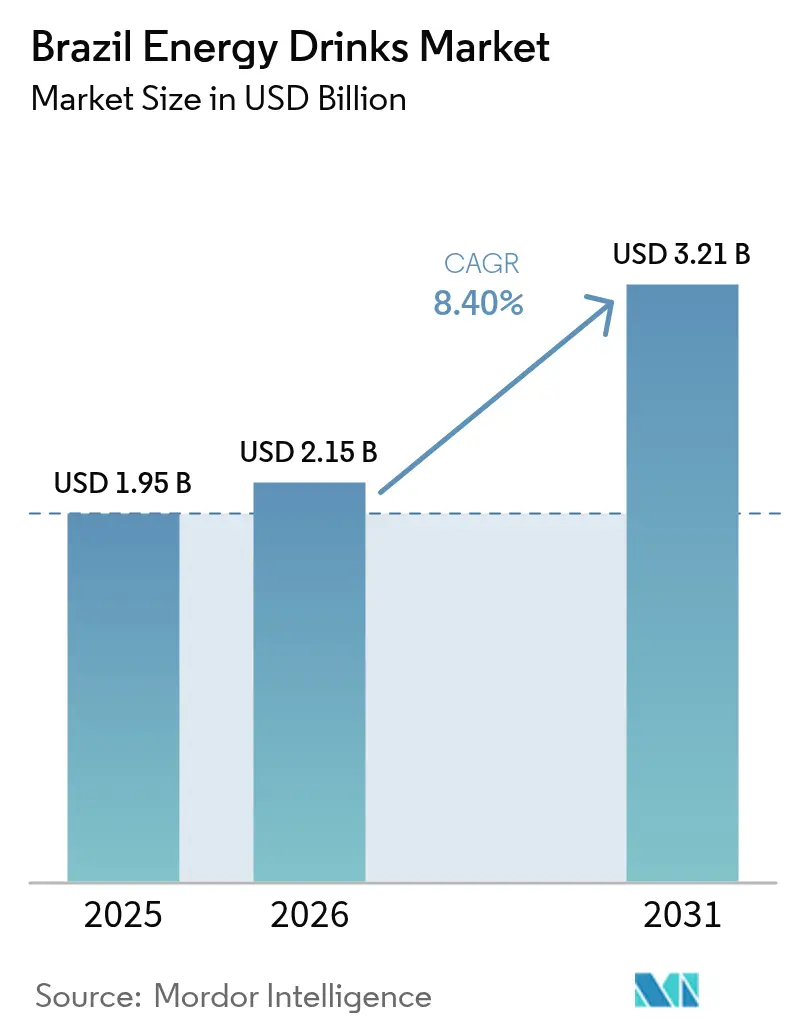
The Brazil energy drinks market size was valued at USD 1.95 billion in 2025 and estimated to grow from USD 2.15 billion in 2026 to reach USD 3.21 billion by 2031 at a compound annual growth rate (CAGR) of 8.40 percent. The energy drinks market in Brazil is experiencing growth, driven by lifestyle changes, demographic shifts, and evolving retail trends. A large, young urban population with demanding schedules increasingly opts for convenient beverages that enhance alertness and stamina for activities such as work, studying, nightlife, and sports. The rising participation in gyms and the growing amateur fitness culture are fueling the use of energy drinks as pre-workout performance enhancers. According to the 2024 Latin America Fitness Consumer Survey by the Health & Fitness Association, 78.4% of physically active urban Brazilians are members of health and fitness organizations[1]. Additionally, the increasing popularity of e-sports and gaming is driving demand for functional stimulation. Manufacturers are focusing on strong brand marketing tied to music festivals and extreme sports, while also introducing sugar-free and natural-ingredient options to appeal to health-conscious consumers. Moreover, expanded availability through supermarkets, convenience stores, and delivery apps has improved accessibility, encouraging impulse purchases and supporting steady market growth.
Key Report Takeaways
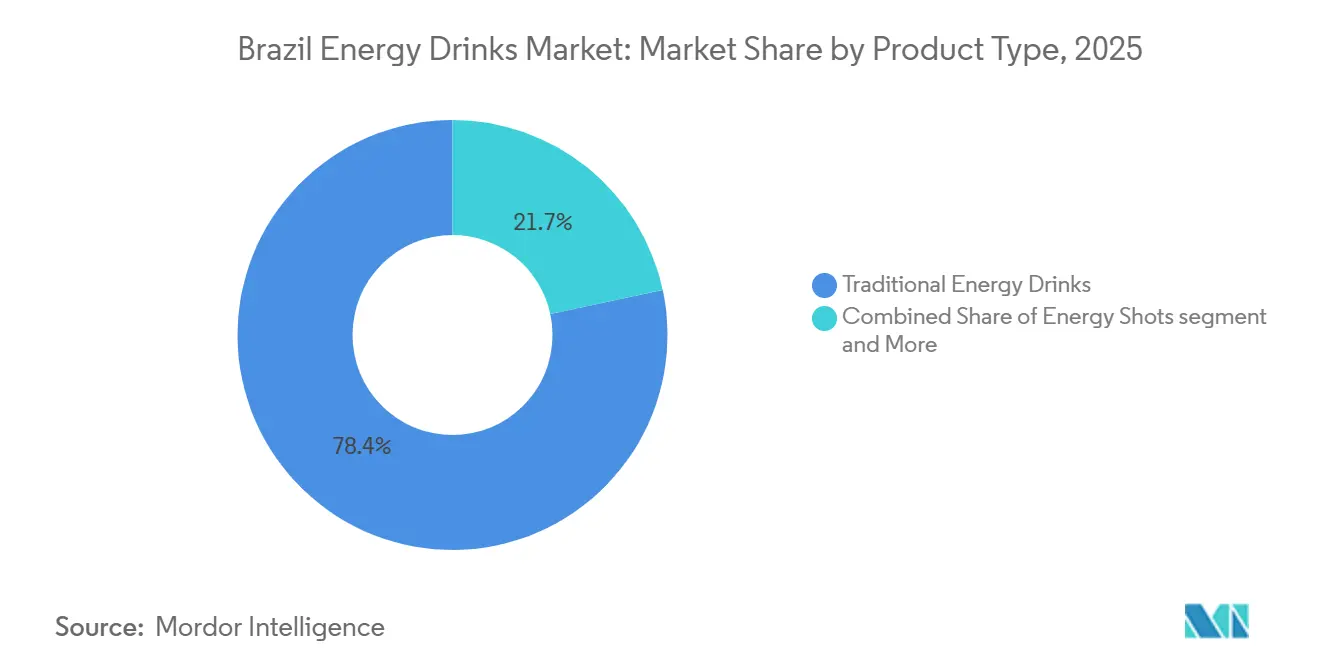
- By product type, traditional energy drinks led with 78.35% of Brazil's energy drinks market share in 2025, whereas energy shots are projected to expand at a 10.64% CAGR through 2031.
- By packaging, metal cans captured 71.32% of the Brazil energy drinks market size in 2025; Tetra Pak and pouches record the fastest 10.80% CAGR over 2026-2031.
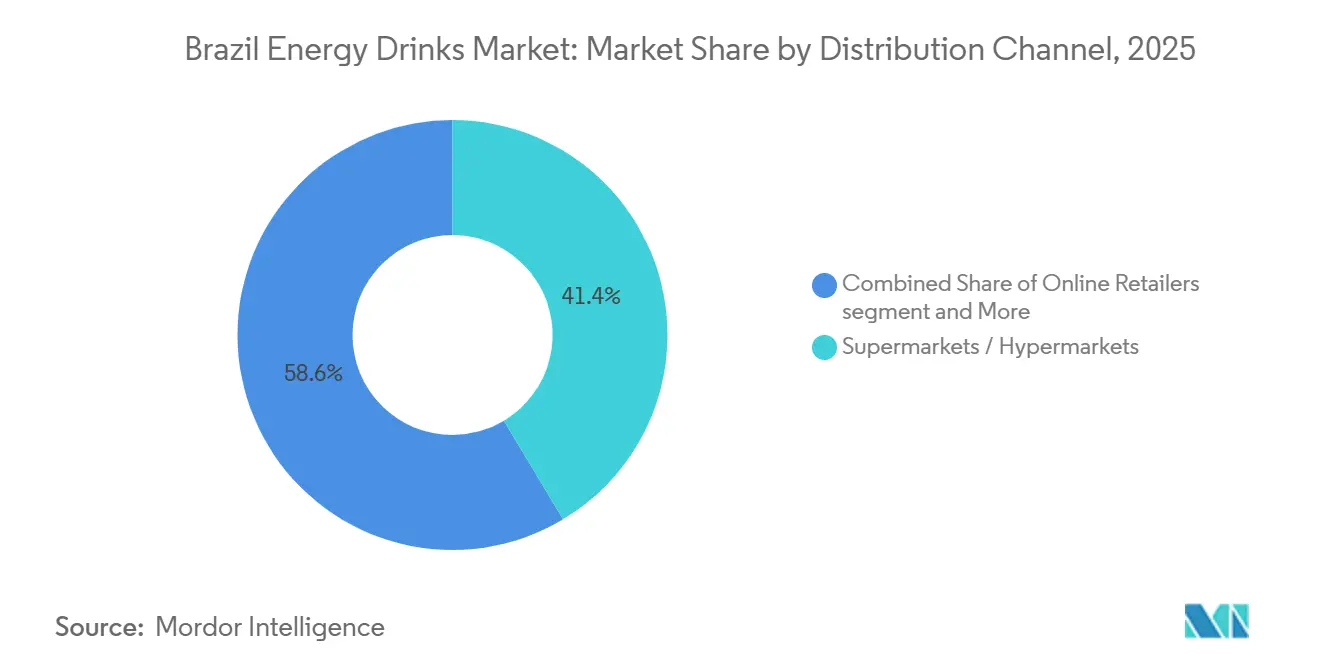
- By distribution channel, supermarkets and hypermarkets held a 41.40% of Brazil's energy drinks market share in 2025, while online retailers are advancing at an 11.46% CAGR to 2031.
Note: Market size and forecast figures in this report are generated using Mordor Intelligence’s proprietary estimation framework, updated with the latest available data and insights as of 2026.
Brazil Energy Drinks Market Trends and Insights
Drivers Impact Analysis*
| Driver | (~) % Impact on CAGR Forecast | Geographic Relevance | Impact Timeline |
|---|---|---|---|
| Growing preference for reduced-sugar formulations | +1.2% | National, strongest in São Paulo, Rio de Janeiro, and Southern states | Medium term (2-4 years) |
| Expanding adoption of gym and fitness lifestyles | +1.0% | Urban centers (São Paulo, Rio de Janeiro, Brasília), spreading to secondary cities | Long term (≥ 4 years) |
| Rapid growth of direct-to-consumer online sales channels | +1.5% | National, with highest penetration in Southeast (62% of retail revenues) | Short term (≤ 2 years) |
| Brand visibility through gaming and e-sports sponsorships | +0.8% | National, concentrated in youth demographics (16-34 years, 62% of esports audience) | Medium term (2-4 years) |
| Product innovation centered on guarana-based functionality | +1.3% | National, leveraging Bahia production hub and Amazon heritage | Long term (≥ 4 years) |
| Rising demand for functional beverages and clean-label products | +1.0% | National, premium segments in Southeast and South | Medium term (2-4 years) |
| Source: Mordor Intelligence | |||
Growing preference for reduced-sugar formulations
Concerns over sugar consumption and lifestyle-related health issues, such as obesity and diabetes, are prompting Brazilian consumers to choose energy drinks with reduced or zero sugar content. Data from Agência Brasil indicates that 62.6% of Brazil's population was overweight in 2024, compared to 42.6% in 2006[2]. Consumers are increasingly scrutinizing nutrition labels and preferring beverages that offer caffeine and functional benefits without high-calorie content. This trend is particularly prominent among gym-goers, young professionals, and regular energy drink consumers. In response, brands are reformulating their products by using low-calorie sweeteners, plant-based extracts, and simplified ingredient lists while preserving taste and performance. This strategy allows consumers to incorporate energy drinks into their daily routines without compromising health goals, broadening usage occasions from nightlife to daytime activities like productivity and fitness. As a result, reduced-sugar variants are gaining traction among health-conscious consumers, driving repeat purchases and emerging as a key growth factor in the Brazilian energy drinks market.
Expanding adoption of gym and fitness lifestyles
The increasing adoption of gym memberships, recreational sports, and fitness-oriented lifestyles in Brazil is driving a notable rise in demand for energy drinks as functional performance beverages. Consumers are increasingly using these drinks as pre-workout supplements or endurance enhancers to improve focus, stamina, and training intensity during activities such as weightlifting, running, cycling, and group fitness classes. Fitness influencers and trainers often promote caffeinated and performance-enhancing beverages as part of workout routines, strengthening their association with active lifestyles rather than solely nightlife consumption. In response, brands are positioning their products to emphasize benefits such as hydration, mental alertness, and physical performance, highlighting ingredients like caffeine, taurine, B-vitamins, and electrolytes. As regular exercise becomes a more integral part of daily routines for many Brazilians, energy drinks are increasingly incorporated into fitness preparation and recovery practices, contributing to higher purchase frequency and sustained market growth.
Rapid growth of direct-to-consumer online sales channels
The growth of direct-to-consumer (D2C) online channels is driving energy drink sales in Brazil by simplifying product discovery and repurchasing processes, reducing reliance on physical retail. E-commerce platforms, brand websites, and quick-commerce delivery apps enable consumers to purchase multipacks, subscription bundles, and limited editions with ease, promoting higher consumption frequency and fostering brand loyalty. These online channels also allow companies to target specific consumer groups, such as gamers, fitness enthusiasts, and students, through personalized promotions, influencer partnerships, and social media campaigns. Furthermore, digital storefronts offer detailed information on ingredients, sugar content, and functional benefits, aiding newer or premium brands in building consumer trust. With the continued expansion of smartphone usage and instant delivery services in urban areas, online D2C distribution is emerging as a significant growth driver by enhancing accessibility, encouraging repeat purchases, and improving consumer engagement in the Brazilian energy drinks market.
Product innovation centered on guarana-based functionality
Guarana-based functionality is a key growth driver in Brazil's energy drinks market due to the ingredient's strong cultural relevance and its association with natural energy among local consumers. Native to the Amazon region, guarana is widely recognized as a traditional stimulant, making products that feature it appear more authentic and less artificial compared to synthetic caffeine formulations. Manufacturers are integrating guarana extracts with vitamins, botanicals, and natural flavors to position these beverages as functional options aligned with natural wellness solutions. This approach appeals to health-conscious consumers seeking sustained energy, improved mental focus, and reduced side effects like jitters, while also preserving regional identity. By combining modern beverage formats with a locally trusted ingredient, companies enhance consumer trust, encourage product trials, and foster a premium perception, contributing to the steady growth of Brazil's energy drinks market.
Restraints Impact Analysis*
| Restraint | (~) % Impact on CAGR Forecast | Geographic Relevance | Impact Timeline |
|---|---|---|---|
| Potential nationwide caffeine restrictions and mandatory warning labels | -0.8% | National, enforced by ANVISA across all states | Medium term (2-4 years) |
| Fluctuating costs of imported aluminum cans | -0.7% | National, with acute impact on manufacturers in Southeast and South | Short term (≤ 2 years) |
| Presence of counterfeit products | -0.6% | National, concentrated in online and informal retail channels | Short term (≤ 2 years) |
| Excise taxes on sugary drinks | -0.9% | National, phased implementation 2029-2033 | Long term (≥ 4 years) |
| Source: Mordor Intelligence | |||
Potential nationwide caffeine restrictions and mandatory warning labels
Potential nationwide caffeine limits and stricter warning-label requirements are restraining Brazil's energy drinks market by increasing regulatory pressure on high-stimulant formulations and marketing practices. Authorities are expressing growing concern over excessive caffeine consumption, particularly among adolescents and frequent consumers. This concern could result in caps on allowable caffeine content, sales restrictions in specific environments, or stricter advertising regulations. Additionally, Brazil's nutrition labeling regulation, RDC 429/2020, mandates front-of-pack warning symbols when added sugar exceeds 7.5 grams per 100 milliliters[3]. This requirement is prompting brands to reformulate their products to avoid negative consumer perceptions at the point of purchase. These policies may reduce impulse purchases, limit product differentiation based on strong stimulation claims, and increase compliance and reformulation costs for manufacturers. Collectively, these regulatory challenges could slow new product launches, compress profit margins, and moderate overall market growth.
Fluctuating costs of imported aluminum cans
Fluctuating prices of imported aluminum cans constrain Brazil's energy drinks market, as packaging constitutes a significant portion of production costs. The market heavily depends on sleek, single-serve cans, leaving manufacturers vulnerable to currency fluctuations, global aluminum price variations, and logistics costs associated with imported materials. Rising input costs force brands to either raise retail prices or absorb reduced margins, both of which can diminish competitiveness against other ready-to-drink beverages. Smaller and emerging companies face greater challenges due to limited negotiating power with suppliers and distributors. Frequent price changes also disrupt promotional strategies and deter bulk purchasing, ultimately reducing profitability and hindering market growth.
*Our forecasts treat driver/restraint impacts as directional, not additive. The impact forecasts reflect baseline growth, mix effects, and variable interactions.
Segment Analysis
By Product Type: Shots and Sugar-Free Variants Reshape Portfolio Mix
Traditional energy drinks accounted for 78.35% of the market share in 2025, driven by their integration into everyday consumption scenarios such as long work hours, commuting fatigue, studying, and nightlife activities. Their affordability, availability in larger pack sizes, and widespread distribution through supermarkets, convenience stores, and bars make them a popular choice among a broad consumer base. Brand promotions linked to football, music events, and youth culture further strengthen brand recognition and loyalty. Additionally, the availability of various flavors appeals to regular consumers. The combination of accessibility, familiar taste profiles, and social consumption habits supports the continued dominance of traditional energy drinks across diverse demographic groups.
Energy shots are projected to grow at a rate of 10.64% through 2031, driven by the demand for quick and portable energy solutions among urban consumers seeking immediate alertness without consuming a full-sized beverage. This compact format is favored by students, drivers, gamers, and professionals due to its convenience, ease of transport, and perceived functionality. Additionally, the low volume appeals to calorie-conscious consumers who prefer caffeine intake without excessive liquid or sugar. Pharmacies, gyms, and checkout counters further promote impulse purchases. As productivity-focused lifestyles become more prevalent, the convenience and concentrated energy benefits of energy shots continue to drive their adoption in niche but rapidly expanding usage scenarios.

By Packaging Type: Sustainability and Logistics Favor Flexible Formats
Metal cans dominated with a 71.32% market share in 2025. Energy drinks packaged in metal cans lead sales in Brazil due to their strong association with premium branding, carbonation retention, and rapid cooling convenience. Consumers view cans as providing a fresher, colder, and more intense drinking experience, particularly in hot climates and social settings such as parties, bars, and sporting events. Their durability facilitates transport and outdoor consumption, while slim designs improve shelf visibility and encourage impulse purchases in convenience stores. Additionally, cans align with the category's youthful image and are highly compatible with vending machines and quick-commerce delivery, supporting frequent purchases.
Tetra Pak and pouches are projected to grow at a rate of 10.80% through 2031. Energy drinks packaged in Tetra Pak cartons and pouches are gaining popularity due to their affordability and practicality for everyday use. These packaging formats are lightweight and often less expensive to produce, enabling brands to cater to price-sensitive consumers and smaller retail outlets, such as those in residential areas and schools. They can be stored without refrigeration before opening and are safer for on-the-go consumption, particularly for younger consumers and daytime use. Additionally, their resealable and spill-resistant design makes them convenient for travel or work, allowing brands to extend the category beyond nightlife into routine hydration and casual refreshment occasions.
By Distribution Channel: Digital Platforms Accelerate Share Gains
Supermarkets/hypermarkets accounted for 41.40% of the distribution share in 2025, supported by high product visibility, diverse flavor options, and price promotions that encourage bulk purchases. Consumers frequently include multipacks in their regular grocery shopping, making this channel significant for repeat purchases and family-level stocking. Large shelf displays, in-store discounts, and cross-merchandising near snacks or alcoholic beverages drive impulse purchases, while chilled sections enable immediate consumption after checkout. Additionally, the ability to compare brands and pack sizes in a single location fosters trust and promotes widespread adoption across different income groups.
Online retailers are projected to grow at a CAGR of 11.46% through 2031, driven by the convenience of e-commerce and targeted digital engagement. These platforms enable consumers to order energy drinks at any time and receive them quickly through delivery services. Features such as subscription packs, bundle pricing, and exclusive online flavors promote higher purchase frequency and foster brand loyalty, particularly among gamers, students, and fitness enthusiasts. Additionally, digital platforms offer detailed ingredient information and user reviews, enhancing the credibility of premium and functional products. With the expansion of mobile commerce and rapid delivery services in urban areas, online channels are increasingly facilitating habitual replenishment rather than occasional purchases.
Geography Analysis
Brazil's energy drink market is predominantly concentrated in the Southeast, driven by large metropolitan areas with dense populations, higher purchasing power, and strong participation in fitness activities, which collectively support the highest consumption levels. Major beverage companies consider Brazil a key growth market in Latin America, with premium products and continuous innovation performing particularly well in major cities. Simultaneously, manufacturers are increasing investments in production and distribution capacity to strengthen their presence in the North and Northeast. These regions offer significant long-term growth potential due to their large population base. The South also remains strategically important, supported by relatively strong consumer spending and cross-border trade dynamics, with facility upgrades in the region underscoring ongoing operational commitments.
Local sourcing advantages further influence regional market dynamics. Areas known for guarana cultivation provide opportunities for branding tied to natural ingredients and sustainability narratives. However, economic constraints in less affluent regions can limit short-term demand, despite these areas representing the largest untapped consumer base. Additionally, differences in state taxation rules create compliance challenges, which larger national companies are better equipped to manage compared to smaller regional players. The Central-West region is gradually emerging as a secondary growth area, supported by increasing white-collar employment and growing fitness adoption.
Regulatory Landscape
Brazil energy drinks operate within Brazil's broader national framework for foods and beverages, with compliance shaped mainly by ANVISA for sanitary controls and labeling, and MAPA for beverage identity, quality, and establishment oversight under the beverage law architecture (Lei No. 8.918/1994 and Decreto No. 6.871/2009). A key operational anchor for suppliers is ANVISA's nutrition labeling regime, including front-of-pack warnings under RDC No. 429/2020 when added sugar thresholds are exceeded, which directly affects mainstream SKUs that compete in high-volume retail.
In February 2024, ANVISA issued RDC No. 843/2024 alongside Instrução Normativa No. 281/2024, introducing an updated, more risk-based framework for food and packaging regularization and notification procedures. In parallel, MAPA consolidated and updated beverage-related norms through Instrução Normativa No. 140/2024, reinforcing the need for producers and importers to align product specifications and documentation with MAPA requirements while also meeting ANVISA labeling and composition declarations, including the accuracy of caffeine statements on-pack.
Competitive Landscape
Brazil's energy drink market is highly consolidated, dominated by global players such as Monster Beverage, Red Bull, and Coca-Cola, which leverage their extensive scale and distribution networks. Leading companies are expanding production capacity to meet growing demand while introducing localized flavors and formulations inspired by ingredients like guarana. Additionally, clean-label positioning is being adopted to enhance relevance among domestic consumers. Major beverage groups are also investing in digital ordering platforms and retailer connectivity tools to strengthen relationships with small outlets and reduce reliance on traditional intermediaries.
Despite the dominance of multinational brands, smaller companies are finding opportunities in niche formats such as compact energy shots and shelf-stable packaging. These formats require less infrastructure compared to carbonated canned products and enable targeted marketing toward youth communities, including partnerships within the esports sector. Technology adoption is reshaping competition as large players enhance manufacturing efficiency and accelerate the launch of new product variants. Digital distribution platforms are also expanding market access for emerging brands. However, stricter regulatory requirements for product notification and registration create higher entry barriers, favoring companies with established compliance capabilities.
Natural-ingredient brands that emphasize local sourcing and transparent labeling are beginning to gain attention, although their scale remains limited compared to multinational competitors. Additionally, concerns about counterfeit products in online channels are prompting leading firms to invest in traceability systems and direct-to-consumer engagement. These efforts reinforce their advantages in resources, consumer trust, and supply chain control over smaller challengers.
Brazil Energy Drinks Industry Leaders
-
Red Bull GmbH
-
Monster Beverage Corp.
-
Anheuser-Busch InBev
-
Grupo Petrópolis
-
PepsiCo Inc.
- *Disclaimer: Major Players sorted in no particular order
Market Opportunities and Future Outlook
Manufacturing scale-up and automation investments across Brazil's beverage industry are creating space for energy-drink players to expand output, lower unit costs, and strengthen national reach beyond the Southeast. Baly Brasil's acquisition of an industrial site in Araranguá (Santa Catarina) to add a fourth manufacturing plant is aimed at stepping up production capacity, while Grupo RFK's announced investment to build an automated facility in São José dos Pinhais (Paraná) with large annual beverage capacity could intensify competition in price-accessible formats.
Distribution control and regional logistics hubs are also emerging as an opportunity lever, supporting faster replenishment for supermarkets/hypermarkets, the largest 2025 channel, and for the online channel expanding through quick-commerce and D2C bundles. Minotauro Energy Drink's expansion actions in São Paulo state, including distribution center and local manufacturing arrangements cited in 2026 reporting, reflect how smaller brands are professionalizing supply chains to broaden national availability. At the same time, ANVISA's 2024 risk-based regularization updates and ongoing front-of-pack sugar warnings keep reformulation and sugar-free portfolios central to new product pipelines and pack architecture decisions.
Recent Industry Developments
- July 2026: Minotauro Energy Drink accelerated its national expansion strategy, highlighting broader distribution ambitions after building presence in key markets. The move reflects how challenger brands are using regional rollout playbooks to gain shelf access beyond core strongholds and compete for mainstream retail volume.
- May 2026: Minotauro Energy Drink announced a national expansion plan backed by a reported R$ 2 million investment, including steps toward its own production and distribution footprint in Sorocaba, São Paulo. Expanding in-house capabilities supports service levels and can improve margins versus fully outsourced models in a category shaped by frequent promotions and high distribution intensity.
- May 2025: Ball Corporation partnered with Brazil's natural energy drink brand Açaí Motion to launch a beverage can certified by the Aluminium Stewardship Initiative (ASI). The partnership points to rising emphasis on packaging traceability and circular-economy credentials, reinforcing sustainability positioning as brands compete for premium and clean-label shoppers.
Research Methodology Framework and Report Scope
Market Definition and Coverage
For this study, the market covers the value of energy drink products sold in Brazil through retail and foodservice channels, measured at consumer purchase prices in USD. It includes traditional and sugar-free formulations, plus energy shots and natural or organic variants.
Scope exclusions: We exclude broader functional beverages that are not positioned and sold as energy drinks (for example, sports drinks, ready-to-drink coffee, and vitamin waters).
Segmentation Overview
- By Product Type
- Energy Shots
- Natural/Organic Energy Drinks
- Sugar-free or Low-calories Energy Drinks
- Traditional Energy Drinks
- Other Energy Drinks
- By Packaging Type
- Metal Cans
- PET Bottles
- Glass Bottles
- Tetra Pak / Pouches
- By Distribution Channel
- Supermarkets / Hypermarkets
- Convenience Stores
- Specialist Stores
- Online Retailers
- Others
Data Sources, Market Sizing, and Validation
Desk Research
Desk research was used to map the Brazil demand context and to ground the model in signals that can be checked year after year. We referred to public sources such as Brazil national statistics releases (for income, inflation, and retail indicators), customs and trade statistics for beverage inputs and packaging materials, and food labeling or health guidance published by official agencies.
To make assumptions more realistic, we also reviewed company annual reports, investor presentations, and brand and association websites that discuss channel strategies and pack formats. In parallel, we used paid subscriptions for company financials and news and for patent activity to spot product renovation patterns, which were then tested in interviews before being used in the market build. The desk sources listed above are illustrative only, and other public documents and datasets were also reviewed for collection, validation, and clarification.
Primary Interviews and Surveys
Primary work focused on confirming what is actually sold as an energy drink in Brazil, how pricing changes by pack type, and how channel mix is shifting between large retail and convenience-led purchases. We spoke with manufacturers, distributors, and retail-side respondents across Brazil, and the interviews were used to stress-test desk assumptions on volumes, premiumization, and the role of energy shots in the total value.
Distribution of primary research fieldwork respondents
| Company type | Respondent position |
|---|---|
| Top tier: 30% | CXOs: 14% |
| Mid tier: 54% | Functional/Unit leaders: 37% |
| Smaller Players: 16% | Managers: 49% |
Market-Sizing & Forecasting
Sizing starts with a top-down reconstruction of Brazil energy drink value, where household spending and modern trade performance signals are translated into a category demand pool, and then split by the way products are typically bought in the country. That total is then corroborated with selective bottom-up checks, using sampled price points by pack (metal cans, PET bottles, and other packs) multiplied by channel-led volumes, followed by adjustments when gaps show up in interviews.
A few inputs were treated as key fingerprints because they move the market each year in a visible way. These include the share shift between supermarkets and convenience stores, the mix of traditional versus sugar-free products, the penetration and growth of energy shots, average pack sizes and price ladders, and inflation-linked price resets that are common in beverages. When a data point could not be observed cleanly, we applied conservative ranges and used primary feedback to narrow the range, and then re-tested the assumption against the final total.
For forecasting, we relied on scenario analysis supported by simple regression checks using macro indicators (income trend and inflation) plus category-specific drivers (channel expansion and premiumization). The final outlook was accepted only after experts confirmed that the implied pricing and mix changes matched what they see in shelf strategy and promotions.
Data Validation & Update Cycle
Validation was handled through triangulation across three layers, the model math, external signals, and expert re-checks. Outputs were compared against independent indicators such as retail channel direction, pack format adoption, and the expected contribution of energy shots to value, and then variances were investigated before sign-off.
If a major inconsistency appeared, we re-contacted respondents to confirm whether it came from a scope mismatch, a price timing issue, or a channel shift that was not captured properly. The report is refreshed annually, and interim edits are triggered when material events change pricing, regulation, or distribution. Before delivery, a final analyst pass is completed so the published view reflects the latest available information.
Mordor Intelligence's Brazil Energy Drink Market Sizing Compared With Other Published Estimates
Published market sizes for Brazil energy drinks can look far apart even when the same country is being discussed, because the product boundary and the price basis are not always consistent. Differences usually come from what gets counted as an energy drink, whether energy shots are included, and how channel pricing is treated in the value build.
Key gap drivers in this category are often practical. Some estimates fold mixers or adjacent functional beverages into the same total, which lifts the number quickly, and others use a different base year and then project forward using an aggressive price growth path. Currency conversion timing also matters in Brazil, since exchange-rate choices can change a USD value even when local pricing stays steady.
Benchmark comparison
| Source | Market Size | Gaps in Research Methodology |
|---|---|---|
| Mordor Intelligence | USD 1.95 B (2025) | |
| Global Consultancy A | USD 3.12 B (2023) | Uses an earlier base year and a broader category cut that can include energy shots under a wider energy beverages lens, and the value basis can differ by mixing on-trade and off-trade pricing. |
| Regional Consultancy B | USD 1.38 B (2024) | Leans on a narrower product grouping and a different channel set, which can undercount newer packs and online-led sales, and it also applies a distinct base-year price snapshot. |
Channel-share checks, pack-format mix signals, and interview-tested price ladders are the evidence that anchors Mordor Intelligence's estimate to what is actually sold as energy drinks in Brazil, and that is why the table shows a tighter, more repeatable scope than figures built from wider functional beverage buckets. Once scope and price basis are aligned, most of the spread becomes explainable through base-year choice and how fast pricing is assumed to step up in USD terms.
Key Questions Answered in the Report
How fast is the Brazil energy drinks market expected to grow to 2031?
The category is forecast to rise at an 8.4% CAGR from 2026 to 2031, taking retail value to USD 3.21 billion.
Which product sub-segment is expanding the quickest?
Energy shots lead with a 10.64% CAGR because consumers favor convenient, portion-controlled formats.
Why are Tetra Pak and pouch packages gaining share?
Tetra Pak and pouch packages avoid aluminum price swings, reduce logistics weight, and align with sustainability goals, underpinning a 10.80% CAGR.
Which channel will contribute most incremental sales by 2031?
Online retailers are forecast to expand at 11.46% CAGR, adding the largest new revenue pool.