
Market Overview
| Study Period | 2020 - 2031 |
|---|---|
| Forecast Data Period | 2026 - 2031 |
| Base Year Market Size (2025) | USD 304.36 Million |
| Market Size (2026) | USD 316.56 Million |
| Market Size (2031) | USD 385.46 Million |
| Growth Rate (2026 - 2031) | 4.01 % |
| Market Concentration | Medium |
Major Players *Disclaimer: Major Players sorted in no particular order Image © Mordor Intelligence. Reuse requires attribution under CC BY 4.0. | |
Brazil Dental Devices Market Analysis by Mordor Intelligence
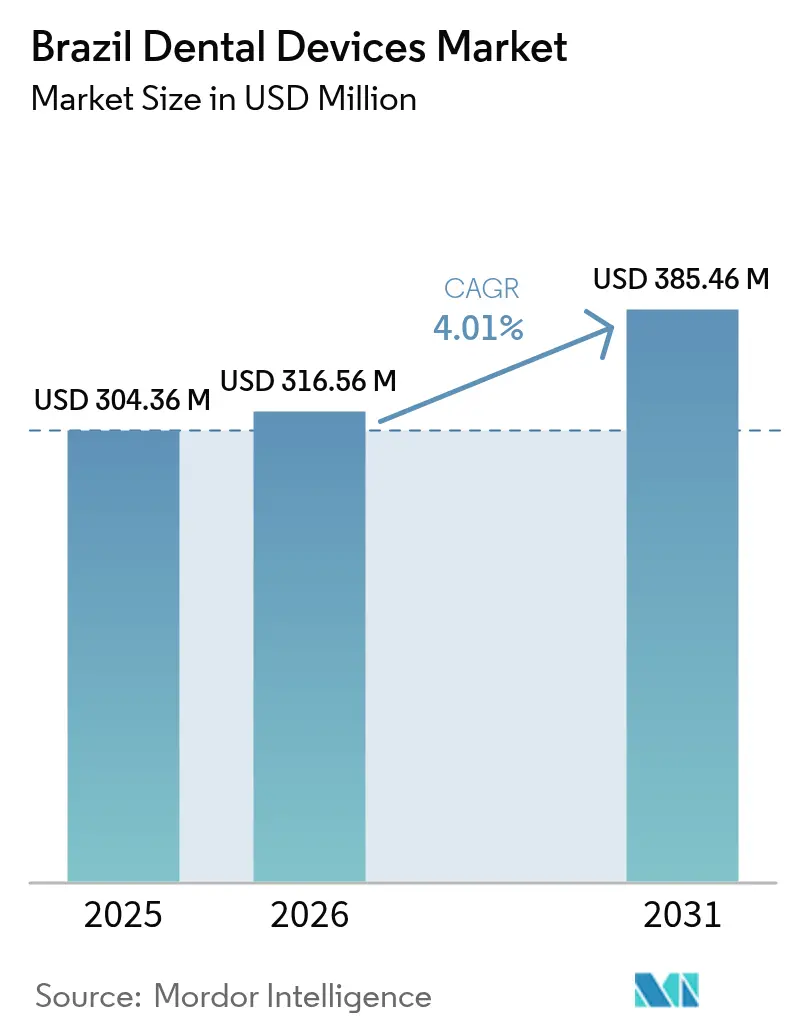
The Brazil Dental Devices Market size is expected to increase from USD 304.36 million in 2025 to USD 316.56 million in 2026 and reach USD 385.46 million by 2031, growing at a CAGR of 4.01% over 2026-2031.
Equipment demand is expanding in tandem with a decade-long 66% rise in supplementary dental-insurance enrollment, yet public clinics still perform only a fraction of complex procedures, so private practices and fast-growing dental service organizations continue to purchase new operatories, imaging systems, and computer-aided design–computer-aided manufacturing (CAD/CAM) tools. Conversely, layered import taxes plus a weaker real inflate landed costs for foreign equipment by as much as 80%; this burden gives domestically produced chairs, implants, and compressors a clear price edge. The interplay between streamlined approval pathways for low-risk devices and stiffer evidence requirements for high-risk implants is rewarding multinational manufacturers that hold extensive clinical dossiers while motivating domestic firms to compete through localized service and export diversification. These forces collectively sustain a steady but measured momentum in the Brazil dental devices market, even as regional disparities persist in dentist density and insurance coverage.
Key Report Takeaways
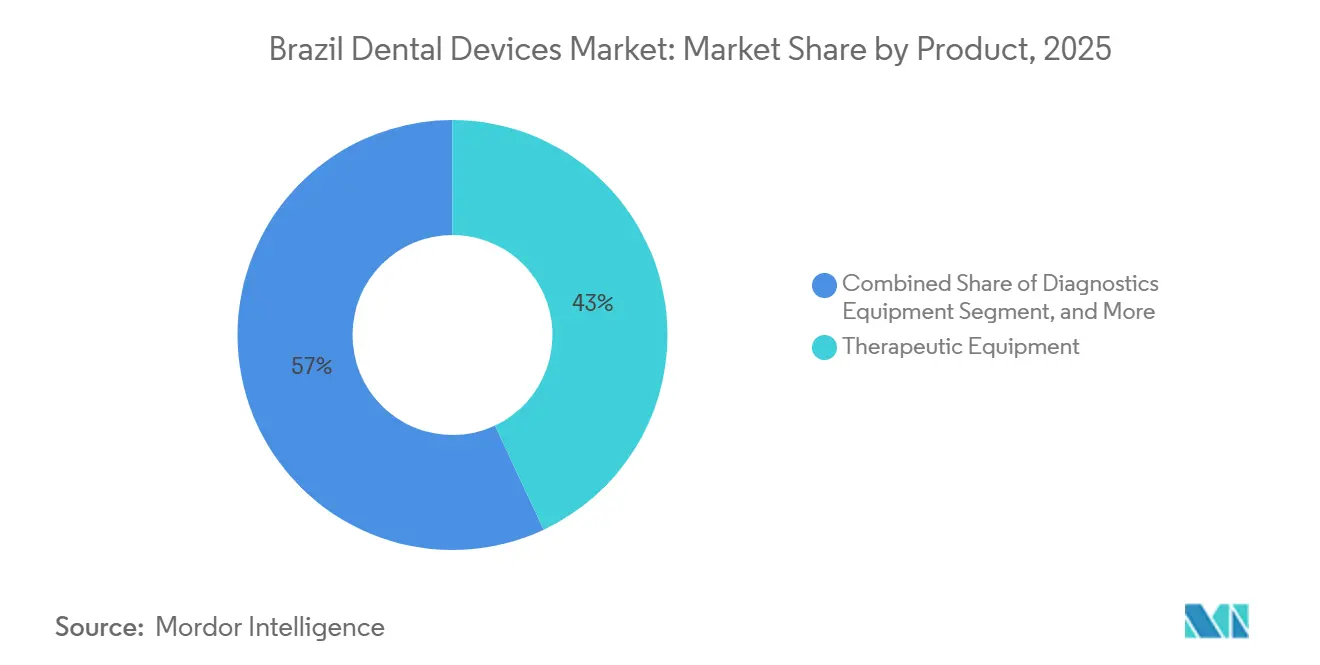
- By product, therapeutic equipment led with 43.02% of Brazil's dental devices market share in 2025, whereas dental consumables are projected to post the fastest 6.91% CAGR through 2031.
- By treatment, prosthodontic procedures accounted for 38.12% of the Brazilian dental devices market in 2025, and orthodontic care is advancing at a 5.51% CAGR on the back of clear-aligner uptake.
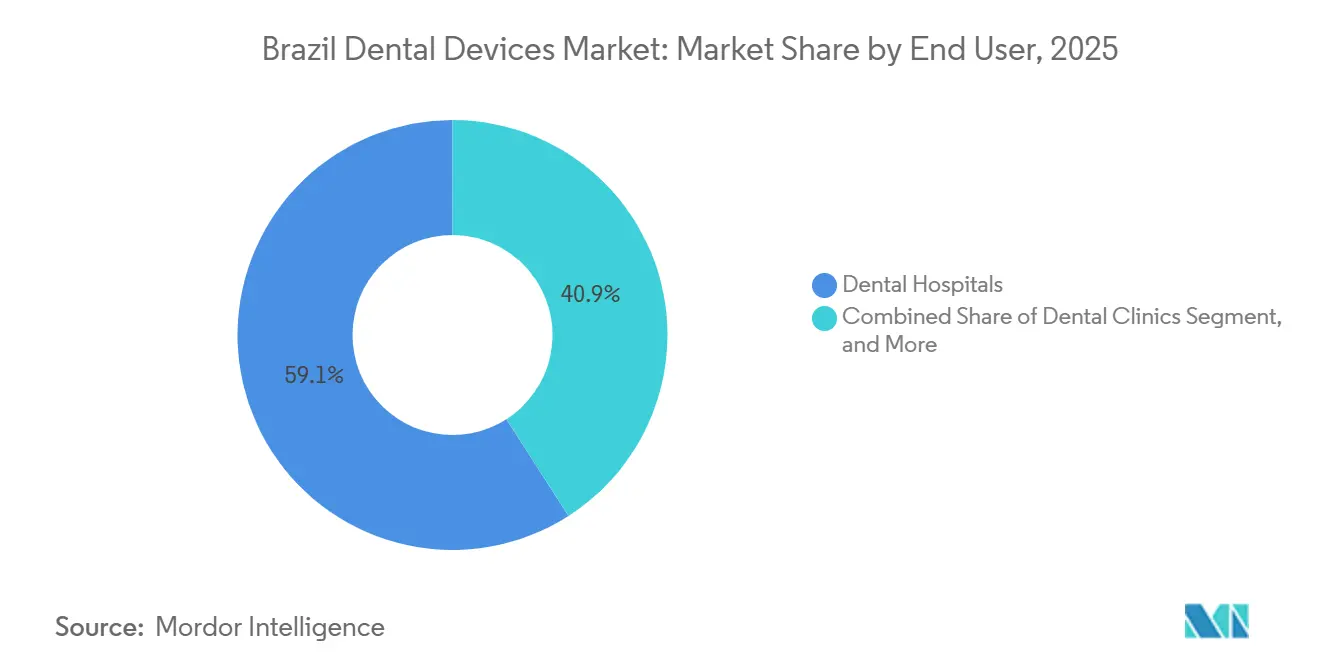
- By end user, dental clinics accounted for 59.08% of spending in 2025; dental laboratories are the fastest-expanding channel, with a 7.08% CAGR, as CAD/CAM milling and 3-D printing shift prosthetic fabrication in-house.
Note: Market size and forecast figures in this report are generated using Mordor Intelligence’s proprietary estimation framework, updated with the latest available data and insights as of 2026.
Market Trends and Insights
Drivers Impact Analysis of Brazil Dental Devices Market*
| Driver | (~) % Impact on CAGR Forecast | Geographic Relevance | Impact Timeline |
|---|---|---|---|
| High Prevalence of Untreated Dental Caries & Periodontal Disease | 0.8% | National, concentrated in North & Northeast regions with lower access | Long term (≥ 4 years) |
| Expansion of Brazil's Supplementary Dental-Insurance Coverage | 0.6% | National, urban centers and corporate employee segments | Medium term (2–4 years) |
| Accelerating Adoption of Digital Dentistry (CAD/CAM, CBCT, 3-D Printing) | 1.1% | Southeast & South regions, metropolitan clinics and DSOs | Short term (≤ 2 years) |
| Growth of Domestic Manufacturing Hubs | 0.4% | National, with production concentrated in São Paulo, Paraná, Santa Catarina | Medium term (2–4 years) |
| ANVISA RDC 751/22 Fast-Tracks Low/Medium-Risk Device Approvals | 0.5% | National, benefiting Class I and II device manufacturers and importers | Short term (≤ 2 years) |
| Rapid Scale-Up of Corporate Dental Chains & DSOs Driving Capex Cycles | 0.9% | National, franchise expansion in secondary cities and metropolitan areas | Medium term (2–4 years) |
| Source: Mordor Intelligence | |||
High Prevalence of Untreated Dental Caries & Periodontal Disease
SB Brasil 2023 reported a mean decayed-missing-filled-teeth index of 16.75 among adults aged 35–44, while 53.7% of that cohort need prosthetic rehabilitation, and 36.27% of elderly Brazilians are totally edentulous.[1] Public clinics perform only 11.3% of endodontic and 17.4% of prosthetic interventions, despite being present in 74.4% of basic health units, pushing complex cases into private offices that regularly replace ultrasonic scalers, surgical motors, and implant kits. The World Health Organization recommends one dentist per 1,500 residents, yet capitals in the Southeast approach ratios of 1:400, whereas interior towns in the North and Northeast can exceed 1:3,000, creating pockets of unmet need that corporate chains now target with mobile operatories. Moderate-to-severe periodontitis affects an estimated 30–40% of adults, prompting clinics to replace scaling tips and surgical instruments every five to seven years. This persistent disease burden feeds replacement cycles and sustains baseline demand across the Brazil dental devices market.
Expansion of Brazil’s Supplementary Dental-Insurance Coverage
Beneficiaries reached 34.8 million in 2025, up from 21 million in 2015, giving insurers significant leverage to dictate quality standards that include digital radiography, intraoral cameras, and CAD/CAM restorations. Odontoprev, Hapvida, and Notre Dame Intermédica collectively insure more than half of this base and steer patients toward network clinics that invest in chairside scanners and cloud case management to accelerate claims. Unimed Odonto’s November 2025 roll-out of an invisible-aligner benefit for 1.2 million covered employees illustrates a gradual broadening of reimbursed orthodontic care. Coverage expansion skews toward Brazil’s Southeast and South, deepening the technology gap with underserved regions but still lifting aggregate equipment turnover nationwide. Capitation contracts reward preventive dentistry, which stimulates purchases of air-abrasion units, laser detection devices, and caries-risk assessment software, reinforcing the positive curve of the Brazil dental devices market.
Accelerating Adoption of Digital Dentistry (CAD/CAM, CBCT, 3-D Printing)
Digital workflows already move about R$4 billion in annual spend and continue growing at double-digit rates.[2] Straumann, Dentsply Sirona, and 3Shape all launched next-generation scanners in 2024 and 2025; Brazilian users report 30% faster impression capture and single-visit crown delivery, which elevates patient satisfaction and clinic profitability. Planmeca’s Emerald S and 3Shape’s TRIOS 5 integrate artificial intelligence to perform shade matching and occlusion checks on the spot, thus reducing remakes. Laboratories such as Ceddo 3D switched entirely to digitized design-to-manufacture in 2025, cutting turnaround from ten days to forty-eight hours and raising throughput by 60%. ANVISA now aligns software-as-a-medical-device evaluations with ISO 13485, making approvals swifter for low-risk add-ons yet still demanding clinical proof for novel algorithms. The immediate productivity gains fuel a rapid upgrade cycle that strengthens the Brazil dental devices market.
Rapid Scale-Up of Corporate Dental Chains & DSOs Driving Capex Cycles
Oral Unic surpassed 300 franchise practices, and Odontoprev’s network now exceeds 20,000 clinics. Each new location installs a turnkey suite comprising a treatment chair, delivery unit, digital sensor, steam sterilizer, and oil-free compressor, purchased in batches that secure 15–25% discounts versus single-office orders. Henry Schein’s 2024 acquisition of S.I.N. Implant System, together with Geistlich’s purchase of Bionnovation Biomedical, illustrates a race by multinationals to gain local production that sidesteps import duties and shortens supply chains. Straumann’s third Neodent factory came online in 2026, adding implant and aligner capacity for both domestic sales and export. DSOs’ centralized buying depresses unit prices but grows total volume, securing a resilient channel for the Brazil dental devices market.
Restraints Impact Analysis of Brazil Dental Devices Market*
| Restraint | (~) % Impact on CAGR Forecast | Geographic Relevance | Impact Timeline |
|---|---|---|---|
| High Import Taxes & FX Volatility Inflating Equipment Costs | -0.6% | National, affecting all importers and distributors | Short term (≤ 2 years) |
| Uneven Dentist Density Across Brazil's North & Northeast Regions | -0.4% | North & Northeast regions, rural and interior municipalities | Long term (≥ 4 years) |
| Post-Consumer Reverse-Logistics Mandates Boost Compliance Costs | -0.3% | National, with stricter enforcement in Southeast and South state agencies | Medium term (2–4 years) |
| Influx of Low-Cost Asian Imports Compresses OEM/Distributor Margins | -0.5% | National, affecting lower-price tiers and consumables segments | Short term (≤ 2 years) |
| Source: Mordor Intelligence | |||
High Import Taxes & FX Volatility Inflating Equipment Costs
Brazil layers a 10–35% import duty, a 0–15% industrialized products tax, federal contributions near 9.25%, and state value-added taxes of 17–19%, raising landed prices 40–80% above ex-factory quotes.[3] The real weakened from 4.96 to 5.73 per U.S. dollar between January 2024 and December 2025, so distributors either pass along currency losses or renegotiate U.S.-denominated contracts, shaving 8–12 percentage points from gross margins. The ex-tarifário program can reduce import duties to roughly 2%, yet reviews can take up to 12 months and exclude consumables. Domestic firms capitalize: Maquira sells treatment chairs at up to 40% below the price of imported peers, and S.I.N. implants often cost half as much as premium European lines. These price gaps restrain the upper end of the Brazil dental devices market even as volume migrates to lower-priced options.
Uneven Dentist Density Across Brazil’s North & Northeast Regions
The Southeast hosts 51% of Brazil’s more than 400,000 dentists, whereas the North holds just 4% despite accounting for 8% of the population. Interior municipalities in Amazonas, Pará, and Maranhão present ratios worse than 1:3,000, curtailing local equipment turnover. Although 74.4% of basic health units possess dental offices, only 11.3% provide endodontic and 17.4% provide prosthetic treatment, reflecting shortages of rotary tools, porcelain furnaces, and advanced imaging. Graduates from Northeastern dental schools often migrate to the Southeast within five years, further widening the supply gap. Franchise chains opened dozens of sites in smaller cities during 2025, yet each clinic generates 40–50% less equipment revenue than a metropolitan counterpart because of lower case complexity. Without targeted incentives, this disparity will continue to weigh on the Brazil dental devices market.
*Our forecasts treat driver/restraint impacts as directional, not additive. The impact forecasts reflect baseline growth, mix effects, and variable interactions.
Brazil Dental Devices Market Segment Analysis
By Product:
Consumables Outpace Durable EquipmentTherapeutic equipment supplied 43.02% of the value in 2025 and remains the backbone of every operatory. Digital chairside units such as DS Core combine imaging, artificial intelligence diagnostics, and cloud connectivity to cut per-procedure time by about one-third. Meanwhile, the consumables category is projected to grow at a 6.91% CAGR, the quickest in the Brazilian dental devices market, owing to single-use infection-control protocols and higher volumes of milling burs, 3-D printer resins, and orthodontic elastics. ANVISA’s updated waste-management mandate adds tracking costs, nudging clinics toward autoclavable trays for reusable tools and certified single-use packs. Diagnostic systems continue a solid run as insurers request radiographic confirmation for reimbursement, and laboratories lean on intraoral scanners to avoid physical models. Compressors, suction pumps, and autoclaves grow roughly in line with new office openings but face commoditization from Asia-sourced imports that sell at 30% discounts. Domestic brands cushion that competition by offering faster service and greater parts availability.
Demand in the Brazilian dental devices market for diagnostics, especially cone-beam computed tomography, is rising alongside implant therapy volumes. Planmeca’s Emerald S, for instance, synchronizes with third-party CAD software, enabling laboratories to design prosthetics overnight. Competing local players like Alliage and Maquira undercut premium imports while also investing in ISO-certified processes to stay in the game amid tighter RDC 925/2024 evidence rules. This combination of price-based rivalry and gradual quality convergence sustains a diverse supplier mix.

By Treatment:
Orthodontics Gains on Clear-Aligner UptakeProsthodontics accounted for 38.12% of revenue in 2025, as an older population increasingly seeks fixed and removable solutions made from ceramic or zirconia. Digital denture flows now compress chairside visits from 6 to 2 and allow labs to increase throughput by well over half. Import taxes make ceramic blocks pricey, yet patients in the upper-middle segment perceive high aesthetics as worth the extra fee, reinforcing value types within the Brazilian dental devices market.
Orthodontics is advancing at a 5.51% CAGR, making it the fastest-growing treatment segment. Corporate plans started covering aligners in late 2025, broadening demand beyond purely cosmetic buyers. Straumann’s acquisition of Smilink's Neodent provides a low-cost local manufacturing base, reducing per-case costs by 20–30% and putting pressure on overseas aligner brands. Endodontics and periodontics continue to expand, but at slower rates, because few public units have rotary files or regenerative biomaterials, even though periodontal disease now affects close to two in five adults. As public tenders begin to include ultrasonic scalers and bone graft membranes, upside remains.
By End User:
Laboratories Digitalize RapidlyDental clinics represented 59.08% of spending in 2025, with volume concentrated in large urban centers where insurer networks and corporate chains dictate purchase standards. One out of every four urban clinics now operates an intraoral scanner connected to a cloud portal, whereas interior offices often stay analog. Hospital faculties and specialty centers purchase high-ticket surgical microscopes and lasers that later trickle down to private offices.
Laboratories will outpace clinics at a 7.08% CAGR as end-to-end digitization enables a small technician crew to manage a doubling of case volume. Ceddo 3D’s shift to a fully digital pipeline illustrates cost and time advantages that smaller labs now replicate with open-architecture CAD and neutral file formats. Straumann’s new Curitiba plant will deliver implants and abutments to labs at price points 10–15% below those of imported parts, enhancing domestic supply security. Universities also maintain a steady baseline by buying mannequins, radiographic phantoms, and virtual simulation software to meet accreditation requirements.
Geography Analysis
Regional demand mirrors economic development patterns and the maturity of healthcare infrastructure across Brazil. São Paulo and Rio de Janeiro anchor the Brazil dental devices market, driven by dense practitioner bases, greater patient purchasing power, and favorable distributor logistics. Clinics in these metros readily adopt AI diagnostic tools and cloud scanners, setting technology benchmarks for the rest of the country.
Dentist shortages, lower insurance uptake, and longer supply routes add another 8–12% to landed costs, so clinics restrict purchases to core instruments and rely on mobile outreach or teledentistry pilots that are still in early regulatory limbo. Import logistics magnify regional differences: 70% of shipments come through Santos and Paranaguá ports, which cuts delivery time to Southeast and South buyers by up to ten days compared with truck hauls that cross 2,000–3,000 kilometers toward the Amazon basin. State surveillance agencies in São Paulo and Rio de Janeiro also inspect sterilization compliance more frequently, forcing clinics to cycle through autoclaves and maintenance kits more quickly, which indirectly bolsters local sales but raises operating costs.
Regulatory Landscape
ANVISA regulates dental devices under the broader medical device framework, with risk-based classification (Class I to IV) defined in RDC 751/2022. Class I and II products generally follow a notification pathway, while Class III and IV devices require full registration and deeper technical and clinical documentation, a key consideration for implant systems and other higher-risk therapeutic lines. In March 2024, ANVISA issued RDC 848/2024, updating essential safety and performance requirements for medical devices and raising the baseline for technical files and conformity evidence used across registrations.
Beyond product approvals, Brazil tightened operational compliance for providers and laboratories. In December 2025, ANVISA published RDC 1.002/2025 establishing Good Practice requirements for dental services and dental prosthesis laboratories, including device processing and equipment maintenance, with a 360-day compliance window from publication. Traceability and data obligations increased in 2025-2026 through Unique Device Identification (UDI), including mandatory UDI for Class IV devices manufactured from July 2025, and a February 2026 Normative Instruction (IN 426/2026, effective March 2026) setting rules for transmitting UDI data to the SIUD database; certain equipment categories also require conformity assessment via INMETRO-accredited bodies before ANVISA registration.
Competitive Landscape
The Brazil dental devices market is moderately fragmented. The combined share of Dentsply Sirona, Straumann Group (Neodent), Henry Schein, Solventum Oral Care, and Envista is significantly higher in 2025. Multinationals hold an advantage in integrated platforms and clinical evidence, exemplified by DS Core’s seamless imaging-to-design flow and Neodent’s competitively priced implants with domestic warranty and rapid delivery. Brazilian manufacturers counter with product lines priced 30–60% lower and same-day service; Maquira runs more than 50 regional service centers and claims downtime is rarely longer than two days.
Strategic acquisitions shape the field. Henry Schein’s purchase of S.I.N. Implant System provides a vertically integrated implant portfolio, while Geistlich’s takeover of Bionnovation Biomedical adds regenerative biomaterials made in São Paulo. Straumann also bought clear-aligner maker Smilink and opened its third local factory in 2026. Emerging digital startups such as Dio Inteligência Odontológica provide AI-based radiographic analysis, aiming to embed modules into DSOs’ workflows. Competitive intensity therefore resides not only in hardware but also in software ecosystems, financing solutions, and after-sales support, sustaining a lively but disciplined Brazil dental devices market.
Brazil Dental Devices Industry Leaders
-
Dentsply Sirona
-
Angelus Dental
-
SIN Implant System
-
Institut Straumann AG
-
ZimVie Inc.
- *Disclaimer: Major Players sorted in no particular order

Brazil Dental Devices Market Companies Covered in this Report
- 3M
- 3 Shape
- BIOLASE Inc.
- Carestream Dental
- Coltene Holding
- Dentsply Sirona
- Envista
- GC Corporation
- Henry Schein
- Ivoclar Vivadent
- Midmark
- Patterson Companies
- Planmeca
- Septodont
- Straumann Group
- ZimVie
Market Opportunities and Future Outlook
Public oral-health capacity still lags modernization efforts seen in private-sector technology adoption. Public clinics perform only a small share of complex procedures (17.4% of prosthetic interventions and 11.3% of endodontics in the report context), which shifts higher-acuity demand toward private practices and DSOs that buy imaging, endodontic motors, and implant kits. On the SUS side, the Brasil Sorridente program remains a structural procurement driver, and in October 2025 the Ministry of Health opened a public consultation on distribution of dental equipment for the SUS, indicating ongoing work around procurement specifications for chairs, handpieces, and diagnostics.
Digital dentistry is another identifiable opportunity, reflected both in spending behavior and supplier actions. The report context cites about R$4 billion in annual spend for digital workflows, while laboratories improve turnaround times through CAD/CAM and 3D printing, which supports demand for scanners, milling and printing inputs, and related service contracts. Export-oriented domestic manufacturing also supports broader product availability and service coverage: in June 2026, Alliage highlighted international expansion with exports representing 40% of revenue across more than 50 countries, which can feed back into domestic pricing, parts availability, and after-sales capability. Regulation creates a parallel path for compliant suppliers in traceability, software, and quality systems, as UDI transmission requirements and updated essential safety and performance rules (RDC 848/2024) push clinics, labs, and OEMs toward standardized documentation, connectivity, and validated workflows.
Recent Industry Developments in Brazil Dental Devices Market
- May 2026: Dentsply Sirona launched DS Core Diagnose AI-enabled 3D X-ray diagnostic features in Brazil, adding cloud-based analysis workflows for users of its CBCT systems. The release strengthens platform stickiness around imaging-to-diagnosis software and supports clinics seeking faster interpretation and standardized reporting across multi-site operations.
- February 2026: Dentsply Sirona introduced the MAGNETOM Free.Max Dental Edition to Brazil following ANVISA approval, positioning it as a dental-exclusive MRI offering for the region. The launch broadens advanced imaging options beyond CBCT for complex cases and raises the competitive bar for premium diagnostic equipment portfolios.
- February 2025: Straumann Group expanded capacity at its Curitiba factory to support Neodent growth, with the added output scheduled to become operational by 2026. Additional local capacity supports shorter lead times and reduced exposure to import frictions, reinforcing the role of domestic manufacturing in implants and adjacent restorative components.
Brazil Dental Devices Market Report Scope and Research Methodology
Market Definition and Coverage
For this study, the market covers revenue generated from dental devices and related consumables sold for use in dental diagnosis and treatment in Brazil, across routine care and specialized procedures, during the stated historical and forecast period.
Scope exclusions: It excludes dental services revenue (chair time), general clinic overhead costs, and non-dental medical devices used outside dental settings.
Segments Covered in This Report
- By Product
- Diagnostics Equipment
- Therapeutic Equipment
- Dental Consumables
- Other Dental Equipments
- By Treatment
- Orthodontic
- Endodontic
- Periodontic
- Prosthodontic
- By End User
- Dental Hospitals
- Dental Clinics
- Dental Laboratories
- Other End Users
Data Sources, Market Sizing, and Validation
Desk Research
Desk research was used to set the base structure of the model and to understand how dental care demand and supply are moving in Brazil. We relied on public, non-paywalled references such as Brazil Ministry of Health publications, IBGE demographic and income indicators, ANVISA regulatory and recall notices, and UN Comtrade trade statistics for dental equipment and consumables.
To convert those signals into a usable market view, company annual reports, investor presentations, and local association websites were reviewed to understand product availability, channel patterns, and price direction. We also used a paid subscription focused on company financials and another focused on import and export shipment level data to pressure-test supplier activity and the timing of large equipment inflows. The desk sources listed here are illustrative only, and other public sources were used to cross-check and clarify assumptions where needed.
Primary Interviews and Surveys
Primary work was done through expert interviews and structured surveys with manufacturers, importers and distributors, dental clinic operators, lab owners, and dentists involved in equipment purchasing. Because this is a Brazil-only market, we aimed for coverage across major demand centers and also smaller interior markets, so assumptions on mix and pricing did not get overly skewed toward premium urban clinics. Respondent input also clarified how clinics and labs time equipment replacement and how consumables purchasing is tied to procedure volume in Brazil.
Distribution of primary research fieldwork respondents
| Company type | Respondent position |
|---|---|
| Top tier: 28% | CXOs: 14% |
| Mid tier: 56% | Functional/Unit leaders: 26% |
| Smaller Players: 16% | Managers: 60% |
Market-Sizing & Forecasting
Sizing was built using a top-down and bottom-up approach, where national demand signals were first reconstructed and then cross-checked with selective supplier-side math. On the top-down side, we built a demand pool using indicators such as the number of practicing dental professionals, dental visit intensity, procedure mix (for example, restorative versus orthodontic), and typical device replacement cycles for large equipment.
Once the demand pool was shaped, the value layer was added using a practical price logic, where average selling prices were adjusted by device type and import intensity, and then aligned with channel markups mentioned in interviews. To keep the totals realistic, we corroborated them with sampled bottom-up approximations such as distributor sell-in ranges, import arrival timing checks, and revenue splits shared by participants for key product groups. When gaps showed up, we used conservative proxy rules, such as procedure-linked consumption rates for consumables and replacement-led assumptions where new clinic openings data was thin.
For forecasting, we used scenario analysis supported by primary inputs, because growth can swing based on credit availability for clinics, currency movement that affects imported devices, and changes in consumer spending. The forward path was then stress-tested against macro variables, and the final curve was smoothed so it aligned with what buyers and sellers described as realistic purchasing behavior over the cycle.
Data Validation & Update Cycle
Outputs were checked through multiple passes before sign-off, where the market totals were compared against independent signals like import trends, installed base growth narratives, and observable pricing direction in distributor channels. If a segment moved too sharply versus these checks, we revisited the assumption stack and re-contacted relevant interviewees to confirm whether a one-time event or a structural shift was being captured.
An internal review step was done to confirm arithmetic consistency, currency handling, and that segment totals rolled up cleanly to the overall market. The report is refreshed annually, and interim updates are made when material events occur (such as major regulatory actions or large pricing shocks). Before delivery, the latest public signals are re-scanned so clients receive an up-to-date view.
Mordor Intelligence's Brazil Dental Devices Market Sizing Compared With Other Published Estimates
Published market sizes for Brazil dental devices can differ even when the topic label looks the same, because the counted basket of products and the timing assumptions behind prices and currency can change from one study to the next. Differences also come from how much weight is given to imports versus local distribution, and whether forecasts assume steady replacement demand or a faster technology upgrade cycle.
By tracking import intensity, procedure-linked consumables consumption, and currency timing checks, Mordor Intelligence sits closer to a practical demand pool for Brazil than estimates that mainly extrapolate long-term growth rates or use broader device boundaries.
Benchmark comparison
| Source | Market Size | Gaps in Research Methodology |
|---|---|---|
| Mordor Intelligence | USD 316.56 M (2026) | |
| Industry Publisher A | USD 255.30 M (2025) | This estimate uses a different base year and can understate near-term value if price inflation and import-led equipment cycles are not carried into the next year consistently, especially when currency timing is simplified. |
| Trade Publisher B | USD 236.10 M (2024) | This number appears to be anchored to an earlier year and may rely on a narrower device basket or older price points, which can pull the market down when the mix shifts toward higher-value equipment and implant-related consumables. |
The spread across sources mainly comes from base year choice and from how devices and consumables are bundled into the scope, followed by how pricing and currency are carried through the model. With clearer demand indicators and repeatable price logic, the estimate stays easier to trace and to update when Brazil-specific market conditions change.
Key Questions Answered in the Report
What value will the Brazil dental devices market reach by 2031?
It is projected to reach USD 384.92 million by 2031 at a 4.05% CAGR.
Which product segment is growing fastest in Brazil?
Dental consumables are forecast to expand at a 6.91% CAGR due to infection-control needs and digital workflow supplies.
Why are import costs so high for dental equipment in Brazil?
A cascade of duties, federal levies, state taxes, and a weaker real lifts landed costs 40–80% above ex-factory prices.
How are clear aligners influencing orthodontic demand?
Corporate insurance now covers invisible aligners, lowering patient out-of-pocket costs and driving a 5.51% CAGR in orthodontic revenue.
What trend is accelerating equipment turnover in laboratories?
End-to-end CAD/CAM and 3-D printing workflows cut prosthetic turnaround to under two days, prompting rapid adoption of digital fabrication tools.