
Market Overview
| Study Period | 2020 - 2031 |
|---|---|
| Forecast Data Period | 2026 - 2031 |
| Base Year Market Size (2025) | USD 5.42 Billion |
| Market Size (2026) | USD 5.64 Billion |
| Market Size (2031) | USD 6.92 Billion |
| Growth Rate (2026 - 2031) | 4.15 % |
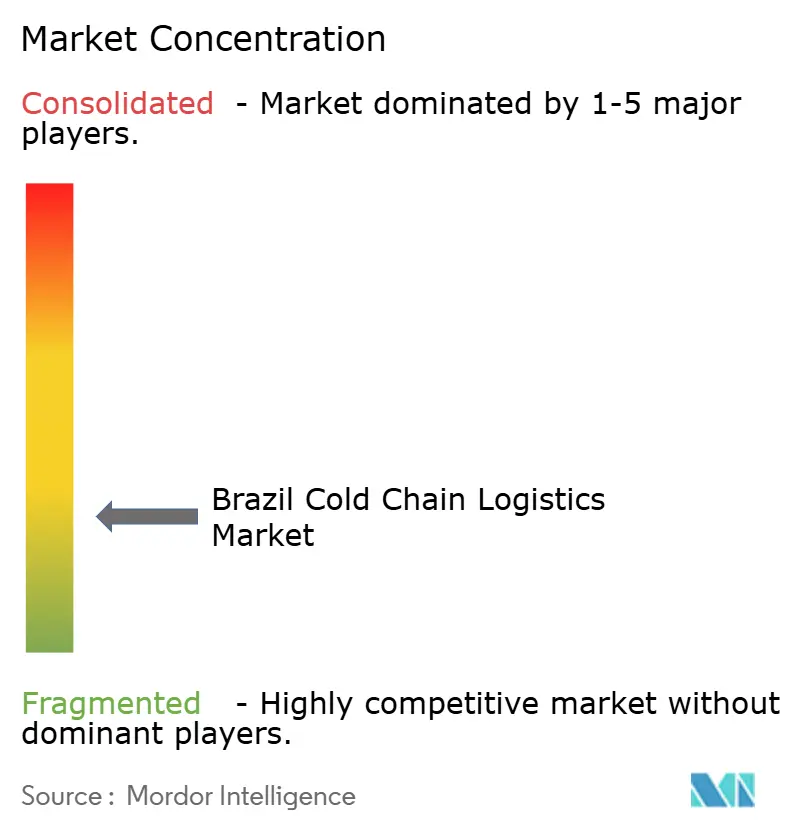
| Market Concentration | Low |
Major Players *Disclaimer: Major Players sorted in no particular order Image © Mordor Intelligence. Reuse requires attribution under CC BY 4.0. | |
Brazil Cold Chain Logistics Market Analysis by Mordor Intelligence
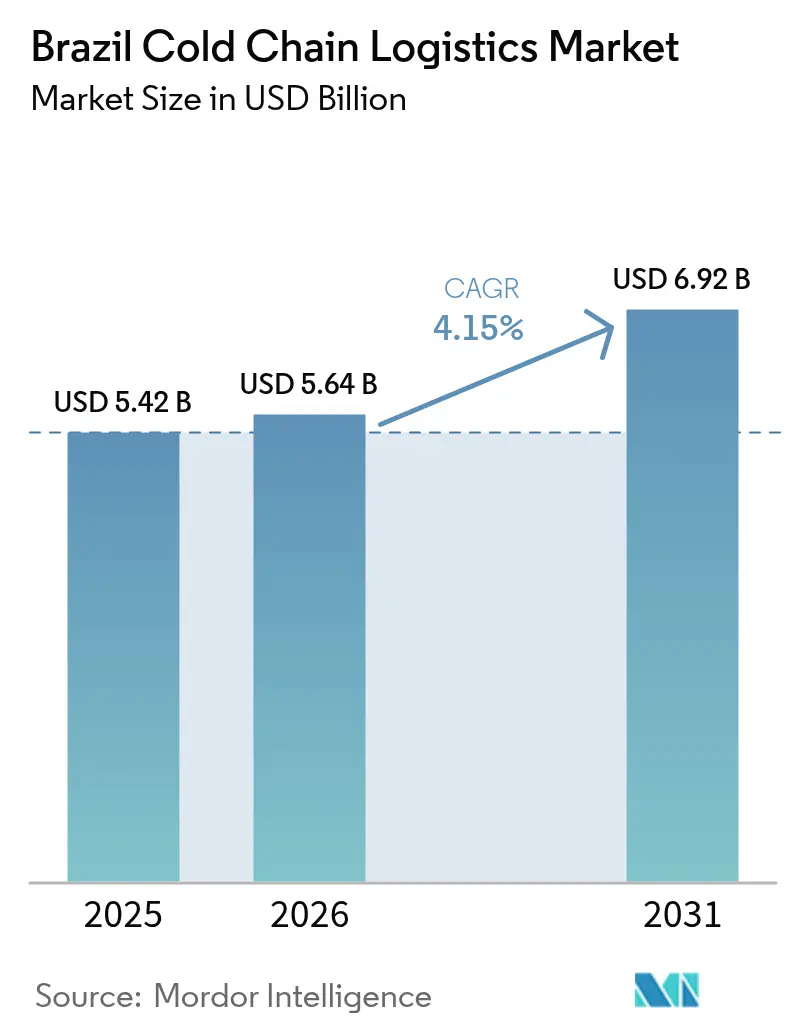
The Brazil Cold Chain Logistics Market size is expected to grow from USD 5.42 billion in 2025 to USD 5.64 billion in 2026 and is forecast to reach USD 6.92 billion by 2031 at 4.15% CAGR over 2026-2031.
The growth trajectory is supported by the country’s role as a high-volume agricultural exporter, the rapid scale-up of domestic vaccine production, and rising urban demand for convenience foods. Investments in multimodal infrastructure, digitalized warehouse management, and ultra-low-temperature storage continue to lift service quality, even as chronic electricity price volatility and driver shortages elevate operating costs. International entrants are accelerating technology transfer and ESG standards, while local specialists defend market share through geographic coverage and long-term customer contracts. Although the economy faces cyclical headwinds, the structural drivers behind temperature-controlled logistics food safety rules, e-commerce fulfillment expectations, and the reshoring of biopharma manufacturing remain intact, anchoring medium-term opportunities in the Brazil cold chain logistics market.
Key Report Takeaways
- By service type, Refrigerated Storage led with 50.62% revenue share in 2025, while Value-Added Services is forecast to expand at a 4.16% CAGR through 2031.
- By temperature range, Frozen (-18 °C–0 °C) captured 56.88% of Brazil cold chain logistics market share in 2025; Chilled (0 °C–5 °C) is advancing at a 3.58% CAGR to 2031.
- By application, Meat & Poultry accounted for 29.05% of the Brazil cold chain logistics market size in 2025, whereas Ready-to-Eat Meals is projected to grow at 4.26% CAGR between 2026 and 2031.
- By geography, the Southeast corridor commanded the largest slice of the Brazil cold chain logistics market in 2025, and the North–Northeast cluster is the fastest-growing area at a mid-single-digit CAGR, supported by PAC-funded distribution centers.
Note: Market size and forecast figures in this report are generated using Mordor Intelligence’s proprietary estimation framework, updated with the latest available data and insights as of 2026.
Brazil Cold Chain Logistics Market Trends and Insights
Drivers Impact Analysis*
| Driver | % Impact on CAGR Forecast | Geographic Relevance | Impact Timeline |
|---|---|---|---|
| Booming national demand for frozen ready-to-eat meals | 0.8% | National, concentrated in São Paulo, Rio de Janeiro, Brasília | Medium term (2-4 years) |
| Rapid growth of pharmaceutical biologics & vaccines | 1.2% | National, with manufacturing hubs in São Paulo, Rio de Janeiro | Long term (≥ 4 years) |
| Acceleration of supermarket e-commerce fulfilment | 0.9% | National, urban centers leading adoption | Short term (≤ 2 years) |
| Government-funded expansions of regional distribution centres | 0.7% | North & Northeast regions, secondary cities | Long term (≥ 4 years) |
| On-port pre-cooling incentives for perishable exporters | 0.4% | Coastal regions, Santos, Rio Grande, Paranaguá ports | Medium term (2-4 years) |
| Emergence of carbon-credit-linked refrigeration financing | 0.3% | National, industrial zones prioritized | Long term (≥ 4 years) |
| Source: Mordor Intelligence | |||


Booming Frozen Ready-to-Eat Meal Demand
Brazilian urban households are reallocating disposable income toward convenience, lifting frozen entrée volumes across modern retail and food-service channels. Rising female workforce participation shortens cooking times, and dual-income families intensify weekday demand for portion-controlled frozen options. National restaurant-to-home delivery platforms are adding chilled lockers inside residential complexes to preserve temperature integrity until pick-up, reinforcing the need for short-haul urban refrigerated fleets. Retail groups have responded by designating expanded freezer aisles for premium protein-rich dishes, requiring additional back-of-store blast-freezing capacity. Cold storage operators are monetizing the trend by renting pallet positions on seasonal contracts aligned to holiday peaks. Importantly, mid-sized regional processors prefer outsourcing value-added services, such as in-line IQF glazing and nitrogen tunnel freezing, to mitigate capital outlays on specialized equipment[1]“Governo Federal anuncia primeira vacina 100% nacional e de dose única contra a dengue,” Government of Brazil, gov.br.
Rapid Growth of Pharmaceutical Biologics and Vaccines
Federal incentives for on-shore vaccine sovereignty have triggered unprecedented upgrades in ultra-low-temperature storage. Instituto Butantan’s facility expansion to supply 60 million dengue doses per year starting in 2026 demands consistent -60 °C to -80 °C lanes from plant to public clinic. Similar conditions apply to mRNA investigational products handled by private CROs at hub sites in Campinas and Rio[2]“How Brazil’s 2035 logistics plan could transform crop production and global trade,” Purdue University Agribusiness, agribusiness.purdue.edu. Multinationals have responded: DHL is rolling out GDP-certified pharma hubs calibrated for lane risk mapping and active container staging. Smart-probe IoT devices integrated with digital control towers transmit location and temperature every fifteen minutes, enabling predictive hold-over power management during blackouts. Insurance providers now price premium reductions for validated data trails, reinforcing adoption.
Acceleration of Supermarket E-commerce Fulfillment
Online grocery share accelerated post-pandemic and continues to expand as retailers promise two-hour delivery windows under dynamic pricing. Mercado Libre’s plan to lift national DC count from 10 to 21 by end-2025 adds 880,000 m² of multizone climate-controlled capacity. Mixed-temperature orders require mathematically optimized pick sequencing, and retailers are investing in shuttle systems that combine frozen, chilled, and ambient items into insulated totes. Autonomous routing software increases truck fill factors while minimizing door-open events, lowering spoilage. The shift toward e-commerce elevates demand for city micro-fulfillment nodes with cross-docking functions that can reset pack temperatures before last-mile dispatch.
Government-Funded Regional Distribution Centers
The Growth Acceleration Program channels concessional credit toward hinterland DCs, aiming to bridge north–south logistics cost gaps. The Transnordestina railway revival captures grain and meat flows from interior producing belts, offering energy-efficient alternatives to diesel road hauls. Cold-chain investors gain multi-year property-tax abatements conditional on deploying solar-assisted refrigeration and training local technicians. Regional cooperatives use the new facilities to consolidate fruit exports, cutting pre-cooling time at ports and raising product premiums. The initiatives also seed retail expansion as modern supermarkets follow infrastructure upgrades[3]“A Brazilian breakthrough in eco-friendly refrigeration,” United Nations Industrial Development Organization, unido.org.
Restraints Impact Analysis*
| Restraint | % Impact on CAGR Forecast | Geographic Relevance | Impact Timeline |
|---|---|---|---|
| Chronic electricity price volatility | -0.6% | National, industrial regions most affected | Short term (≤ 2 years) |
| Truck driver shortage & restrictive driving-time rules | -0.4% | National, long-haul routes severely impacted | Medium term (2-4 years) |
| Fragmented last-mile infrastructure in North & Northeast | -0.3% | North & Northeast regions, rural areas | Long term (≥ 4 years) |
| Lack of uniform GDP-compliant quality audits | -0.2% | National, pharmaceutical sector priority | Medium term (2-4 years) |
| Source: Mordor Intelligence | |||
Chronic Electricity Price Volatility
Aging grid assets and extreme-weather-related outages forced cold-store operators to activate diesel gensets eleven times on average in 2024. Each event added unbudgeted fuel cost and compressor restart stress, cutting equipment life. Grid planners foresee 50% distributed-generation penetration by 2029 without matching transmission upgrades, implying continued tariff fluctuation. Operators are countering through variable-frequency drives, phase-change buffer walls, and rooftop solar arrays with lithium-ion storage sized for four-hour autonomy. While capex is high, loan guarantees under the BRL 186.6 billion (USD 38.44 billion) industrial digitalization program lower financing costs. However, small warehousing cooperatives still struggle to self-fund resiliency measures, limiting overall industrywide impact.
Truck Driver Shortage & Restrictive Driving-Time Rules
Long-haul refrigerated carriers operate with a vacancy rate near 12%, driven by demographic attrition and regulatory limits capping consecutive hours behind the wheel. Cold chain timetables are particularly exposed because temperature deviation risk heightens with unplanned layovers. Spot freight rates on the North-South corridor rose in mid-2025 as shippers competed for compliant capacity. Fleet operators try to retain drivers via profit-sharing and cab comfort upgrades, but training throughput lags retirements. Logistics associations lobby for modular road-train allowances to move larger volumes per driver, yet infrastructure readiness (bridge weight limits, turn radii) remains patchy. Autonomous platooning pilot projects by Volvo and Scania offer a long-term pathway, though commercial deployment is several years away.
*Our forecasts treat driver/restraint impacts as directional, not additive. The impact forecasts reflect baseline growth, mix effects, and variable interactions.
Segment Analysis
By Service Type: Storage Dominates, Services Differentiate
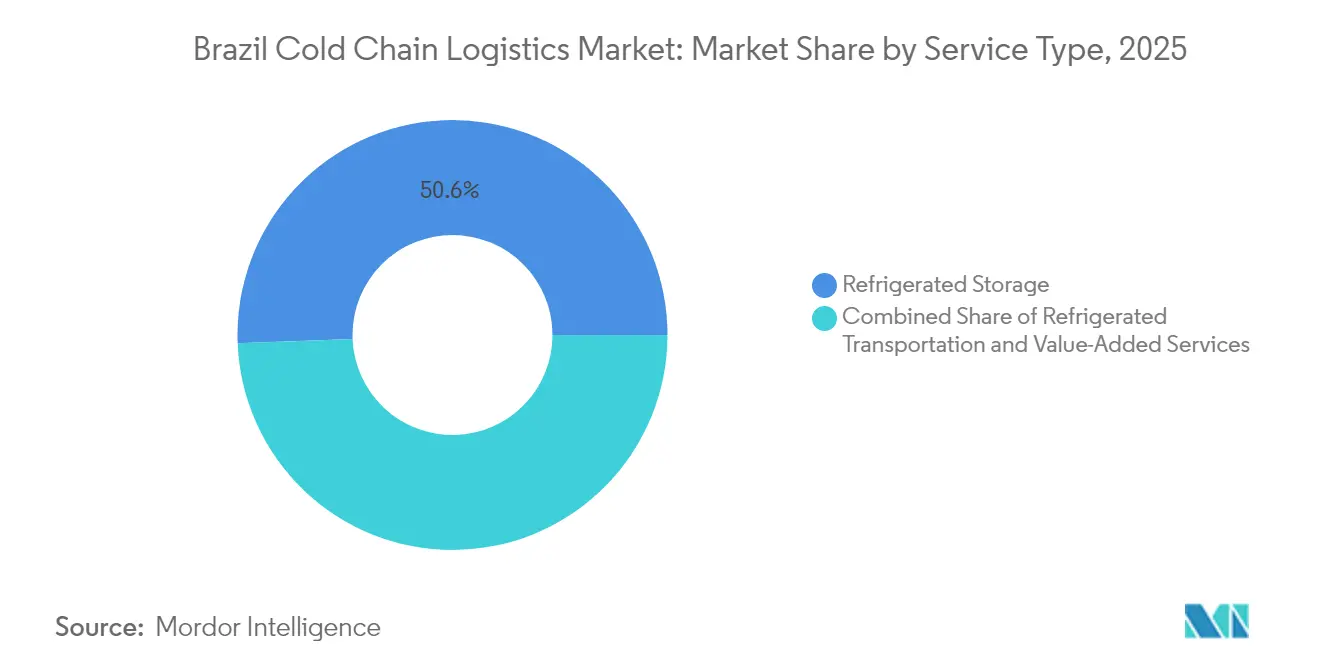
Refrigerated Storage accounted for 50.62% of Brazil cold chain logistics market share in 2025, reflecting the need to buffer protein exports and synchronize farm output with vessel schedules. Value-Added Services registered the fastest 4.16% CAGR forecast, propelled by client outsourcing of labeling, blast-freezing, kitting, and GDP compliance audits. Multinational 3PLs leverage standardized SOPs to win pharmaceutical contracts, while domestic warehouse specialists such as SuperFrio add bespoke chambers sized for butchered carcasses and IQF berries. Brazil cold chain logistics market size tied to private storage is widening faster than public facilities because producers prefer dedicated racking heights, ammonia-glycol systems, and integrated WMS interfaces. On the transport front, road continues to dominate, but double-stack reefer railcars on the Ferrovia Norte-Sul corridor demonstrate early proof of concept for lower-carbon long-haul moves.
The rise of value-added outsourcing opens ancillary revenue streams around KPI analytics, pallet-level RFID, and in-house customs brokerage. DHL’s announced EUR 2 billion (USD 2.20 billion) global health-logistics program directs 50% of capex to the Americas, including Brazil, to establish validated pharma hubs and first-to-final-mile cryogenic lanes. Local operators counter by pooling resources; Emergent Cold LatAm’s Rio acquisition delivered convertible chambers that switch between freezer and chiller mode within eight hours, maximizing utilization. These moves illustrate how service breadth and asset flexibility increasingly dictate competitive positioning within the Brazil cold chain logistics market.


By Temperature Type: Frozen Still Leads but Chilled Climbs
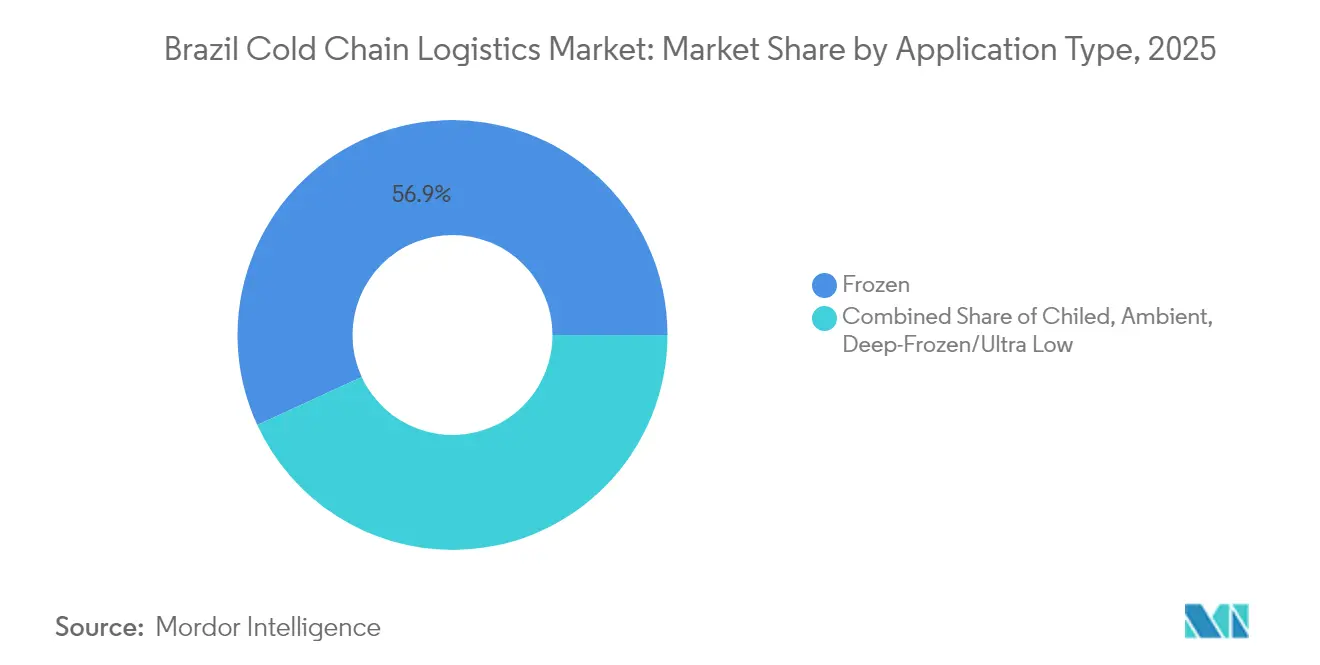
Frozen lanes preserved 56.88% of 2025 revenue as Brazil exported high-volume beef, poultry, and seafood under World Organization for Animal Health guidelines. Yet chilled throughput is expanding at a 3.58% CAGR on the back of domestic dairy, craft beverage, and fresh-produce trade. Retailers run category management resets that shrink ambient center-store space in favor of expanded chilled assortments, pushing DC operators to invest in high-humidity dock areas and rapid-cool alcoves. Brazil cold chain logistics market size tied to vaccines also lifts demand for deep-frozen gear: Instituto Butantan’s dengue output needs -60 °C freezers and dual-redundant liquid nitrogen backup. Although ultra-low volumes remain modest, margins are superior because of specialized packaging and validation requirements.
Technological progress accelerates the chilled segment’s momentum. Brazilian OEMs such as Eletrofrio introduced microchannel condensers that cut refrigerant charge by 93% and drop kWh draw 15%, enhancing ROI. Start-ups collaborate with universities on phase-change composite panels that hold 2 °C, -4 °C for 24 hours, enabling non-mechanical last-mile delivery in regions with unstable power. Looking ahead, statewide carbon-credit programs are expected to lower payback periods on hydrocarbon-based chillers, tilting capex decisions toward greener specifications.
By Application: Protein Legacy Meets Convenience Revolution
Meat & Poultry commanded 29.05% of Brazil cold chain logistics market size in 2025 and remains foundational to export receipts. Plants in Mato Grosso spread output across multi-temperature networks, linking grow-out farms to slaughterhouses, distribution centers, and port pre-coolers. Fruits & Vegetables follow as a key user of quick-turnaround chilled storage, with mango, papaya, and melon exporters embracing ethylene scrubber technology to reduce spoilage. Ready-to-Eat Meals, though smaller today, is the fastest-growing category at 4.26% CAGR as lifestyle shifts reinforce single-serve frozen entrée adoption. This segment leans heavily on IQF tunnels, nitrogen dosing, and portion-controlled packaging lines, spurring demand for warehouse zoning that keeps cook-freeze workflows separate from raw protein docks.
Pharmaceuticals & Biologics, including vaccines, post double-digit revenue gains and require precise lane validation, datalogger analytics, and dedicated loading bays with HEPA filtration. Dairy & Frozen Desserts benefit from Nestlé’s USD 1.4 billion investment that modernizes confectionery plants and raises freezer demand for chocolate transport. Chemicals & Specialty Materials remain a niche slice, yet stringent REACH-equivalent regulations motivate chemical shippers to outsource GDP-equivalent audits, bolstering premium margin stacks for certified 3PLs. Collectively, the plural application mix highlights why operators seek modular builds allowing rapid repurposing among protein, produce, and pharma flows hallmarks of a resilient Brazil cold chain logistics market.
Geography Analysis
The Southeast corridor, anchored by Sao Paulo and Rio de Janeiro, captures the lion’s share of Brazil cold chain logistics market activity, owing to port connectivity at Santos and proximity to pharma manufacturing clusters. Sao Paulo’s USD 6 billion infrastructure outlay in 2025 expands highway interchanges and last-mile cold warehouses, amplifying throughput for intra-regional groceries and export-bound proteins. The region also hosts Merck’s USD 21.7 million distribution hub that brings GDP-validated secondary packaging lines under one roof. Dense urban populations further accelerate e-commerce grocery growth, pushing demand for chilled cross-docks within 30 km of high-rise neighborhoods.
Southern states such as Rio Grande do Sul and Paraná rank second in revenue, backed by integrated meat-packing complexes and grain export channels. Flood damage in 2024 exposed vulnerabilities, but utilities subsequently earmarked BRL 1.8 billion (USD 370.82 million) to harden electricity infrastructure, preserving cold-store uptime. Marine gateways at Paranaguá leverage new on-dock pre-cooling incentives that shorten cycle times for fruit exporters and reduce reefer plug queues. Cross-border flows into Uruguay and Argentina use bonded reefer trucks, benefiting from unified sanitary protocols ratified in early 2025.
The North and Northeast, though currently underpenetrated, register the fastest expansion. PAC-financed DCs open capacity pockets in secondary cities such as Feira de Santana, serving as consolidation nodes for tropical fruit and seafood. The Transnordestina railway’s phased activation lowers inland freight costs up to 15% versus road, making chilled melon exports more competitive. Still, fragmented roadways and intermittent power supply mean operators must deploy diesel-backup gensets and mobile data loggers to satisfy importer audit trails. Government ESG policy encourages photovoltaic cold rooms at regional airports, signaling greener growth for the Brazil cold chain logistics market.
Regulatory Landscape
Brazil cold chain logistics compliance is shaped by separate federal regimes for pharmaceuticals and food/agro. For medicines and other health products, ANVISA sets Good Distribution, Storage, and Transport Practices via RDC 430/2020, which requires documented thermal qualification, active temperature monitoring, and auditable procedures for storage and transport operators. Participation in regulated pharma logistics also hinges on ANVISA authorizations (including Operating Authorization, AFE, and where applicable, Special Authorization, AE), raising the bar for GDP-aligned facilities and lane validation.
For animal-origin and other agro-industrial products, MAPA governs sanitary controls under RIISPOA (Decree 9013/2017). The framework reinforces temperature control and traceability through production, transit, and storage, including export-linked movements. Food safety expectations also tighten handling practices through ANVISA microbiological standards (RDC 724/2022), which increases requirements for time-temperature discipline in transport and cross-docking. For international transit and export flows, MAPA habilitation through Vigiagro for warehouses, terminals, and bonded facilities remains a key administrative gate for operators serving port and border corridors.
Value Chain Analysis
The Brazil cold chain logistics value chain starts with shippers in agribusiness (meat, poultry, seafood, fruits and vegetables) and industrial users (pharmaceuticals, biologics, vaccines, specialty chemicals), then moves through pre-cooling and primary processing sites, refrigerated storage (public and private warehouses), and multimodal transport legs. In export-oriented lanes, product typically shifts from plant cold rooms to inland consolidation warehouses and port-side reefer yards and terminals (including Santos, and Southern gateways such as Paranaguá and Rio Grande), where plug availability, queue times, and documentation readiness influence dwell time and temperature risk.
Service delivery is anchored by cold-store operators, reefer trucking fleets, packaging and value-added service providers (blast freezing, labeling, kitting), and the technology layer (WMS, TMS, IoT probes, electronic temperature logging and traceability). Oversight and standards apply across the chain via ANVISA (pharma distribution and food-transport controls) and MAPA (animal-origin and agro defense), which supports demand for validated processes and digital records that can pass audits. On the public-health side, the Ministry of Health defines the national immunobiological cold chain network (Rede de Frio) as an end-to-end system spanning storage, handling, and distribution from laboratory to user, reinforcing the role of specialized hubs and compliant last-mile delivery for vaccines and related materials. Structural bottlenecks are concentrated in road and port capacity constraints and the operational burden created by power volatility, which pushes operators toward redundancy (backup power, monitoring, and standardized SOPs).
Competitive Landscape
Brazil cold chain logistics industry hosts a mixture of domestic specialists and global multinationals, producing a moderately consolidated environment. DHL, Kuehne + Nagel, and Nippon Express leverage global networks, standardized SOPs, and proprietary TMS platforms to court high-value pharma customers. DHL’s takeover of CRYOPDP in March 2025 folds niche cryogenic capabilities into its Brazilian franchise, widening its moat in biologics and clinical-trial support. Emergent Cold LatAm expands footprint by acquiring a Rio facility optimized for multi-temperature switching, signaling rising M&A momentum.
Local champions such as SuperFrio and Brasfrigo lean on extensive hinterland coverage and multi-decade commodity relationships to defend share. Joint-venture models with agribusiness cooperatives enable them to pre-book storage volumes before harvest cycles, ensuring asset utilization. Technology adoption differentiates players: IoT probes, AI-led inventory forecasts, and automated shuttle systems raise throughput per square foot by 18% on average. Sustainability credentials now influence bid awards; fleets with Euro-VI or electric rigid trucks, like Scania’s first 300 km-range unit sold to Reiter Log in late 2024, gain access to low-emission zones.
Regulatory harmonization also shapes rivalry. The advancement of PL 3757/2020 sets baseline obligations for traceability, driver training, and incident reporting, which larger firms absorb with minor incremental cost, while smaller incumbents struggle to upgrade IT systems. As a result, analysts anticipate a gradual rise in market concentration over the next five years, particularly in the pharmaceutical and ready-meal verticals where audit overhead favors scale.
Brazil Cold Chain Logistics Industry Leaders
Friozem Armazens Frigorificos Ltda.
Emergent Cold LatAm
Comfrio Logística
Brado Logistics SA
Movecta
- *Disclaimer: Major Players sorted in no particular order

Market Opportunities and Future Outlook
Port-adjacent cold chain infrastructure and reefer-handling capacity represent active whitespace as exporters try to reduce dwell time and preserve temperature integrity at gateways. Recent investments show a shift toward dedicated cold terminals and higher reefer plug density, including Pecem Port in Ceara, which added a large cold cargo terminal footprint in 2025, and Maersk, which expanded reefer-supporting inland depots near Southern export corridors (Rio Grande and Paranagua) in 2026. These additions create room for service bundles that combine storage, pre-cooling, documentation, and drayage coordination for meat, poultry, seafood, and fruit shippers.
Pharmaceutical and vaccine logistics is another opportunity area because compliance requirements translate into demand for validated storage, qualified transport, and data-backed traceability aligned with ANVISA RDC 430/2020. Evidence of capital flowing into this vertical includes a reported BRL 180 million capex cycle in 2026 targeting pharma cold chain automation and thermal control, alongside ongoing network build-outs by logistics players and distributors. The shift in facility-location economics highlighted by the 2025 tax reform (destination-based CBS/IBS model) also supports network redesign toward DCs closer to consumption centers, favoring operators that can provide multi-temperature footprints, urban cross-docks, and digitally controlled inventory for supermarket e-commerce and ready-meal distribution.
Recent Industry Developments
- May 2026: Friozem inaugurated its Rio 2 distribution center in Duque de Caxias (RJ) with a reported investment of BRL 95 million. The site added about 116,000 m3 and 19,200 pallet positions, lifting the companys regional capacity by around 50%. The expansion strengthens Rio de Janeiro metro coverage for multi-client cold storage and shortens replenishment cycles for food and temperature-sensitive industrial customers.
- November 2025: Friozem started operations at a new cold logistics hub in Sapucaia do Sul (RS) at Ecoparque Lourenco & Souza, supported by an investment reported at BRL 100 million. The move replaced prior capacity impacted by the 2024 floods and modernized the footprint in a key Southern distribution corridor. Upgraded assets in the region improve service continuity for protein and dairy shippers that rely on stable cold storage and trucking links.
- November 2024: Emergent Cold LatAm inaugurated its second warehouse in Guarulhos (SP) as part of an investment reported at BRL 400 million. The addition increased the companys national storage capacity by about 20% to roughly 347,000 m3. Concentrating new capacity near Greater Sao Paulo supported higher-throughput, multi-temperature operations for retail and food-service clients and increased competitive pressure on incumbent metro-area cold stores.


Research Methodology Framework and Report Scope
Market Definition and Coverage
For this methodology, the Brazil cold chain logistics market is defined as revenue earned from temperature-controlled logistics services that keep products within required temperature ranges during storage, handling, and transportation within Brazil.
Scope exclusions: This sizing excludes in-house captive cold rooms owned by manufacturers or retailers when they are not offered as third-party logistics services.
Segmentation Overview
- By Service Type
- Refrigerated Storage
- Public Warehousing
- Private Warehousing
- Refrigerated Transportation
- Road
- Rail
- Sea
- Air
- Value-Added Services
- Refrigerated Storage
- By Temperature Type
- Chilled (0-5 °C)
- Frozen (-18-0 °C)
- Ambient
- Deep-Frozen / Ultra-Low (less than-20 °C)
- By Application
- Fruits and Vegetables
- Meat and Poultry
- Fish and Seafood
- Dairy and Frozen Desserts
- Bakery and Confectionery
- Ready-to-Eat Meals
- Pharmaceuticals and Biologics
- Vaccines and Clinical Trial Materials
- Chemicals and Specialty Materials
- Other Perishables
Data Sources, Market Sizing, and Validation
Desk Research
Desk research was used to build the starting structure for the model and to anchor it to measurable Brazil indicators. We reviewed public materials such as IBGE statistics for food and industrial output signals, and ANVISA publications that outline regulated handling expectations for temperature-sensitive pharmaceuticals. Trade and port signals were also checked through sources such as COMEX Stat and government trade releases, focusing on flows that typically require refrigerated handling.
To avoid relying on a single data stream, we also used reference points from association and development bodies such as ABOL publications on logistics operators, MAPA releases tied to animal protein and agrifood movements, and relevant peer-reviewed supply chain and refrigeration studies. Company filings, investor decks, and reputable press were used to confirm capacity additions, warehouse openings, and changes in the service mix. Where available, paid subscriptions were used only for company financials and intelligence, shipment-level import export checks, and patent databases that indicate technology adoption, and then were reconciled back to public evidence. This list is illustrative and not exhaustive, since many other sources were used for collection, validation, and clarification.
Primary Interviews and Surveys
Primary work focused on validating what share of temperature-controlled activity is outsourced, how pricing is quoted (pallet-day, cubic meter, lane-based freight), and what utilization and seasonality look like across key corridors. We spoke with logistics operators, cold storage managers, reefer transport providers, and demand-side shippers from food and beverage, meat and seafood, dairy, and pharmaceuticals to confirm assumptions that desk sources could not explain cleanly. To keep it grounded in Brazil realities, views were gathered across major consumption and production centers, then reconciled into one consistent national model.
Distribution of primary research fieldwork respondents
| Company type | Respondent position |
|---|---|
| Top tier: 31% | CXOs: 17% |
| Mid tier: 52% | Functional/Unit leaders: 26% |
| Smaller Players: 17% | Managers: 57% |
Market-Sizing & Forecasting
The model starts with a top-down rebuild of the served demand pool in Brazil, where cold chain need is inferred from the movement and handling requirements of perishable foods and temperature-sensitive healthcare products, then converted into logistics service revenue. Once that demand pool is established, we corroborate it using selective bottom-up checks, such as sampling cold storage capacity additions, typical utilization ranges, and lane-based refrigerated freight pricing to confirm that totals remain realistic.
Key inputs used to shape the market math include refrigerated warehouse capacity and occupancy patterns, reefer fleet availability and replacement cycles, energy and refrigerant cost pressure that affects storage pricing, the split of chilled versus frozen handling, and the pace of pharmaceutical distribution tightening around compliance and traceability. For forecasting, scenario analysis was applied, followed by variable-level agreement checks from primary respondents on how utilization, pricing, and outsourced penetration may move year by year. Where bottom-up information was missing for smaller locations, gaps were bridged using corridor benchmarks, adjusted with city-level economic activity signals, and then rechecked for reasonableness.
Data Validation & Update Cycle
Outputs were validated through a stepwise set of checks so totals do not drift away from real-world signals. We compare modeled revenue against independent indicators such as trade flow direction, warehouse expansion announcements, and observed freight market tightness, then review anomalies before sign-off.
If a major variance appears, assumptions are revisited and, when needed, respondents are re-contacted to confirm what changed and why. Reports are refreshed annually, with interim updates triggered by material events such as regulatory changes, large capacity additions, or abrupt pricing shifts. Before delivery, the latest public information is rechecked so clients receive an updated view.
Mordor Intelligence's Brazil Cold Chain Logistics Market Sizing Compared With Other Published Estimates
Published market numbers for Brazil cold chain logistics often differ because the service boundary is not consistent, and because companies use different years, exchange-rate timing, and pricing logic. In this topic, the biggest swings usually come from whether captive cold storage is counted, whether cross-border cold chain is mixed into domestic revenue, and whether value-added services are priced as separate revenue lines or bundled.
By tracking capacity utilization, reefer fleet availability, and service pricing movements, Mordor Intelligence keeps the estimate focused on outsourced temperature-controlled logistics revenue in Brazil, instead of mixing it with broader cold chain infrastructure value or wider logistics spending.
Benchmark comparison
| Source | Market Size | Gaps in Research Methodology |
|---|---|---|
| Mordor Intelligence | USD 5.42 B (2025) | |
| Trade Association A | USD 35.70 B (2024) | Uses an annual spending value cited in local currency for refrigerated logistics activity and related services, which can reflect broader logistics spend and captive operations, not just outsourced cold chain logistics revenue. |
| Press Release B | USD 2.43 B (2023) | Built on an older base year and a narrower captured scope that can undercount value-added services and contracted warehousing revenue, and it may also apply different inclusions by city coverage. |
The spread in the table is mainly explained by scope and what is treated as addressable outsourced service revenue versus wider spending or a narrower captured basket. When the boundary is held steady and checked against utilization, fleet, and pricing signals, the resulting market value becomes easier to trace and repeat for planning and budgeting.


Key Questions Answered in the Report
How large is the Brazil cold chain logistics market in 2026?
Brazil cold chain logistics market size equals USD 5.64 billion in 2026 and is forecast to grow at a 4.15% CAGR to 2031.
Which segment grows fastest through 2031?
Value-Added Services posts the highest 4.16% CAGR as shippers outsource packaging, labeling, and quality audits.
What drives investment in ultra-low-temperature storage?
Domestic vaccine production, led by Instituto Butantan’s dengue program, requires -60 °C to -80 °C capacity and end-to-end traceability.
Why is the Southeast region dominant?
It combines port infrastructure at Santos, dense urban consumption, and the largest pharmaceutical manufacturing base, concentrating demand for temperature-controlled services.
Which restraint pressures margins most?
Volatile electricity pricing raises operating costs for cold warehouses and necessitates expensive backup power systems.
Page last updated on:


 Your data is secure and never sold or shared.


