Brazil Agricultural Biologicals Market Size and Share
Market Overview
| Study Period | 2017 - 2030 |
|---|---|
| Base Year For Estimation | 2024 |
| Forecast Data Period | 2025 - 2030 |
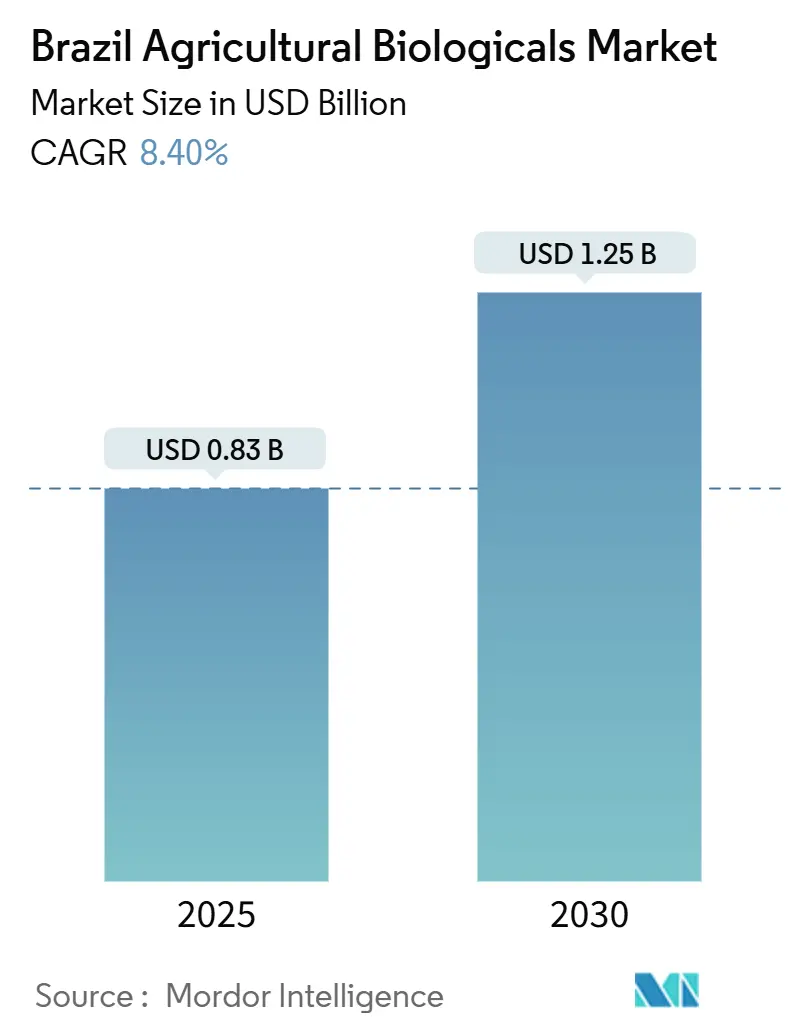
| Market Size (2025) | USD 0.83 Billion |
| Market Size (2030) | USD 1.25 Billion |
| Growth Rate (2025 - 2030) | 8.40% CAGR |
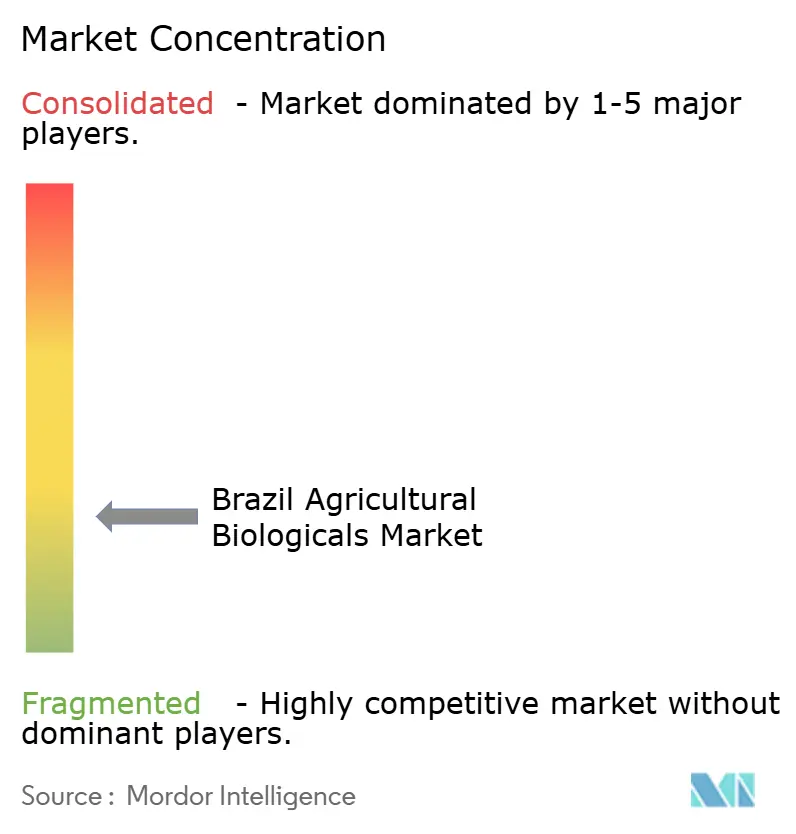
| Market Concentration | Low |
Major Players
*Disclaimer: Major Players sorted in no particular order Image © Mordor Intelligence. Reuse requires attribution under CC BY 4.0. |
|
Brazil Agricultural Biologicals Market Analysis by Mordor Intelligence
The Brazil agriculture biologicals market size was USD 833.08 million in 2025 and is projected to reach USD 1,249.4 million by 2030, registering an 8.4% CAGR across the forecast window. This growth is driven by a combination of government carbon-credit incentives, streamlined registration processes by the Ministry of Agriculture, Livestock, and Food Supply (MAPA), and advancements in native strain discoveries through Empresa Brasileira de Pesquisa Agropecuária (EMBRAPA) microbiome programs. Brazil's status as a global agricultural leader underpins this expansion, with the adoption of biologicals enhancing export competitiveness in response to stricter European Maximum Residue Level (MRL) standards.
The regulatory framework experienced a significant shift in 2024 with MAPA's fast-track registration decree, which reduced approval timelines for biopesticides by 50%. This change provides a structural advantage for biologicals over traditional chemical inputs. Additionally, the National Bioinputs Program has committed BRL 2.8 billion (USD 560 million) through 2027 to support the commercialization of native strains and enhance on-farm production capabilities. Brazil's rich biodiversity provides a competitive edge in developing location-specific biological solutions that outperform imported alternatives in tropical conditions.
Infrastructure limitations present both challenges and opportunities for market growth. Cold-chain constraints outside the Cerrado region hinder distribution, while high-temperature logistics corridors reduce product viability beyond 45 days, as noted by the Brazilian Logistics Association. However, innovative on-farm bio-factory franchising models are addressing these issues by bypassing traditional distribution channels. These models reduce costs by over 20% and improve product freshness, aligning with Brazil's cooperative agricultural structure and offering a scalable solution to logistical challenges.
Key Report Takeaways
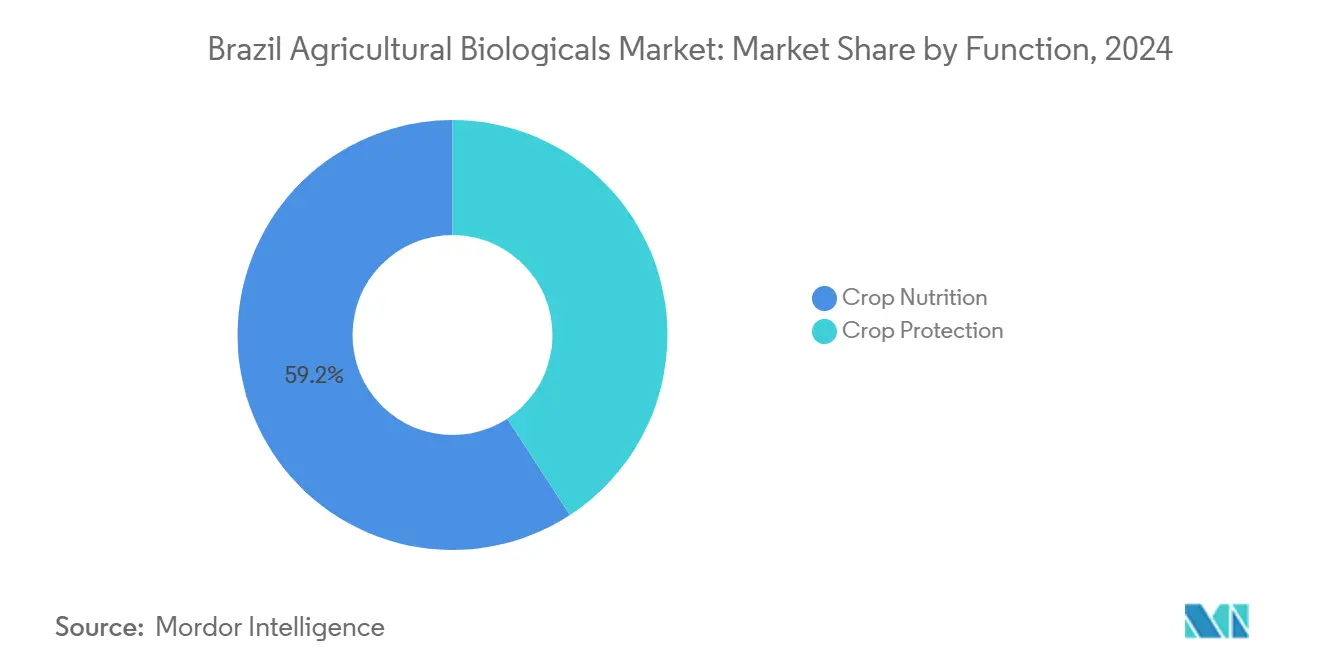
- By function, crop nutrition led with 59.2% revenue share, and advanced at an 8.8% CAGR through 2030.
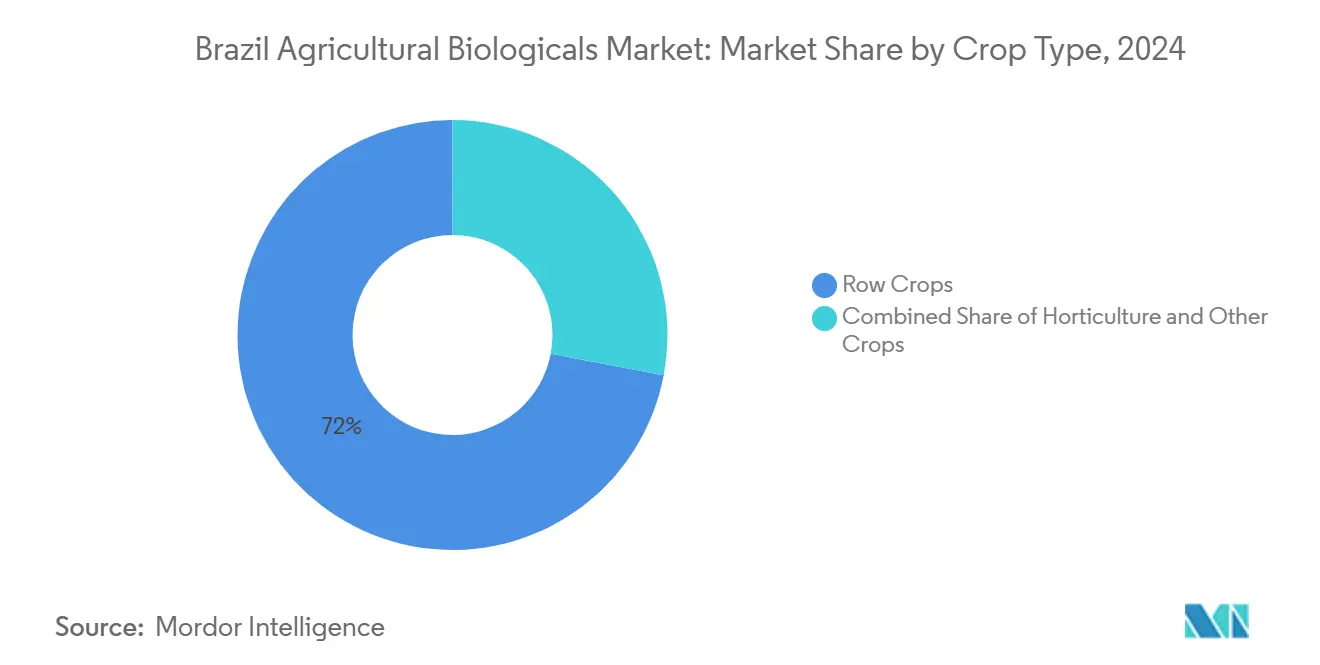
- By crop type, row crops accounted for 72% of the Brazilian agricultural biologicals market share in 2024; however, they are projected to advance at an 8.6% CAGR through 2030.
Brazil Agricultural Biologicals Market Trends and Insights
Drivers Impact Analysis
| Driver | (~) % Impact on CAGR Forecast | Geographic Relevance | Impact Timeline |
|---|---|---|---|
| Government incentives for low-carbon agriculture | +1.2% | National, strongest in Cerrado, Rio Grande do Sul, Paraná | Medium term (2–4 years) |
| Rapid adoption of carbon-credit-linked biologicals by soy growers | +1.5% | National, strongest in Mato Grosso, Goiás, Mato Grosso do Sul | Short term (≤ 2 years) |
| Stricter MRL thresholds at European ports driving export-oriented demand | +1.8% | Export-oriented states | Long term (≥ 4 years) |
| Accelerated registration timelines for biorational products (MAPA Fast-Track) | +1.1% | National | Short term (≤ 2 years) |
| Brazil’s micro-biome discovery programs unlocking native strains | +0.9% | São Paulo, Brasília R\&D hubs | Medium term (2–4 years) |
| On-farm bio-factory franchising models reducing unit costs | +0.8% | Cooperative-dense states | Medium term (2–4 years) |
| Source: Mordor Intelligence | |||
Government incentives for low-carbon agriculture
Brazil’s Plano ABC+ reimburses up to 50% of verified biological spending, backed by BRL 5.05 billion (USD 1.01 billion) for the 2024-2025 cycle. The scheme also grants preferential credit to farms that document soil-carbon gains, locking growers into multiyear programs that stabilize demand. Carbon accounting protocols embed biological data into extension services, ensuring that environmental metrics secure policy support. The financial upside reduces payback periods, turning biologicals into a strategic input. As cost barriers fall, the Brazil agriculture biological market gains a state-supported path to scale.
Rapid adoption of carbon-credit-linked biologicals by soy growers
Soybean producers are integrating certified inoculants into routine seed-treatment programs because every documented application increases the farm’s carbon-credit balance by 0.5 to 0.8 tCO₂e per hectare [1]Source: Brazilian Ministry of Agriculture, “Plano ABC+ Investment Allocation 2024-2025,” gov.br . In 2024, fully 92% of the 847,000 tCO₂e registered under Brazil’s biological-agriculture credit scheme came from soy projects, underscoring how quickly this single crop is scaling the practice. Growers who adhered to the full protocol earned USD 8 to 12 per hectare in premium credits, in addition to a 3 to 5% yield increase, providing an income stream that covered roughly one-third of the inoculant bill. Grain merchandisers, such as Cargill and ADM, now embed biological-use clauses in forward contracts, guaranteeing price bonuses once third-party auditors confirm field logs and soil carbon tests. These verification steps raise capability barriers for non-compliant suppliers but give early-adopter cooperatives a clear marketing edge in residue-sensitive European and Asian channels. As a result, soy growers have become the single largest crop-specific driver of demand in the Brazil agriculture biologicals market, amplifying the impact of broader government incentives.
Stricter MRL thresholds at European ports driving export-oriented demand
The European Union rejected 1,247 Brazilian consignments in 2024, costing exporters USD 89 million[2]Source: Brazilian Development Bank, “Carbon Credit Market Registration Data 2024,” bndes.gov.br. The rules cut allowable residues for 23 actives by 60%, making residue-free biological programs the only viable path for EU shipments. Cooperatives expanded biological procurement by 40–60% for export lots, gaining both compliance assurance and sustainability branding. This trade-linked pull embeds biological products in contractual obligations, giving the Brazil agriculture biologicals market a firm export-centric foundation.
Accelerated registration timelines for biorational products (MAPA Fast-Track)
Decree 11.691/2024 created a specialized review track that trims biological product approval times to 18 months, half the length developers previously faced. MAPA formed dedicated evaluator teams and accepted streamlined data packages for native microorganisms, giving innovative firms a clearer and faster route to market. In its first year, the system cleared 127 biological registrations, nearly triple the number processed under the old framework. The ministry pledged to keep the 18-month ceiling in place through 2027, giving companies the regulatory certainty they need to scale R and D pipelines and attract investment. Shorter waits reduce cash-flow strain on start-ups and help larger suppliers refresh portfolios more quickly, intensifying product competition across Brazil’s grain belts. By favoring homegrown strains that already fit local ecosystems, the fast-track mechanism also strengthens domestic intellectual-property positions and reduces dependence on imported technologies.
Restraints Impact Analysis
| Restraint | (~) % Impact on CAGR Forecast | Geographic Relevance | Impact Timeline |
|---|---|---|---|
| Fragmented distribution outside the “Cerrado” macro-region | −0.7% | Northeast, North | Medium term (2–4 years) |
| Limited shelf-life in high-temperature logistics corridors | −0.5% | National, acute in Northeast routes | Short term (≤ 2 years) |
| Shortage of skilled agronomists for biological product stewardship | −0.6% | Interior regions | Long term (≥ 4 years) |
| High registration fees for macrobial agents vs. chemical benchmarks | −0.4% | National | Short term (≤ 2 years) |
| Source: Mordor Intelligence | |||
Fragmented distribution outside the “Cerrado” macro-region
Biological inputs reach growers quickly in the Cerrado because distributors there operate refrigerated depots, employ trained technical teams, and schedule frequent farm deliveries. Those same services remain scarce in the Northeast and North, where many outlets store products in ambient warehouses that regularly exceed 35 °C. The absence of cool rooms shortens shelf life, forcing companies to move smaller lots at higher frequency, which raises freight and spoilage costs by up to 18%. Distributors facing these conditions often limit stock to fast-moving brands and avoid newer formulations that require stricter handling, slowing portfolio refresh in frontier states. Cold-chain upgrades are underway, but the capital intensity of refrigerated hubs and the need for skilled agronomic support make expansion gradual. Until these gaps close, biological adoption will remain uneven, with 78% of national sales still concentrated in the Cerrado even though it holds only 52% of planted land.
Limited shelf-life in high-temperature logistics corridors
Live microbial products can lose one quarter of their efficacy after three days above 35 °C, yet average trailer temperatures on Brazil’s main summer grain routes often reach 45 °C. Most carriers run non-refrigerated fleets, so suppliers must either lease chilled trucks at a 40–60% cost premium or rush deliveries inside narrow temperature windows. Growers in the Northeast report discarding up to 12% of incoming biological shipments because labels show expired viability thresholds on arrival. To soften the risk, companies are launching heat-stable formulations that tolerate brief spikes to 50 °C, but these alternatives remain in pilot scale and command higher prices. Others are partnering with cooperatives to install on-farm micro-factories that bypass long hauls altogether. Until either solution becomes widespread, shelf-life degradation will continue to cap market growth in the hottest corridors.
Segment Analysis
By Function: Crop nutrition retains a lead
Crop nutrition captured 59.2% of the Brazil agriculture biologicals market share in 2024 as growers replaced a rising slice of synthetic fertilizers with native nitrogen-fixing and phosphate-solubilizing inoculants. The segment is projected to expand at an 8.8% CAGR between 2025 and 2030, the highest growth rate among functional categories. Adoption is driven by EMBRAPA-validated strains that boost soybean nodulation, government reimbursement that refunds up to half of qualified invoices, and carbon-credit rewards that add direct revenue per treated hectare[3]Source: European Food Safety Authority, “Import Rejection Statistics Brazil 2024,” efsa.europa.eu. These factors keep crop nutrition firmly positioned as the largest and fastest-growing engine of the Brazilian agriculture biologicals market.
Crop protection, the next-largest functional tier, is gaining traction as microbial consortia begin to replace single-mode chemical sprays in integrated pest-management programs. Growers value residue-free control of soybean caterpillars and cotton bollworms, while MAPA’s fast-track pathway cuts the wait for new biorational labels to 18 months. Recent field trials have shown that stacked biocontrols can reduce the need for one foliar pass per season, saving machine hours during peak periods. As performance stability improves, this second-most-significant function is poised to capture additional acreage, especially in export-focused grain belts that must meet strict European residue limits.
Note: Segment shares of all individual segments available upon report purchase
By Crop Type: Row crops account for major share through scale economics.
Row crops commanded 72% of the Brazil agriculture biologicals market share in 2024 and are forecast to grow at an 8.6% CAGR through 2030, the quickest pace among crop categories. Cooperative bulk buying lowers delivered prices, carbon-credit bonuses boost net returns, and dual-tank planters simplify inoculant placement, making biological inputs a core line item for soy and corn producers. Exporters prefer grain backed by residue-free certification, so row-crop growers rely on certified microbes as insurance against costly European rejections. These economic and compliance benefits keep row crops at the center of demand for the Brazil agriculture biologicals market size.
Cash crops, such as cotton and sugarcane, now attract targeted biological programs that focus on drought tolerance and pest resistance, as chemicals face increasing resistance. Cotton farmers in Mato Grosso are testing microbial blends that reduce whitefly populations, and sugarcane mills in São Paulo utilize biostimulant fertigation to prolong ratoon longevity. Successful field results and on-farm bio-factory access are moving cash crops into the spotlight as the next growth tier, diversifying revenue beyond the dominant grain belt while meeting buyers’ expanding sustainability audits.
Geography Analysis
The Cerrado macro-region generated was the dominant region in the market. Owing to its advanced logistics, dense cooperative structures, and a strong exporter culture. Mato Grosso alone held a significant share, while Goiás and Mato Grosso do Sul combined for another prominent demand. Native-strain inoculants are well-suited for the tropical climate, and transport corridors already feature adequate cold storage, making biologicals a default input.
Southern states Rio Grande do Sul and Paraná maintain a solid uptake, integrating biologicals with no-till practices that restore soil structure and unlock carbon credit income. Adoption is reinforced by university extension teams and well-established cooperative networks that provide stewardship training.
The Northeast is the fastest-moving frontier as irrigated fruit and vegetable hubs expand around Bahia and Pernambuco. Logistics bottlenecks remain, yet heat-stable formulations and micro-bio plants are reducing the risk. Northern states Pará and Rondônia hold emerging potential, dependent on capital flows for storage and skilled agronomists. These patterns show that infrastructure maturity and technical capacity dictate regional momentum within the Brazil agricultural biologicals market.
Competitive Landscape
Brazil’s agriculture biologicals market is highly fragmented, with the five largest suppliers holding around a 10% share in 2024. Vittia Fertilizantes e Biológicos leads with a significant share, a position earned through decades of regional focus and an in-country distribution grid that reaches most major grain belts. Such dispersion keeps pricing fluid and allows regional specialists to thrive without direct head-to-head rivalry against multinational giants. The structure invites consolidation yet simultaneously lowers the barriers for startups that bring targeted microbial solutions to specific crops or climates.
Firms differentiate themselves through product depth, native-strain expertise, and field-level technical service, rather than manufacturing scale. Vittia expanded its Cerrado footprint in June 2024 by opening a USD 12 million liquid fermentation hub in Goiás, a move that cut delivery time to local cooperatives by five days. Microquimica Tradecorp Brazil partnered with a large Paraná cooperative in September 2024 to roll out on-farm micro-factories that reduce cold-chain dependence and trim unit costs by 22%. Bioceres Crop Solutions secured MAPA approval in November 2024 for a heat-tolerant inoculant line designed for Northeast transport corridors. These targeted investments emphasize agility and local fit as the primary levers for winning share in an environment where no single brand yet dominates.
Technology adoption is the next competitive frontier. Companies are investing resources in fermentation optimization to stabilize live cultures, sensor-enabled application equipment that adjusts doses on the fly, and cloud dashboards that track carbon outcomes for credit programs. MAPA’s fast-track registration process shortens the path from lab to field, favoring nimble players that can pilot, iterate, and launch within an 18-month window. Distribution reach and agronomic support still decide who converts trials into repeat business, so alliances with cooperatives and specialized dealers remain pivotal. Given today’s fragmentation, Brazil’s agricultural biotechnology market is poised for a wave of mergers, partnerships, and technology-driven shakeouts over the next five years.
Brazil Agricultural Biologicals Industry Leaders
-
Vittia Fertilizantes e Biológicos S.A.
-
Microquimica Tradecorp Brazil S.A. (Rovensa Group)
-
Bioceres Crop Solutions Corp.
-
FMC Corporation
-
Novonesis A/S
- *Disclaimer: Major Players sorted in no particular order
Recent Industry Developments
- October 2025: Syngenta introduced VICTRATO, a new seed treatment that shields soybeans, corn, cotton, and other major crops from nematodes and early leaf diseases. Built on TYMIRIUM technology, the formula works smoothly alongside biological inputs, leaving beneficial soil microbes intact. Trials run in Goiás and Mato Grosso showed clear yield bumps, underscoring Syngenta’s push to pair chemistry and biology for Brazil’s tropical farms.
- September 2025: Vittia unveiled Tricho-Turbo OD, a biological fungicide built around its proprietary Trichoderma asperellum BVF24 strain. The oil-dispersion formulation protects spores during handling and maintains their viability in the field. Farmers can use the product as a seed treatment, place it in the furrow at planting, or spray it on leaves, making it easy to fold into existing programs. Besides controlling gray stem rot, Tricho-Turbo OD promotes stronger roots and overall plant vigor, reinforcing Vittia’s reputation for eco-friendly crop protection options in Latin America.
- August 2025: BASF signed a licensing deal with Corteva Agriscience and M.S. Technologies to bundle its novel nematode-resistant soybean trait with the Enlist E3 and Conkesta E3 herbicide- and insect-resistant stacks, creating the first biotech package that tackles nematodes, weeds, and caterpillar pests in a single seed. Seven years of Brazilian field trials showed the trait delivers more than 90% control of root-lesion and cyst nematodes, a breakthrough for growers battling yield losses in the Cerrado. Commercial varieties are scheduled for launch in Brazil near the decade’s end, pending final regulatory clearances.
Brazil Agricultural Biologicals Market Report Scope
Crop Nutrition, Crop Protection are covered as segments by Function. Cash Crops, Horticultural Crops, Row Crops are covered as segments by Crop Type.| Crop Nutrition | Biofertilizer | Azospirillum |
| Azotobacter | ||
| Mycorrhiza | ||
| Phosphate Solubilizing Bacteria | ||
| Rhizobium | ||
| Other Biofertilizers | ||
| Biostimulants | Amino Acids | |
| Fulvic Acid | ||
| Humic Acid | ||
| Protein Hydrolysates | ||
| Seaweed Extracts | ||
| Other Biostimulants | ||
| Organic Fertilizer | Manure | |
| Meal Based Fertilizers | ||
| Oilcakes | ||
| Other Organic Fertilizers | ||
| Crop Protection | Biocontrol Agents | Macrobials |
| Microbials | ||
| Biopesticides | Biofungicides | |
| Bioherbicides | ||
| Bioinsecticides | ||
| Other Biopesticides | ||
| Cash Crops |
| Horticultural Crops |
| Row Crops |
| Function | Crop Nutrition | Biofertilizer | Azospirillum |
| Azotobacter | |||
| Mycorrhiza | |||
| Phosphate Solubilizing Bacteria | |||
| Rhizobium | |||
| Other Biofertilizers | |||
| Biostimulants | Amino Acids | ||
| Fulvic Acid | |||
| Humic Acid | |||
| Protein Hydrolysates | |||
| Seaweed Extracts | |||
| Other Biostimulants | |||
| Organic Fertilizer | Manure | ||
| Meal Based Fertilizers | |||
| Oilcakes | |||
| Other Organic Fertilizers | |||
| Crop Protection | Biocontrol Agents | Macrobials | |
| Microbials | |||
| Biopesticides | Biofungicides | ||
| Bioherbicides | |||
| Bioinsecticides | |||
| Other Biopesticides | |||
| Crop Type | Cash Crops | ||
| Horticultural Crops | |||
| Row Crops | |||
Market Definition
- AVERAGE DOSAGE RATE - The average application rate is the average volume of agricultural biologicals applied per hectare of farmland in the respective region/country.
- CROP TYPE - Crop type includes Row crops (Cereals, Pulses, Oilseeds), Horticultural Crops (Fruits and vegetables) and Cash Crops (Plantation Crops, Fibre Crops and Other Industrial Crops)
- FUNCTION - Agricultural biological products provide crops with essential nutrients, prevent or control abiotic & biotic stresses, and enhance soil quality.
- TYPE - The Crop Nutrition function of agricultural biologicals includes organic fertilizer and Biofertilizer, whereas the Crop Protection function includes Biostimulants, Biopesticides and Biocontrol Agents.
| Keyword | Definition |
|---|---|
| Cash Crops | Cash crops are non-consumable crops sold as a whole or part of the crop to manufacture end-products to make a profit. |
| Integrated Pest Management (IPM) | IPM is an environment-friendly and sustainable approach to control pests in various crops. It involves a combination of methods, including biological controls, cultural practices, and selective use of pesticides. |
| Bacterial biocontrol agents | Bacteria used to control pests and diseases in crops. They work by producing toxins harmful to the target pests or competing with them for nutrients and space in the growing environment. Some examples of commonly used bacterial biocontrol agents include Bacillus thuringiensis (Bt), Pseudomonas fluorescens, and Streptomyces spp. |
| Plant Protection Product (PPP) | A plant protection product is a formulation applied to crops to protect from pests, such as weeds, diseases, or insects. They contain one or more active substances with other co-formulants such as solvents, carriers, inert material, wetting agents or adjuvants formulated to give optimum product efficacy. |
| Pathogen | A pathogen is an organism causing disease to its host, with the severity of the disease symptoms. |
| Parasitoids | Parasitoids are insects that lay their eggs on or within the host insect, with their larvae feeding on the host insect. In agriculture, parasitoids can be used as a form of biological pest control, as they help to control pest damage to crops and decrease the need for chemical pesticides. |
| Entomopathogenic Nematodes (EPN) | Entomopathogenic nematodes are parasitic roundworms that infect and kill pests by releasing bacteria from their gut. Entomopathogenic nematodes are a form of biocontrol agents used in agriculture. |
| Vesicular-arbuscular mycorrhiza (VAM) | VAM fungi are mycorrhizal species of fungus. They live in the roots of different higher-order plants. They develop a symbiotic relationship with the plants in the roots of these plants. |
| Fungal biocontrol agents | Fungal biocontrol agents are the beneficial fungi that control plant pests and diseases. They are an alternative to chemical pesticides. They infect and kill the pests or compete with pathogenic fungi for nutrients and space. |
| Biofertilizers | Biofertilizers contain beneficial microorganisms that enhance soil fertility and promote plant growth. |
| Biopesticides | Biopesticides are natural/bio-based compounds used to manage agricultural pests using specific biological effects. |
| Predators | Predators in agriculture are the organisms that feed on pests and help control pest damage to the crops. Some common predator species used in agriculture include ladybugs, lacewings, and predatory mites. |
| Biocontrol agents | Biocontrol agents are living organisms used to control pests and diseases in agriculture. They are alternatives to chemical pesticides and are known for their lesser impact on the environment and human health. |
| Organic Fertilizers | Organic fertilizer is composed of animal or vegetable matter used alone or in combination with one or more non-synthetically derived elements or compounds used for soil fertility and plant growth. |
| Protein hydrolysates (PHs) | Protein hydrolysate-based biostimulants contain free amino acids, oligopeptides, and polypeptides produced by enzymatic or chemical hydrolysis of proteins, primarily from vegetal or animal sources. |
| Biostimulants/Plant Growth Regulators (PGR) | Biostimulants/Plant Growth Regulators (PGR) are substances derived from natural resources to enhance plant growth and health by stimulating plant processes (metabolism). |
| Soil Amendments | Soil Amendments are substances applied to soil that improve soil health, such as soil fertility and soil structure. |
| Seaweed Extract | Seaweed extracts are rich in micro and macronutrients, proteins, polysaccharides, polyphenols, phytohormones, and osmolytes. These substances boost seed germination and crop establishment, total plant growth and productivity. |
| Compounds related to biocontrol and/or promoting growth (CRBPG) | Compounds related to biocontrol or promoting growth (CRBPG) are the ability of a bacteria to produce compounds for phytopathogen biocontrol and plant growth promotion. |
| Symbiotic Nitrogen-Fixing Bacteria | Symbiotic nitrogen-fixing bacteria such as Rhizobium obtain food and shelter from the host, and in return, they help by providing fixed nitrogen to the plants. |
| Nitrogen Fixation | Nitrogen fixation is a chemical process in soil which converts molecular nitrogen into ammonia or related nitrogenous compounds. |
| ARS (Agricultural Research Service) | ARS is the U.S. Department of Agriculture's chief scientific in-house research agency. It aims to find solutions to agricultural problems faced by the farmers in the country. |
| Phytosanitary Regulations | Phytosanitary regulations imposed by the respective government bodies check or prohibit the importation and marketing of certain insects, plant species, or products of these plants to prevent the introduction or spread of new plant pests or pathogens. |
| Ectomycorrhizae (ECM) | Ectomycorrhiza (ECM) is a symbiotic interaction of fungi with the feeder roots of higher plants in which both the plant and the fungi benefit through the association for survival. |
Research Methodology
Mordor Intelligence follows a four-step methodology in all our reports.
- Step-1: Identify Key Variables: In order to build a robust forecasting methodology, the variables and factors identified in Step-1 are tested against available historical market numbers. Through an iterative process, the variables required for market forecast are set and the model is built on the basis of these variables.
- Step-2: Build a Market Model: Market-size estimations for the forecast years are in nominal terms. Inflation is not a part of the pricing, and the average selling price (ASP) is kept constant throughout the forecast period.
- Step-3: Validate and Finalize: In this important step, all market numbers, variables and analyst calls are validated through an extensive network of primary research experts from the market studied. The respondents are selected across levels and functions to generate a holistic picture of the market studied.
- Step-4: Research Outputs: Syndicated Reports, Custom Consulting Assignments, Databases & Subscription Platforms.


