
Market Overview
| Study Period | 2020 - 2031 |
|---|---|
| Forecast Data Period | 2026 - 2031 |
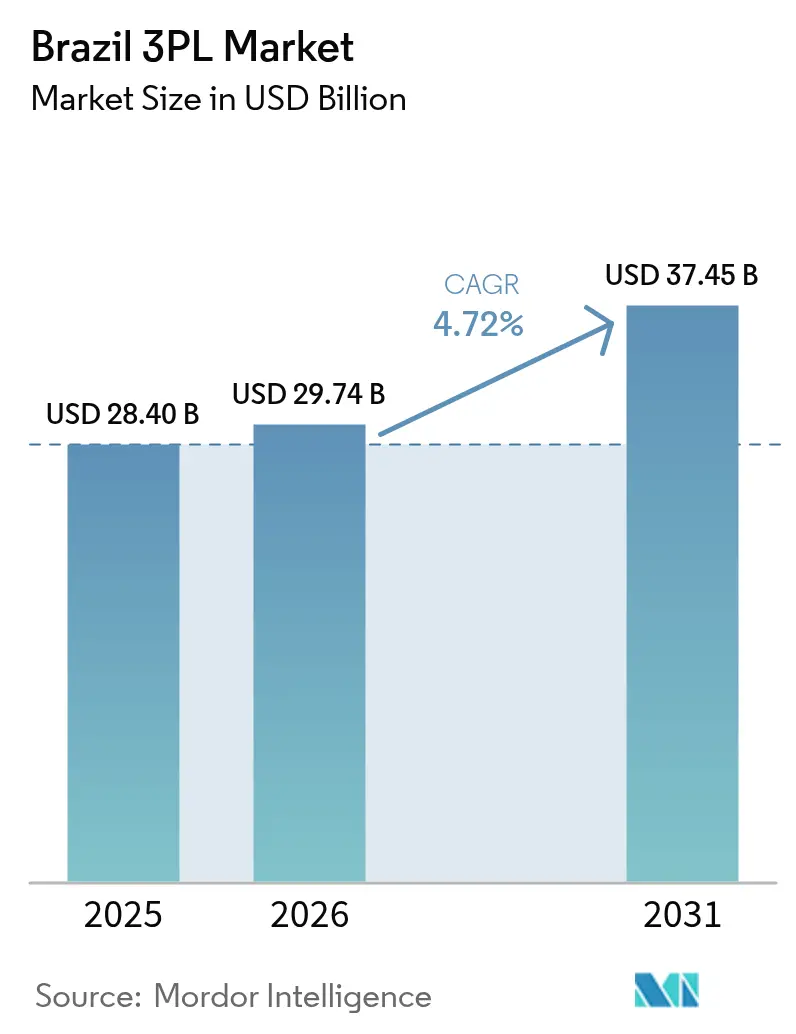
| Base Year Market Size (2025) | USD 28.40 Billion |
| Market Size (2026) | USD 29.74 Billion |
| Market Size (2031) | USD 37.45 Billion |
| Growth Rate (2026 - 2031) | 4.72 % |
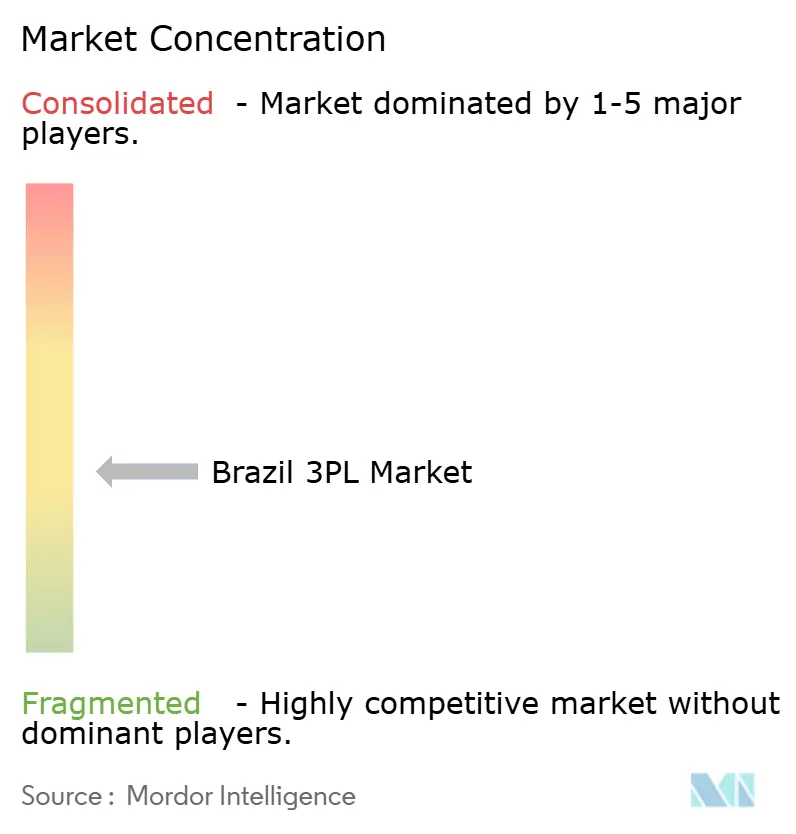
| Market Concentration | Medium |
Major Players *Disclaimer: Major Players sorted in no particular order Image © Mordor Intelligence. Reuse requires attribution under CC BY 4.0. | |
Brazil 3PL Market Analysis by Mordor Intelligence
The Brazil 3PL market size is expected to grow from USD 28.40 billion in 2025 to USD 29.74 billion in 2026 and is forecast to reach USD 37.45 billion by 2031 at 4.72% CAGR over 2026-2031. Expansion is unfolding even as logistics expenses absorb 12.3% of national GDP—far above developed-market norms—because shippers are turning to multimodal corridors, asset-light orchestration, and warehouse automation to trim waste and improve visibility. Private-equity inflows into Grade-A logistics parks, completion of the North–South Railroad, and fast-growing cold-chain demand are reshaping competitive dynamics. E-commerce volumes from tier-2 cities, ESG-driven procurement mandates, and hybrid logistics models that combine owned and partner fleets are widening the service scope of leading providers. Taken together, these forces are repositioning the Brazil 3PL market as a platform for nationwide fulfillment rather than a patchwork of regional distribution hubs.
Key Report Takeaways
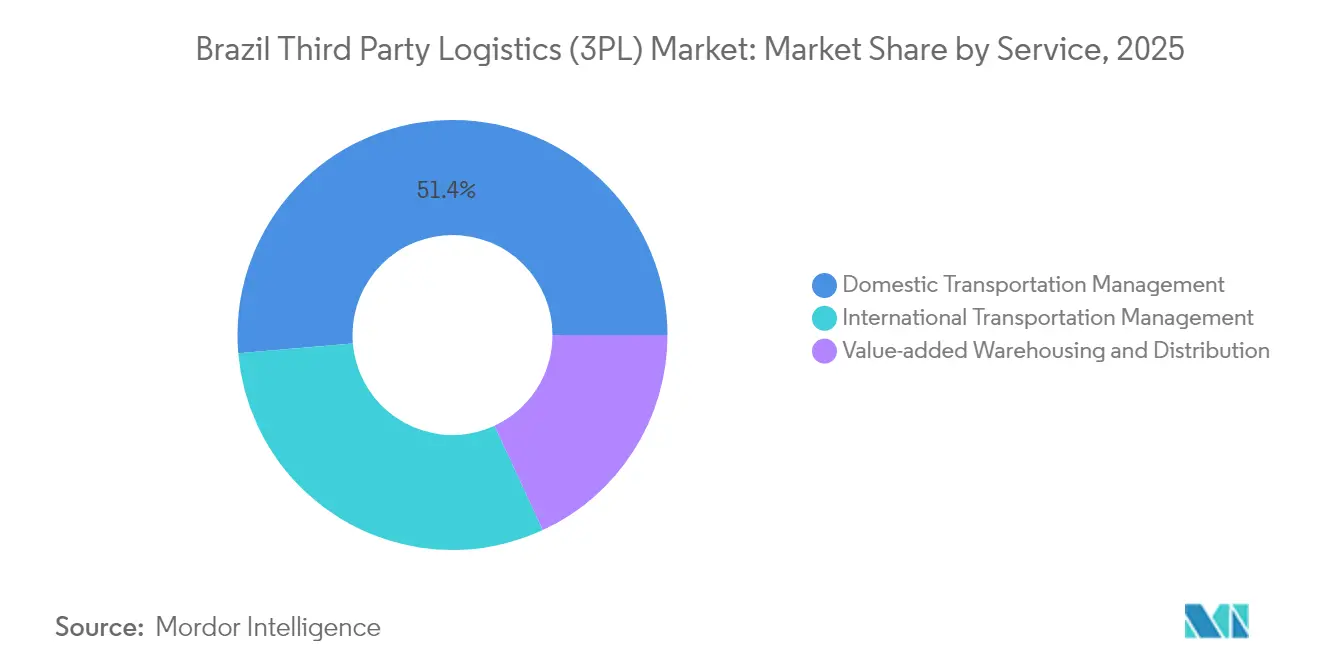
- By service, Domestic Transportation Management led with 51.35% share of the Brazil 3PL market size in 2025, while Value-added Warehousing & Distribution is forecast to expand at a 7.18% CAGR to 2031.
- By geography, the Southeast captured 46.55% of the Brazil 3PL market share in 2025; the North region is projected to grow at a 5.74% CAGR through 2031.
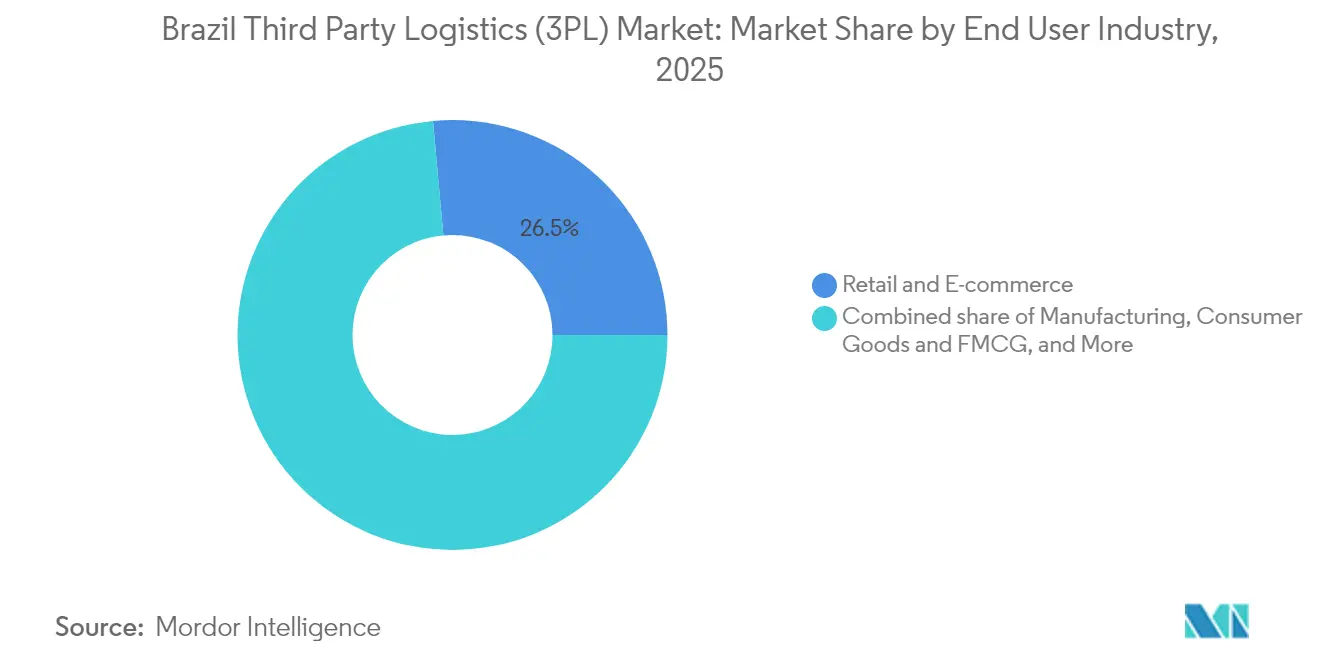
- By end-user industry, Retail & E-commerce commanded 26.45% share of the Brazil 3PL market size in 2025; Life Sciences & Healthcare is advancing at a 8.75% CAGR between 2026-2031.
- By logistics model, Asset-Light operations held 47.30% of the Brazil 3PL market share in 2025, while Hybrid models are on course for the fastest 6.42% CAGR to 2031.
Note: Market size and forecast figures in this report are generated using Mordor Intelligence’s proprietary estimation framework, updated with the latest available data and insights as of 2026.
Brazil 3PL Market Trends and Insights
Drivers Impact Analysis*
| Driver | (~) % Impact on CAGR Forecast | Geographic Relevance | Impact Timeline |
|---|---|---|---|
| Explosive e-commerce demand in tier-2 cities | +1.8% | National; concentration in Southeast & South | Short term (≤ 2 years) |
| Biologics & vaccine cold-chain uptick | +1.2% | Southeast, South, Northeast | Medium term (3-4 years) |
| Agribusiness grain-export boom | +1.5% | Center-West, North, Northeast | Medium term (3-4 years) |
| Mandatory ESG reporting | +0.9% | Southeast, South | Long term (≥ 5 years) |
| Private-equity-led Grade-A warehouse build-out | +1.6% | Southeast, South | Short term (≤ 2 years) |
| Digital Tax Voucher (DT-e) mandate accelerating 3PL tech adoption | +0.8% | National | Medium term (3-4 years) |
| Source: Mordor Intelligence | |||


Explosive E-commerce Demand in Tier-2 Cities
Tier-2 urban areas posted the fastest online sales growth worldwide in 2024, pushing fulfillment volumes into regions where modern logistics stock is scarce. Mercado Libre is doubling its Brazilian distribution-center count to 21 by 2025, investing BRL 23 billion to place facilities in Rio Grande do Sul, Brasília, and Pernambuco. These nodes are cutting last-mile costs by up to 50% and lifting same-day delivery reach by 40%, forcing competitors to reassess network footprints[1]Mercado Libre, “Sustainability Report 2024,” mercadolibre.com. New multimodal routes that pair truckload line-haul with regional air uplift are gaining favor because they sidestep congested highways around São Paulo. For the Brazil 3PL market, the surge means tighter warehouse vacancy—forecast to hit 6.8% in 2025, the lowest on record—and rising demand for order-management technology that orchestrates omnichannel flows across scattered inventory pools. Providers able to balance throughput speed with cost discipline are capturing long-term contracts from both domestic and cross-border merchants.
Biologics & Vaccine Cold-Chain Uptick
Life-sciences volumes are growing at 9.2% CAGR as injectable GLP-1 therapies and combination vaccines move deeper into Brazil’s public-health programs. Novo Nordisk is investing BRL 6.4 billion to upgrade its Montes Claros plant, adding capacity that will require validated 2-8 °C transport lanes for nationwide distribution[2]Novo Nordisk, “Novo Nordisk Invests BRL 6.4 Billion in Montes Claros Expansion,” Novo Nordisk, novonordisk.com. Specialty 3PLs are installing IoT-based lane monitoring that meets Anvisa’s Good Distribution Practices, lowering reported product-loss rates tied to temperature excursions that cost the sector BRL 15 billion each year. Start-ups such as Pharmalog integrate real-time thermal dashboards with blockchain audit trails, giving shippers line-item traceability. For the Brazil 3PL market, the cold-chain build-out is expanding the profit pool beyond foodstuffs and inviting consolidation, as regional warehouses retrofit for dual-zone storage to meet higher-margin pharmaceutical requirements.
Agribusiness Grain-Export Boom
Soybean exports climbed to 25.4 million t in Q3 2024 at an average FOB price of USD 434.91 t, anchoring a freight surge from farm belts in Mato Grosso and MATOPIBA. The completed North–South Railroad now links inland grain silos to Northern Arc ports, lowering end-to-end cost by 30% and reducing transit by four days[3]ANEC, “Northern Arc Logistics Corridor Report 2024,” ANEC, anec.com.br. Multimodal 3PLs are leasing block trains and coordinating barges on the Tapajós River to secure capacity during peak harvest, replacing fragmented spot trucking. Clients are locking in multi-year rail allocation, signaling durable volume shifts that elevate the share of non-road ton-miles in the Brazil 3PL market.
Mandatory ESG Reporting
Federal procurement policy (Plano Diretor de Logística Sustentável) now embeds emissions criteria in public-sector tenders, and lenders such as Bradesco have tied BRL 250 billion in credit lines to verified low-carbon supply chains. Corporates respond by outsourcing to 3PLs that operate electric fleets or rail-first routings. Eletrobras already audits 100% of critical carriers on ESG metrics. Mercado Libre increased its Brazilian electric-vehicle fleet by 30% in 2024, trimming urban CO₂ output and enhancing brand equity among eco-conscious shoppers. Integrating Scope 3 analytics platforms has therefore become a qualification hurdle, accelerating digital adoption across the Brazil 3PL market.
Restraints Impact Analysis*
| Restraint | (~) % Impact on CAGR Forecast | Geographic Relevance | Impact Timeline |
|---|---|---|---|
| Chronic truck-driver shortage | −1.2% | National | Medium term (3-4 years) |
| High logistics-cost share for SMEs | −0.8% | North, Northeast, Center-West | Medium term (3-4 years) |
| Cargo-theft hotspots elevating insurance costs | −0.5% | Southeast (São Paulo & Rio de Janeiro) | Short term (≤ 2 years) |
| Port of Santos congestion and 8-day average dwell time | −0.9% | Southeast; nationwide supply-chain implications | Short term (≤ 2 years) |
| Source: Mordor Intelligence | |||
Chronic Truck-Driver Shortage
Road haulage moves significant share of Brazilian freight but the licensed driver pool is aging, and women hold just 3.4% of heavy-vehicle licenses. Wage inflation has climbed faster than diesel costs, pressing margins for both carrier-owned fleets and 3PL subcontractors. Programs such as IVECO’s “Caminhos para Elas” placed 60% of female trainees into trucking roles in its first year, yet structural gaps persist. Autonomous-vehicle trials in São Paulo hint at long-run relief, but regulatory and infrastructure adoption will take the decade. In the interim, the shortage nudges shippers toward rail and short-sea alternatives, limiting road-based capacity available to the Brazil 3PL market during seasonal peaks.
High Logistics-Cost Share for SMEs
For small manufacturers, logistics expenses can exceed 25% of product value because fragmented carrier networks, multilayer taxes, and limited bargaining power inflate door-to-door rates. Research shows that repositioning inventories to tax-advantaged states trims landed cost, yet SMEs often lack data to optimize hubs. 3PLs offering shared warehousing and multi-shipper milk-runs are capturing this underserved tier. Without scale-efficient solutions, SME competitiveness erodes, tempering e-commerce expansion and capping growth potential for the broader Brazil 3PL market.
*Our forecasts treat driver/restraint impacts as directional, not additive. The impact forecasts reflect baseline growth, mix effects, and variable interactions.
Segment Analysis
By Service: Value-Added Warehousing Rewrites Fulfillment Economics
Domestic Transportation Management captured 51.35% of 2025 revenue, anchored in a road network that still carries 58% of national tonnage. That dominance ensures stable baseline volumes for the Brazil 3PL market, but mounting driver shortages and corridor congestion are encouraging modal diversification. Value-added Warehousing & Distribution (VAWD) is advancing at a 7.18% CAGR, propelled by omnichannel retailers requesting inventory postponement, pick-and-pack, and reverse-logistics services within the same node. Mercado Libre targets 2 million m² of warehousing by 2025, illustrating the upmarket shift toward automated fulfillment centers with mezzanine robotics and micro-sortation. Providers that marry real-time stock visibility with distributed inventory placement are securing premium margins. The Brazil 3PL market size for VAWD sub-services is projected to increase in double digits as e-commerce and healthcare shippers outsource non-core activities.
In parallel, International Transportation Management gains leverage from new corridors like the North-South Railroad, enabling bundled rail-truck-port solutions that slash grain export costs. Airfreight retains a niche for high-value pharmaceuticals and electronics, with 3PLs integrating temperature-controlled ULDs and API-driven booking engines. As service complexity rises, shippers gravitate toward partners that provide unified dashboards across transport and warehousing, further consolidating the Brazil 3PL market.


By End-User Industry: Healthcare Challenges Retail Primacy
Retail & E-commerce accounted for 26.45% of Brazil's 3PL market revenue in 2025 on the back of 16% online sales expansion. Last-mile innovation, including drone-ready micro hubs and community-based drop-off points in favelas, enables parcel density that sustains the same-day service levels outside tier-1 metros. Yet Life Sciences & Healthcare, growing at 8.75% CAGR, is narrowing the gap thanks to vaccine and biologics volumes that command premium rates. Cold-chain upgrades, lane qualification, and GDP compliance generate new revenue lines, lifting the Brazil 3PL market size for temperature-controlled services. Automotive, Energy, and FMCG remain sizable contributors, but healthcare’s capital intensity and regulatory oversight raise switching barriers, locking in multi-year contracts. Providers that layer serialization, returns compliance, and customs brokerage under one SLA are best positioned to outpace baseline sector growth.
By Logistics Model: Hybrid Platforms Gain Momentum
Asset-Light operations delivered 47.30% of Brazil's 3PL market revenue in 2025, valued for scalability and minimal capex. However, the fastest 6.42% CAGR belongs to Hybrid models that selectively own cross-docks, trucks, or railcars while contracting less strategic legs. This structure provides resilience against subcontractor bottlenecks and supports ESG reporting with verified emissions data. The Brazil 3PL market share for Hybrid operations is climbing as large shippers seek guaranteed capacity during peak harvest or shopping seasons. Asset-heavy models persist in hazardous-materials transport and bulk liquids, where dedicated fleets mitigate compliance risk. Across models, the common thread is orchestration technology: control-tower platforms that integrate TMS, WMS, and IoT telemetry into a single decision stack, giving shippers end-to-end visibility.
Geography Analysis
The Southeast remains the fulcrum of the Brazil 3PL market, holding 46.55% of 2025 revenue on the strength of São Paulo’s industrial clusters and Santos’ deep-sea connectivity. Yet, chronic port congestion and under-funded highways cost exporters revenue, illustrated by 637,767 bags of coffee that missed March 2025 shipment windows, forfeiting USD 1.568 million of potential earnings. Infrastructure shortfalls make modal agility, rail, cabotage, cross-docking, an imperative for 3PLs operating in the region.
The North region represents the smallest base but posts the swiftest 5.74% CAGR to 2031 as grain corridors pivot to Northern Arc ports. These terminals handled 52.3 million tons of soy and corn in 2024, 47.4% of national corn exports. Still, only 41% of paved roads are in good condition, and river draft restrictions tied to climate change threaten dry-season capacity. 3PLs hedge by combining rail legs on Estrada de Ferro Carajás with barge fleets outfitted with shallow-draft pontoons, preserving schedule reliability during low-water months.
Center-West territories, led by Mato Grosso, are the locus of Brazil’s soybean expansion, adding 5.4 million hectares of planted area since 2017. The National Logistics Plan (PNL2035) aims to grow rail coverage by 91%, promising 10-23% freight savings once dedicated grain aisles reach interiors. 3PLs pre-leasing track slots and building integrated transload yards are staking early claims on volumes expected to surge as 70 million acres of degraded pasture convert to cropland.
The Northeast secures multilateral funding to counterbalance under-developed infrastructure. A USD 150 million World Bank loan to Bahia rides alongside a USD 200 million sustainable-infrastructure program targeting road and energy upgrades. MATOPIBA’s soybean area grew from 4.1 million to 5.8 million ha in seven years, intensifying demand for rail-road-port chains that bypass clogged coastal highways. 3PLs with local warehousing footprints and customs-brokerage capabilities can accelerate cycle times to export markets.
Regulatory Landscape
Brazilian 3PL compliance is tightening through system-enforced road-freight controls and broader digitalization of trade and infrastructure governance. In March 2026, ANTT published Resolutions No. 6.077/2026 and No. 6.078/2026, reinforcing mandatory, pre-operation use of the Transport Operation Identifier Code (CIOT) to curb non-compliant freight and strengthen enforcement of the minimum freight floor. ANTT followed with Portaria SUROC No. 6/2026 in April 2026, setting technical validation rules that entered into force on May 24, 2026. These measures push 3PLs and their carrier networks toward tighter integration of contracting, billing, and transport-document workflows to reduce origin-based blockage and penalties.
On the maritime and trade side, Decree No. 12.555 (July 2025) regulated the BR do Mar cabotage program, supporting competition and lowering coastal shipping costs as shippers and 3PLs redesign routes away from congested highways and ports. For cross-border movements, the Portal Unico de Comercio Exterior reached full adhesion of anuente agencies (including MAPA and ANVISA) by October 2025, and by early 2026 processed more than half of Brazilian imports with an average reduction of 19 hours in port dwell time. This raises the service bar for international transportation management and customs-facing control towers. In May 2026, the Ministry of Ports and Airports (MPor) also created a 90-day Working Group to harmonize concession rules for ports, airports, and waterways, providing regulatory predictability that affects how 3PLs contract capacity and plan multimodal corridors.
Value Chain Analysis
The Brazil 3PL value chain begins with shippers in retail and e-commerce, agribusiness, and life sciences that tender line-haul, warehousing, and value-added services to integrators and forwarders. Those providers then orchestrate a delivery network of road carriers, rail operators, port and terminal operators, bonded and non-bonded warehouses, cold-chain specialists, and technology vendors (TMS/WMS, telematics, and compliance platforms). The domestic backbone remains trucking, but multimodal design is increasingly central for export corridors and for time- and temperature-sensitive distribution. In this setup, 3PLs combine road first-mile with rail and cabotage, supported by control-tower functions to allocate capacity and manage exceptions.
Performance and margins along the chain are shaped by cost and congestion at key nodes. Brazil carried logistics costs equivalent to 15.5% of GDP in 2025 (R$ 1.96 trillion), while port and corridor constraints continue to create volatility, including documented delays that affected coffee exports in March 2025 (637,767 bags delayed, with estimated lost revenue). Export logistics through the Northern Arc shows the bottleneck profile, where unpaved segments and harvest-season queues around interfaces such as BR-163/BR-230 and Miritituba terminals extend lead times and drive higher inventory buffers for shippers using 3PLs. Public planning frameworks are also feeding more directly into private value-chain decisions, with Decree 12.022/2024 establishing Integrated Transport Planning (PIT) and the PNL 2050 cycle (2024-2027) shifting projects toward demand-driven, concession-ready pipelines. This influences where 3PLs site cross-docks, transload yards, and contract rail and waterway capacity.
Competitive Landscape
Competition in the Brazil 3PL market is intensifying as global forwarders buy local specialists while domestic players modernize warehouse portfolios. The September 2024 agreement by CMA CGM to acquire 48% of Santos Brasil for USD 1.13 billion marks a pivot toward vertical integration of terminal assets with inland logistics. Scan Global Logistics followed by taking over Blu Logistics Brasil, adding BRL 570 million in 2023 revenue and a robust ocean freight book. Consolidators pursue scale to negotiate ocean contracts, secure port berths, and feed rail networks, squeezing smaller operators that lack capital for tech upgrades or green fleets.
Niche entrants are carving out defensible positions. Favela Brasil Xpress delivers 4,000 parcels daily to informal neighborhoods, pairing crowdsourced delivery personnel with AI routing to cut failed-delivery rates. Estoca operates omnichannel nodes powered by proprietary WMS, promising 20% logistics cost cuts for mid-market merchants. Cold-chain heavyweights such as Emergent Cold Latin America command a combined 157 million ft³ of capacity, enabling national coverage for pharmaceutical and frozen-food clients. Technology adoption is the great equalizer: digitized supply chains raise profit margins by 40% and slash logistics expenses by 50% for early movers.
Strategic investments focus on clean-energy fleets and network density. Vibra Energia operates 10,000 drivers and 8,000 contracted trucks, rolling out electric tankers to lower Scope 1 emissions. Ultracargo’s 50% stake in ethanol-terminal operator Opla extends bulk-liquid storage into multimodal distribution. Within this mosaic, leading 3PLs converge on platform models that blend asset ownership with brokerage scale, reinforcing the hybrid trend mapped earlier.
Brazil 3PL Industry Leaders
DHL Supply Chain (Deutsche Post AG)
A.P. Moller - Maersk Logistics & Services
BBM Logística SA
JSL SA
CEVA Logistics AG
- *Disclaimer: Major Players sorted in no particular order

Market Opportunities and Future Outlook
Opportunities in Brazil 3PL are concentrated where regulation and infrastructure programs standardize processes and create room for multimodal service design. The Portal Unico de Comercio Exterior, with full anuente-agency adhesion by October 2025 and processing of over 50% of imports by early 2026, improves the operating environment for international transportation management and customs-adjacent value-added services, particularly for 3PLs that integrate data flows across MAPA/ANVISA-touching shipments. Road-freight compliance changes anchored by ANTT Resolutions No. 6.077/2026 and No. 6.078/2026, plus Portaria SUROC No. 6/2026 (effective May 24, 2026), also create whitespace for providers that embed CIOT and transport-document validation into contracted-carrier networks. This reduces disruption risk for shippers and supports scaled asset-light and hybrid models.
Physical-network and automation investment is another avenue for differentiation as 3PLs add throughput and support faster omnichannel fulfillment beyond tier-1 metros. Mercado Libre expanded its Brazilian distribution footprint (targeting 21 DCs by 2025) and invested BRL 23 billion in facilities across multiple regions. Separately, in May 2026 Jadlog opened a 20,000 m2 hub in Sao Paulo with sorting capacity of up to 18,000 packages per hour, illustrating how capacity and sortation productivity are being used to compete for e-commerce volumes. At the same time, rail and port-linked projects support bundled rail-truck-port solutions for agribusiness and industrial flows, aligning with the Integrated Transport Planning (PIT) direction set under Decree 12.022/2024 and the concession-focused infrastructure pipeline. Together, these moves favor 3PL offerings that combine control towers, multimodal contracting, and specialized warehousing (including temperature-controlled areas for healthcare and nutrition) within a single SLA across Brazil’s regions.
Recent Industry Developments
- July 2026: DHL Supply Chain expanded its logistics partnership with Reckitt in Brazil, adding a new 6,000 square-pallet climate-controlled area in Embu das Artes (SP) and integrating healthcare and nutrition flows. The move increases validated storage and handling capacity for regulated, temperature-sensitive SKUs, strengthening DHLs position in higher-margin segments that demand traceability and service-level rigor.
- April 2026: Maersk announced the opening of a 70,000 square metre multipurpose depot in Rio Grande and a 3,160 square metre expansion of its container freight station in Paranagua. The initiative links inland depot capacity with deep-sea services and Alianca cabotage, expanding end-to-end container availability and multimodal options for shippers using integrated 3PL solutions.
- September 2024: CMA CGM agreed to acquire 48% of Santos Brasil for USD 1.13 billion, marking a major step toward vertical integration in Brazils port and logistics ecosystem. The transaction raises competitive pressure on 3PLs and forwarders by tying terminal access and operational priorities more tightly to a global ocean carrier with inland logistics ambitions.


Research Methodology Framework and Report Scope
Market Definition and Coverage
For this report, the Brazil 3PL market covers revenues earned by third-party providers for managing and executing logistics for shippers in Brazil, including domestic and cross-border freight movement, warehousing, and value-added handling when the provider controls the flow of freight or inventory.
Scope exclusions: We exclude captive in-house logistics operations run by shippers for their own cargo, and pure last-mile parcel couriers that do not provide warehousing-led 3PL solutions.
Segmentation Overview
- By Service
- Domestic Transportation Management
- Road
- Air
- Rail
- Inland Waterways
- International Transportation Management
- Road
- Air
- Sea
- Multimodal / Intermodal
- Value-Added Warehousing and Distribution (VAWD)
- Domestic Transportation Management
- By End-User Industry
- Automotive
- Energy and Utilities
- Manufacturing
- Life Sciences and Healthcare
- Technology and Electronics
- Retail and E-commerce
- Consumer Goods and FMCG
- Food and Beverages
- Others
- By Logistics Model
- Asset-Light (Management-Based)
- Asset-Heavy (Own Fleet and Warehouses)
- Hybrid
- By Region (Domestic)
- Southeast
- South
- Northeast
- Center-West
- North
Data Sources, Market Sizing, and Validation
Desk Research
Desk research was used to build the factual base for Brazil logistics demand and the operating environment before the model was finalized. We relied on public sources such as IBGE for macro and activity indicators, the Central Bank of Brazil for inflation and FX context, and ANTT plus ANTAQ for transport and freight market signals (road and ports).
To keep the market definition consistent, we also reviewed customs and trade statistics (for example, MDIC/Comex Stat) to understand import and export flows that drive international forwarding and inland distribution needs. Company filings, investor presentations, and reputable press coverage were checked to map service offerings and the typical revenue mix for 3PL providers active in Brazil. Where it helped, a paid subscription for company financials and a shipment-level import/export database were used to cross-check scale, exposure to trade lanes, and the timing of demand shifts. This list is illustrative, and many other public sources were also reviewed for data collection, validation, and clarification.
Primary Interviews and Surveys
Primary work focused on confirming what portion of logistics spend is outsourced to 3PLs in Brazil, and how service revenues split across transportation management, warehousing, and value-added activities. Interviews and surveys were run across 3PL operators, freight intermediaries, large shipper logistics teams, and industry specialists, which helped us validate assumptions for pricing, utilization, and the pace of outsourcing by sector and by key corridors within Brazil.
Distribution of primary research fieldwork respondents
| Company type | Respondent position |
|---|---|
| Top tier: 38% | CXOs: 12% |
| Mid tier: 40% | Functional/Unit leaders: 32% |
| Smaller Players: 22% | Managers: 56% |
Market-Sizing & Forecasting
The core sizing starts with a top-down build that uses Brazil freight activity and trade flow signals to reconstruct the addressable outsourced logistics demand pool, then it is filtered into the 3PL revenue layer through outsourcing rates and service-mix logic. To keep the totals realistic, we corroborated results with selective bottom-up checks, such as sampled provider revenue ranges, channel checks on contracted warehousing space, and sanity tests on implied average selling price (ASP) per shipment or per pallet movement.
Key inputs used in the model include road freight intensity and regulatory markers tied to trucking activity, containerized trade volumes and port throughput as a proxy for international 3PL demand, warehousing absorption and occupancy direction as a capacity signal, inflation and fuel-linked cost pass-through expectations, and FX timing for converting local revenues into USD consistently. When a bottom-up data point was missing for smaller operators, gaps were handled using conservative scaling based on observable capacity and service footprint, then rechecked through interview feedback.
For the forecast, scenario analysis was used, anchored on expected GDP and trade direction, outsourcing momentum in retail and industrial supply chains, and the speed of improvements in logistics infrastructure and service digitization. Assumptions were adjusted only after they were supported by repeated primary feedback and aligned with the desk indicators.
Data Validation & Update Cycle
Validation is done through multiple checks so the final number is not dependent on a single series. Outputs are compared against independent signals like trade throughput, trucking activity direction, and warehouse utilization indicators, then large variances are traced back to either scope mismatches or overstated ASP and volume assumptions.
Before sign-off, the model goes through a multi-step analyst review where anomalies are flagged, logic is replayed, and outlier inputs are challenged with fresh calculations. If a key variable moves sharply, for example an unexpected FX swing or a trade disruption, respondents are re-contacted to confirm how pricing and volumes are behaving on the ground. Reports are refreshed annually, and interim updates are made when material events occur, followed by a final pre-delivery pass so clients receive the most current view.
Mordor Intelligence's Brazil 3pl Market Sizing Compared With Other Published Estimates
Published market sizes for Brazil 3PL often do not match because firms choose different boundaries for what counts as 3PL revenue, and they also pick different base years and currency timing. Differences in how warehousing, forwarding, and managed transportation are treated can shift the total even when the country scope is the same.
Port throughput trends, customs trade values, and road freight activity checks are the evidence points that keep Mordor Intelligence aligned to an outsourced logistics demand pool, instead of counting broader in-house logistics spend that never reaches 3PL providers.
Benchmark comparison
| Source | Market Size | Gaps in Research Methodology |
|---|---|---|
| Mordor Intelligence | USD 28.40 B (2025) | |
| Global Consultancy A | USD 32.62 B (2024) | Uses an earlier base year and does not clearly state exclusions, so captive shipper logistics and adjacent courier-led revenue can be mixed into the 3PL total, and FX conversion timing can also widen the USD value. |
| Industry Publisher B | USD 31.40 B (2025) | Covers similar service labels, but the growth path implies a faster ASP and outsourcing ramp, which can happen when aggressive scenarios are reported without enough capacity and utilization cross-checks in warehousing and line-haul. |
Looking across the table, most of the spread is explained by scope edges and how fast pricing and outsourcing are assumed to progress year to year. Our approach keeps the estimate traceable to trade and freight activity, and then it is cross-verified with provider-side reality checks so the final value stays practical for planning and budgeting.


Key Questions Answered in the Report
What is the current size of the Brazil 3PL market?
The Brazil 3PL market size stands at USD 29.74 billion in 2026 and is projected to reach USD 37.45 billion by 2031.
Which service segment is growing fastest?
Value-added Warehousing & Distribution leads with a 7.18% CAGR forecast for 2026-2031 as omnichannel retailers outsource complex fulfillment tasks.
Why is the North region expanding faster than other areas?
Completion of the North-South Railroad and rising grain exports through Northern Arc ports are driving a 5.74% CAGR in the North’s 3PL revenue.
How are ESG regulations influencing logistics outsourcing?
Mandatory ESG disclosures push companies to hire 3PLs with electric fleets, rail-first solutions, and emissions-tracking platforms, opening new contract opportunities.
Page last updated on:


 Your data is secure and never sold or shared.


