
Market Overview
| Study Period | 2020 - 2031 |
|---|---|
| Market Size (2026) | USD 1.04 Billion |
| Market Size (2031) | USD 1.45 Billion |
| Growth Rate (2026 - 2031) | 6.98 % |
| Fastest Growing Market | Asia Pacific |
| Largest Market | North America |
| Market Concentration | Medium |
Major Players *Disclaimer: Major Players sorted in no particular order Image © Mordor Intelligence. Reuse requires attribution under CC BY 4.0. | |
Brachytherapy Devices Market Analysis by Mordor Intelligence
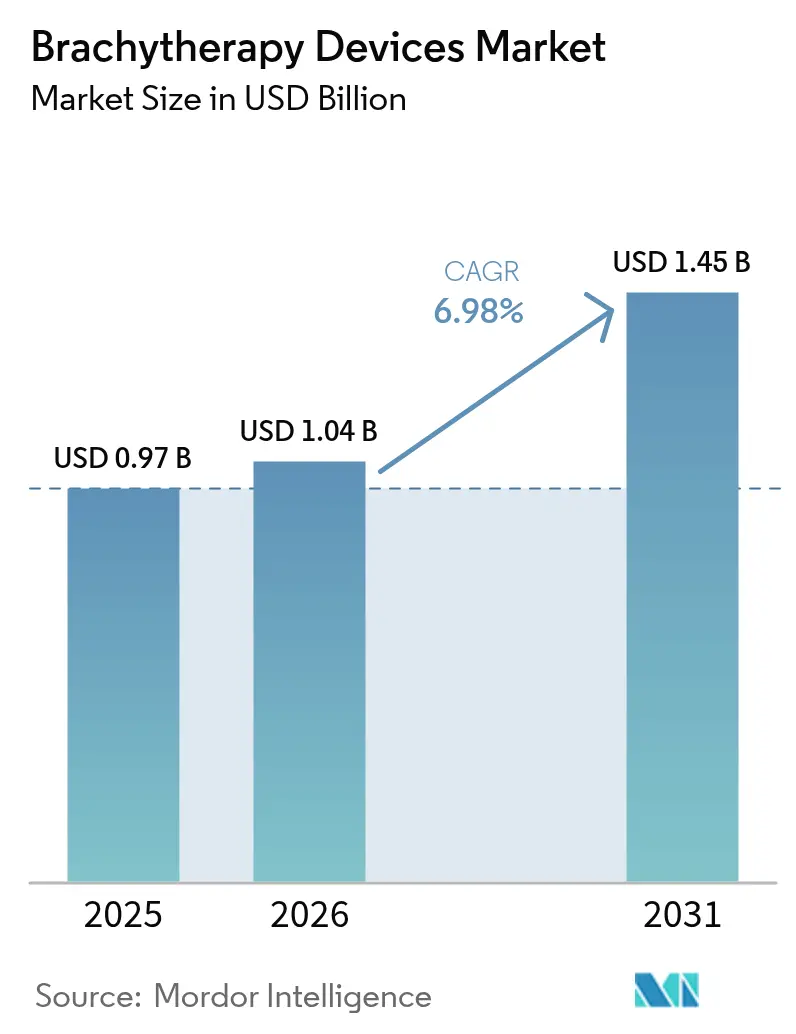
The Global brachytherapy devices market size was valued at USD 0.97 billion in 2025 and estimated to grow from USD 1.04 billion in 2026 to reach USD 1.45 billion by 2031, at a CAGR of 6.98% during the forecast period (2026-2031). Intensifying cancer incidence, favorable reimbursement for outpatient high-dose-rate (HDR) procedures, and rapid adoption of electronic systems anchor the demand outlook. Government and payer programs that accelerate radiotherapy access, especially in Asia-Pacific and Latin America, further support uptake. Parallel advances in artificial intelligence (AI) for treatment planning and electronic after-loading technologies shorten procedure times, expand deployment to community settings, and safeguard the isotope supply chain. Emerging nano-scale radionuclide carriers could unlock organ-sparing salvage options, broadening the therapeutic window and lengthening device replacement cycles for the Global brachytherapy devices market.
Key Report Takeaways
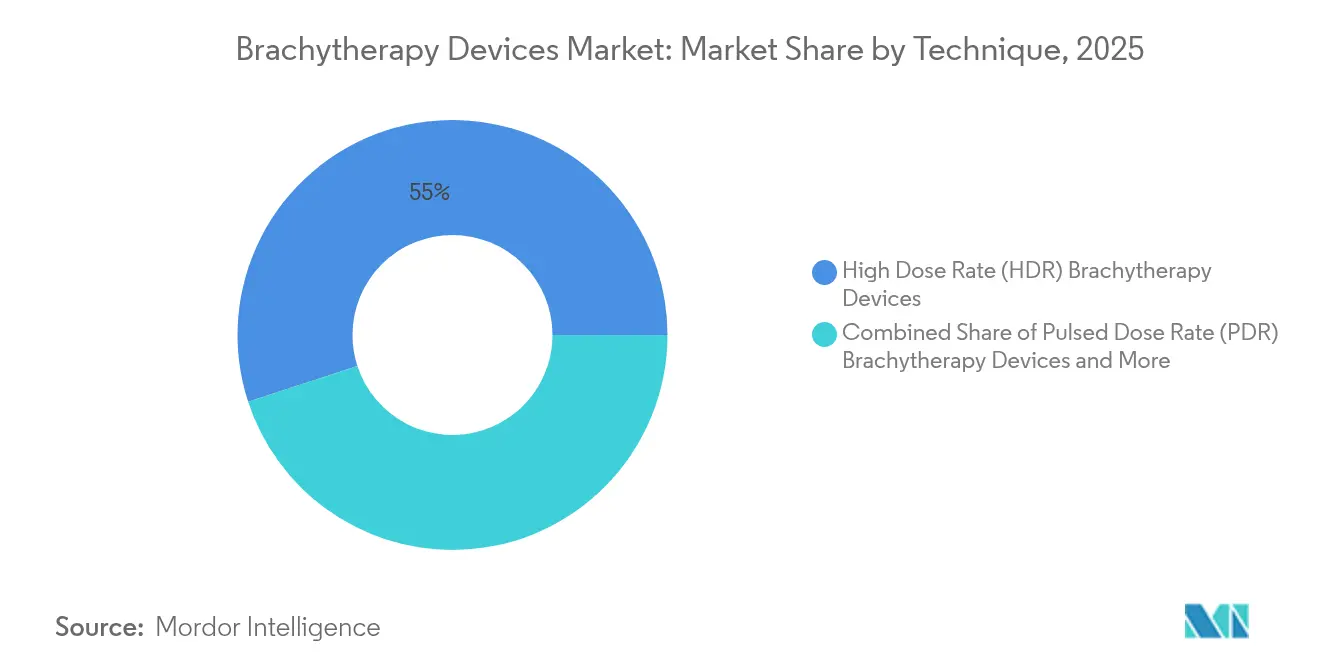
- By technique, HDR held 55.02% of the Global brachytherapy devices market share in 2025, while pulsed-dose-rate (PDR) is forecast to expand at 8.88% CAGR through 2031.
- By product type, seeds accounted for 43.05% share of the Global brachytherapy devices market size in 2025; electronic brachytherapy systems are poised for 14.39% CAGR to 2031.
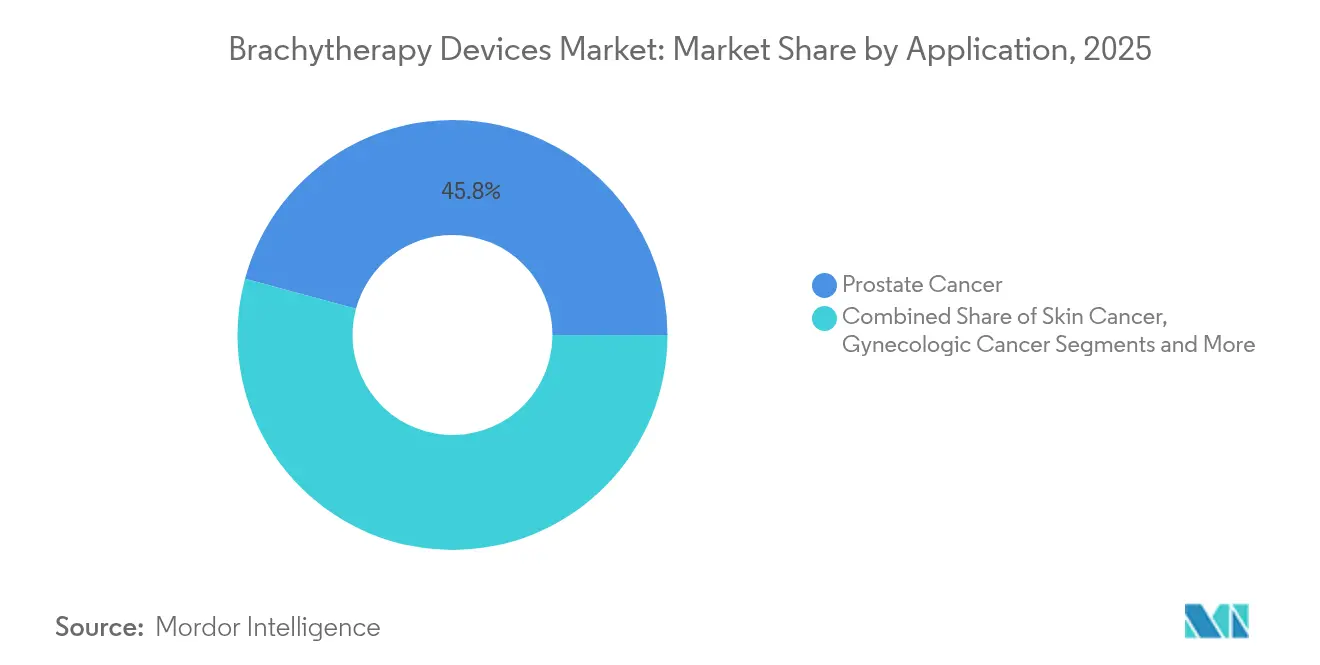
- By application, prostate cancer led with 45.78% revenue share in 2025; skin cancer treatments are projected to grow at a 10.32% CAGR to 2031.
- By end user, hospitals captured 59.35% share of the Global brachytherapy devices market size in 2025, whereas ambulatory surgical centers are set for a 9.24% CAGR over the outlook period.
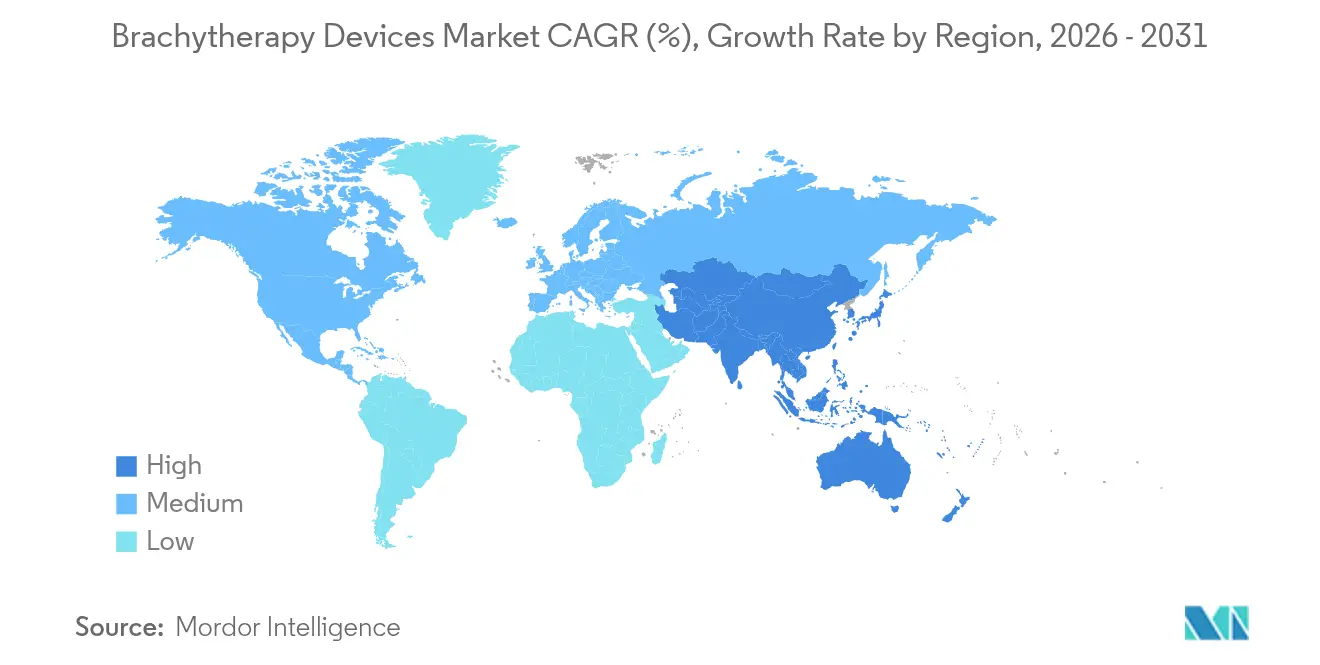
- By geography, North America dominated with 44.90% share in 2025, while Asia-Pacific is projected to log the fastest 9.08% CAGR to 2031.
Note: Market size and forecast figures in this report are generated using Mordor Intelligence’s proprietary estimation framework, updated with the latest available data and insights as of 2026.
Market Trends and Insights
Drivers Impact Analysis of Brachytherapy Devices Market*
| Driver | (~) % Impact on CAGR Forecast | Geographic Relevance | Impact Timeline |
|---|---|---|---|
| Growing Burden Of Cancer Incidence | +1.8% | Global, with highest impact in aging populations of North America, Europe, and Asia-Pacific | Long term (≥ 4 years) |
| Rising Government & Payer Initiatives To Expand Radiotherapy Access | +1.2% | Global, particularly emerging markets in Asia-Pacific and Latin America | Medium term (2-4 years) |
| Technological Shift Toward HDR & Electronic Brachytherapy Systems | +1.5% | North America & Europe leading, APAC adoption accelerating | Medium term (2-4 years) |
| Reimbursement Tail-Winds For Outpatient HDR Procedures | +0.9% | North America & Europe, with selective coverage in developed APAC markets | Short term (≤ 2 years) |
| AI-Driven Treatment-Planning Improving Workflow Efficiency | +0.8% | North America & Europe initially, global expansion expected | Medium term (2-4 years) |
| Nano-Scale Radionuclide Carriers Enabling Organ-Sparing Salvage Therapy | +0.6% | Research centers in North America & Europe, clinical translation pending | Long term (≥ 4 years) |
| Source: Mordor Intelligence | |||
Growing Burden of Cancer Incidence
Persistent growth in global cancer diagnoses underpins a structural need for precise, localized radiation. The American Cancer Society projects 2,041,910 new U.S. cases in 2025, with prostate, breast, and gynecologic cancers forming the core clinical settings for brachytherapy. As aging populations swell, oncologists value brachytherapy’s high conformality and organ preservation advantages. Clinical data in hepatocellular carcinoma cite 98.5% overall response rates using high-dose-rate protocols, signaling opportunity for disease-site expansion. Together, epidemiology and outcome evidence reinforce long-run demand in the Global brachytherapy devices market.
Rising Government & Payer Initiatives to Expand Radiotherapy Access
Policy makers view radiotherapy equity as public-health priority. India’s National Cancer Grid is closing a national shortfall of 53 brachytherapy units through indigenous HDR platforms, such as the ‘Karknidon’ remote after-loader, lowering acquisition costs. In the United States, Medicare’s Transitional Coverage for Emerging Technologies (TCET) pathway accelerates breakthrough device coverage decisions, potentially welcoming five brachytherapy candidates each year[1]. These moves broaden patient pools and de-risk innovation for the Global brachytherapy devices market.
Technological Shift Toward HDR & Electronic Brachytherapy Systems
Cancer centers increasingly migrate from permanent low-dose-rate implants to HDR and electronic modalities that support outpatient care, reduce shielding needs, and streamline workflows. The U.S. FDA regulates electronic brachytherapy as Class II with special controls, expediting approvals while safeguarding safety. With Elekta’s acquisition of Xoft, global portfolios now encompass eBx for facilities where isotope logistics are prohibitive. This pivot enhances throughput and underpins recurring hardware and software revenues in the Global brachytherapy devices market.
Reimbursement Tail-Winds for Outpatient HDR Procedures
Under the 2025 U.S. Hospital Outpatient Prospective Payment System, brachytherapy source C2645 reimburses at USD 4.69 per mm², sustaining favorable economics versus inpatient stays. Value-based-care emphasis on cost-effective protocols promotes HDR in ambulatory surgical centers, catalyzing double-digit growth pockets across the Global brachytherapy devices market.
Restraints Impact Analysis of Brachytherapy Devices Market*
| Restraint | (~) % Impact on CAGR Forecast | Geographic Relevance | Impact Timeline |
|---|---|---|---|
| Shortage Of Trained Brachy-Oncologists & Medical Physicists | -1.4% | Global, most acute in emerging markets and rural areas | Long term (≥ 4 years) |
| Uneven Isotope Supply Chain (Ir-192, I-125) & Export Controls | -0.9% | Global, with supply concentration in few countries creating vulnerability | Medium term (2-4 years) |
| Declining Utilization Amid Competition From SBRT & Robotic Surgery | -0.7% | North America & Europe primarily, emerging in developed APAC markets | Medium term (2-4 years) |
| Regulatory Uncertainty Around Electronic Brachytherapy Devices (Class III) | -0.5% | North America & Europe, affecting global product development strategies | Short term (≤ 2 years) |
| Source: Mordor Intelligence | |||
Shortage of Trained Brachy-Oncologists & Medical Physicists
Fifteen percent of U.S. medical physicists signal retirement intentions within 10 years, while cancer incidence climbs 2% annually, magnifying staffing gaps[2]. Residency directors cite limited caseloads as barriers to braid practical exposure, curtailing future competencies. Australian and New Zealand trainees echo concerns over shrinking seed-implant volumes, foreshadowing skills attrition. While simulation workshops raise proficiency, the talent pipeline remains a rate-limiter for the Global brachytherapy devices market.
Uneven Isotope Supply Chain & Export Controls
Most Ir-192 and I-125 sources originate from a handful of reactors subject to maintenance outages and export restrictions, exposing cancer centers to schedule disruptions and premium pricing. The United States imports roughly 90% of raw isotopes for nuclear medicine, underscoring geopolitical dependencies. Accelerator-based production offers diversification, yet commercial scale remains nascent. Supply insecurity restrains procurement decisions across the Global brachytherapy devices market.
*Our forecasts treat driver/restraint impacts as directional, not additive. The impact forecasts reflect baseline growth, mix effects, and variable interactions.
Brachytherapy Devices Market Segment Analysis
By Technique:
HDR Dominance Drives Workflow EvolutionHigh-dose-rate systems secured 55.02% share of the Global brachytherapy devices market in 2025, reflecting their capacity to condense treatment into few fractions and fit modern outpatient economics. Peer-reviewed data at ASTRO 2024 confirmed dose escalation benefits without overall-survival trade-offs across HDR and low-dose-rate (LDR) arms. The segment’s leadership remains anchored in prostate and gynecologic workflows, yet lung, liver, and head-and-neck indications show acceptance, sustaining hardware refresh cycles in the Global brachytherapy devices market.
Pulsed-dose-rate (PDR) technology is projected to record 8.88% CAGR through 2031, blending LDR radiobiology with HDR infrastructure to expand case mix flexibility. AI-enabled planning equalizes quality between modalities, flattening the learning curve for new adopters. LDR retains relevance in permanent seed implants where single-session convenience aligns with patient preference. Technique diversification ensures clinicians match dose kinetics to tumor biology, reinforcing clinical confidence and mitigating modality substitution risk.

By Product Type:
Electronic Systems Reshape Market DynamicsSeeds captured 43.05% share of the Global brachytherapy devices market in 2025, bolstered by decades of urology familiarity and streamlined inventory models. Yet electronic brachytherapy (eBx) systems—free of radioactive source handling—are on track for a 14.39% CAGR through 2031. The Global brachytherapy devices market size for eBx is projected to climb as unshielded-room operation invites smaller hospitals and ambulatory centers into the modality, especially for skin and breast protocols.
Applicators and after-loaders represent the mechanical backbone of HDR and PDR workflows, sustaining steady replacement demand as caseloads and dose-rate innovations evolve. Treatment-planning software, increasingly bundled in subscription models, embeds reinforcement learning scripts that cut plan iterations from hours to minutes, driving stickiness for integrated vendors and elevating switching costs across the Global brachytherapy devices market.
By Application:
Prostate Cancer Leadership Amid DiversificationProstate cancer procedures held 45.78% share in 2025, continuing to anchor volumes for seeds and HDR boosts. Favorable reimbursement, robust long-term biochemical control data, and rising active-surveillance transitions to focal salvage underpin its base. Skin cancer registers the swiftest 10.32% CAGR to 2031, leveraging eBx portability and a growing elderly demographic with non-melanoma lesions. The Global brachytherapy devices market size for skin applications remains comparatively small today but offers scaling runway as dermatology practices embrace office-based radiotherapy.
Gynecologic oncology strengthens through MRI-guided hybrid interstitial-intracavitary techniques, while accelerated partial-breast irradiation consolidates outpatient gains. Novel alpha-emitter intratumoral devices, such as Alpha DaRT, create footholds in challenging head-and-neck and glioblastoma recurrences. Application breadth reduces reliance on a single disease site, engineering resilience into the Global brachytherapy devices market.
By End User:
Ambulatory Centers Drive Access ExpansionHospitals commanded 59.35% of 2025 demand owing to full-service oncology infrastructure, in-house physics teams, and capital budgets. Yet ambulatory surgical centers (ASCs) will post a 9.24% CAGR through 2031, propelled by payer preference for lower-cost sites and HDR’s single-visit convenience. The Global brachytherapy devices market share held by ASCs is supported by Medicare’s standalone payment rates that offset equipment amortization.
Specialty oncology clinics and academic centers remain technology vanguards, piloting AI-guided workflows and nanoparticle trials that later cascade into community practice. As electronic systems sidestep vault requirements, new entrants can expand service lines with moderate capital, growing the distributed footprint of the Global brachytherapy devices market.
Geography Analysis
North America Brachytherapy Devices Market
North America retained 44.90% share in 2025 as mature reimbursement, early AI adoption, and a dense cancer-care network sustain procedure volumes. Federal programs such as TCET speed market access for breakthrough brachytherapy devices, while a looming 15% physicist retirement rate challenges workforce capacity. Partnerships like Varian-Ballad Health illustrate efforts to bridge rural access gaps via long-term equipment and service contracts. Vendor service revenues from these deals underpin regional resilience for the Global brachytherapy devices market.
Europe Brachytherapy Devices Market
Europe delivers steady growth through evidence-based adoption and cross-border research collaborations. Germany, France, and the United Kingdom pioneer MRI-guided adaptive brachytherapy, while CE-marked innovations such as AngioDynamics’ AlphaVac F18 85 gain rapid uptake, reinforcing regulatory predictability. EU-backed training exchanges with Asia bolster best-practice dissemination and support consistent utilization across the continent. The Global brachytherapy devices market benefits from Europe’s early-phase clinical trial density, informing global purchasing decisions.
APAC Brachytherapy Devices Market
Asia-Pacific will chart the highest 9.08% CAGR through 2031 as oncology infrastructure scales. India records nearly 1 million new cancer cases annually and addresses a 53-unit brachytherapy gap through indigenous HDR platforms. Japan hosts 129 Ir-192 remote after-loaders and reports 48% of centers employing 3D planning, underscoring advanced practice penetration. China’s provincial equipment procurement programs and central reimbursement reforms are expanding patient access, but physics staffing remains constrained. Regional collaboration via the Federation of Asian Organizations for Radiation Oncology aims to elevate treatment quality, sustaining momentum for the Global brachytherapy devices market.
Regulatory Landscape
Regulation for brachytherapy devices and sources is split across medical device, radiation-emitting product, and, in some cases, combination-product frameworks. In the United States, the FDA regulates photon-emitting brachytherapy sources through the 510(k) premarket notification pathway and classifies many products as Class II (for example, under 21 CFR 892.5730 for brachytherapy sources and 21 CFR 892.5700 for applicators). For drug-device combinations, the FDA Office of Combination Products can determine the primary mode of action and the lead center, so early pathway alignment is important for developers integrating radionuclides, carriers, or specialized delivery systems.
Internationally, compliance is anchored by consensus standards and region-specific device regulations. IEC 60601-2-17:2013 is a key safety and essential performance standard for automatically controlled brachytherapy afterloading equipment, and ISO 21439:2009 outlines clinical dosimetry methods for beta radiation sources used in brachytherapy. In Europe, Regulation (EU) 2017/745 (MDR) governs medical devices with a physical primary mode of action, while medicinal components can trigger additional assessment aligned to Directive 2001/83/EC. That overlap increases documentation, quality-system, and post-market obligations for manufacturers operating across regions.
Value Chain Analysis
The brachytherapy devices value chain starts with radionuclide and materials sourcing, then moves through sealed-source manufacture (for example, Ir-192 and I-125), applicator/afterloader and catheter fabrication using medical-grade polymers and radiopaque markers, software and treatment-planning integration, and finally distribution, installation, and long-term service. A structural constraint is the limited number of nuclear reactors and processing routes that supply Ir-192 and I-125, which can drive schedule disruptions for clinics and tighter procurement behavior for hospitals and oncology centers.
Downstream, OEMs and specialized producers (such as Elekta, Varian, and Eckert & Ziegler) depend on qualified suppliers for components, sterilization, and licensed logistics for radioactive materials. They then support customers through commissioning, physics QA, and maintenance. Changes to patient-contact disposables (catheters, needles, applicators) can trigger recertification requirements, raising switching costs and favoring established suppliers. Hospitals increasingly use direct, long-term procurement and managed-service contracting for afterloaders, software, and source replacement to stabilize total cost of ownership and maintain traceability across multi-year treatment programs.
Competitive Landscape
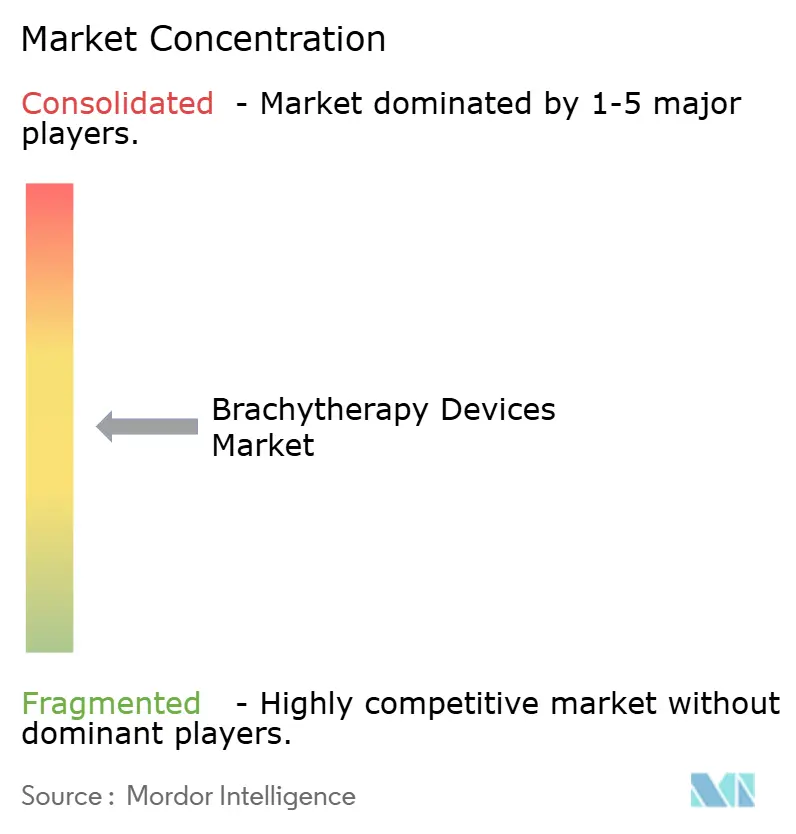
The Global brachytherapy devices industry is moderately fragmented, with multinationals balancing hardware breadth, software integration, and service wrap to secure account stickiness. Elekta, Varian, Isoray, and Eckert & Ziegler leverage multi-modal portfolios, while regional innovators such as BRIT/-BARC compete on cost-optimized HDR systems for emerging markets. Competitive intensity centers on AI-enhanced planning suites, electronic after-loading platforms, and isotope supply reliability.
Strategic alliances dominate differentiation. Elekta integrates GE HealthCare’s MIM Software to streamline contouring and plan-optimization pipelines. Azra AI collaboration automates registry abstraction, unlocking outcomes-based contracting opportunities. Eckert & Ziegler’s Actinium-225 ramp diversifies revenue into alpha-therapy precursor supply, creating synergies with brachytherapy source manufacturing.
Mergers and acquisitions align with expansion into adjacent oncology verticals. Elekta’s purchase of Xoft adds electronic brachytherapy, while BD’s planned separation of its Biosciences division could spin out radiotherapy assets into sharper growth vehicles. Vendor strategies increasingly pair capital equipment with managed-service models, locking multi-year refresh pipelines and underpinning revenue visibility across the Global brachytherapy devices market.
Brachytherapy Devices Industry Leaders
-
Carl Zeiss Meditec AG
-
Elekta AB
-
Becton, Dickinson and Company
-
Eckert & Ziegler BEBIG
-
Siemens Healthineers AG
- *Disclaimer: Major Players sorted in no particular order
Brachytherapy Devices Market Companies Covered in this Report
- Accuray
- Argon Medical Devices
- Beckton Dickinson
- Carl Zeiss
- CIVCO Medical solutions
- Eckert & Ziegler
- Elekta
- iCAD Inc.
- IsoRay
- Siemens Healthineers
- Theragenics
- ViewRay Inc.
- Panacea Medical Technologies
- C4 Imaging LLC
- Mevion Medical Systems
- Source Production & Equipment Co.
- IBt Bebig Belgium
- Advanced Oncology Solutions
Market Opportunities and Future Outlook
Whitespace is concentrated where facilities face isotope logistics constraints, shielding limitations, or workforce gaps, making electronic brachytherapy systems and workflow automation more practical adoption levers alongside conventional HDR/PDR. Outpatient economics and site-of-care shifts are also creating room for portable, less infrastructure-intensive offerings. At the same time, AI-driven planning and standardized QA tools can reduce planning cycle time and variability, supporting more consistent delivery in community settings.
Patient-tailored applicators and templates are moving closer to routine clinical feasibility in select centers, reinforcing opportunities for vendors that package imaging-to-device workflows, quality documentation, and planning software as an integrated offering. Recent evidence anchors this direction, including a January 2026 phase I clinical trial registration at Erasmus Medical Centre (NCT07435987) evaluating a patient-tailored 3D-printed cervical-cancer brachytherapy applicator, and a November 2024 FDA 510(k) clearance (K243045) for Braxx Biotech esophageal brachytherapy applicators, both pointing to ongoing productization of site-specific applicators. In Europe, April 2026 MDR certification for Eckert & Ziegler BEBIG Ru-106 eye applicators highlights the commercial importance of regulatory continuity for specialized brachytherapy segments, supporting sustained procurement pathways for niche indications such as uveal melanoma and retinoblastoma.
Recent Industry Developments in Brachytherapy Devices Market
- April 2026: Eckert & Ziegler secured EU MDR certification for its Ruthenium-106 (Ru-106) eye applicators used in ophthalmic brachytherapy. The certification supports continued access to these applicators in Europe for indications such as uveal melanoma and retinoblastoma, reinforcing supply continuity in a highly specialized brachytherapy segment.
- May 2025: Eckert & Ziegler Radiopharma GmbH signed a contract manufacturing agreement with Pentixapharm to produce patient-specific doses of Y90-PentixaTher for clinical trials under GMP conditions. While not a brachytherapy applicator deal, it strengthens radiopharma manufacturing capabilities and licensed handling infrastructure that also underpin sealed-source and isotope-adjacent supply resilience across radiotherapy ecosystems.
- May 2024: Elekta and GE HealthCare's MIM Software entered a collaboration to deliver cancer treatment planning solutions. The move reinforces vendor strategies around integrated planning and workflow software, which is increasingly bundled with brachytherapy-capable platforms to improve contouring, planning efficiency, and cross-modality coordination.
Brachytherapy Devices Market Report Scope and Research Methodology
Market Definition and Coverage
This market covers the revenue generated from devices used to deliver internal radiation therapy (brachytherapy) inside or very close to a tumor, across major care settings and geographies.
Scope exclusions: External beam radiotherapy systems, stand-alone treatment planning software, and non-brachytherapy oncology consumables are excluded from this sizing.
Segments Covered in This Report
- By Technique
- High Dose Rate (HDR) Brachytherapy Devices
- Low Dose Rate (LDR) Brachytherapy Devices
- Pulsed Dose Rate (PDR) Brachytherapy Devices
- By Product Type
- Seeds
- Applicators & Afterloaders
- Electronic Brachytherapy Systems
- Software & Treatment-Planning Solutions
- By Application
- Prostate Cancer
- Gynecologic Cancer
- Breast Cancer
- Skin Cancer
- Head & Neck Cancer
- Others
- By End User
- Hospitals
- Oncology Centers & Specialty Clinics
- Ambulatory Surgical Centers
- Geography
- North America
- United States
- Canada
- Mexico
- Europe
- Germany
- United Kingdom
- France
- Italy
- Spain
- Rest of Europe
- Asia-Pacific
- China
- Japan
- India
- South Korea
- Australia
- Rest of Asia-Pacific
- Middle East and Africa
- GCC
- South Africa
- Rest of Middle East and Africa
- South America
- Brazil
- Argentina
- Rest of South America
- North America
Data Sources, Market Sizing, and Validation
Desk Research
Desk research was used to map the clinical and procurement footprint of brachytherapy, and then to anchor model inputs visible in public data. We referenced sources such as the World Health Organization, the International Atomic Energy Agency, the US FDA databases for cleared devices and recalls, the International Agency for Research on Cancer cancer statistics, and national health system publications where radiotherapy capacity and utilization are discussed.
To translate the clinical footprint into a market view, we reviewed supporting materials including company annual reports and investor presentations, peer reviewed journals that discuss HDR and LDR adoption by indication, and reputable press coverage of cancer center expansions. We also used paid subscriptions for company financials and intelligence, patent databases for device development signals, and an import and export shipment-level database where it helped validate cross-border equipment movement. These desk research sources are illustrative, and we also consulted other public and paid sources for data collection, cross-checks, and clarification.
Primary Interviews and Surveys
Primary work focused on confirming what drives purchasing and replacement, and on checking where procedure volumes and installed base assumptions could be overstated in desk findings. We spoke with a mix of device manufacturers and distributors, medical physicists, radiation oncologists, and procurement stakeholders, covering mature markets and fast growing treatment hubs across APAC, EMEA, and the Americas so the assumptions could be stress-tested across different care pathways.
Distribution of primary research fieldwork respondents
| Company type | Respondent position | Region |
|---|---|---|
| Top tier: 34% | CXOs: 21% | APAC: 52% |
| Mid tier: 45% | Functional/Unit leaders: 37% | EMEA: 30% |
| Smaller Players: 21% | Managers: 42% | Americas: 18% |
Market-Sizing & Forecasting
Sizing starts with a top-down build where cancer incidence and treated patient pools are translated into expected brachytherapy procedures by key indications. Those procedures are then mapped to device usage rates and typical replacement cycles. After forming the demand pool, we convert it into revenue using price bands that reflect modality mix and purchasing patterns.
To keep the model practical, we used inputs such as HDR versus LDR share by indication, installed base and replacement timing for afterloaders and related hardware, number of brachytherapy-capable centers, typical fractionation patterns that shape utilization, and average selling price ranges observed in public tenders and buyer discussions. Where country level data were thin, we filled gaps with regional analogs based on cancer burden and care access, then adjusted using local expert feedback.
For forecasting, we relied on scenario analysis, linking growth to signals such as radiotherapy infrastructure expansion, guideline-driven shifts in cervical and prostate cancer treatment, reimbursement stability, and staffing availability for medical physics. We also ran selective bottom-up approximations as a check, including supplier and channel sense checks on unit shipments and sampled ASP times volume, and then re-tuned the final totals when they drifted from observed market behavior.
Data Validation & Update Cycle
Outputs were validated by comparing totals against independent signals, including installed base reasonableness, procedure-volume logic, and pricing ranges discussed by buyers and clinicians. When variances appeared, we revisited assumptions, and we triggered follow-ups with a smaller set of respondents to confirm whether the change was real or driven by data timing.
Before sign-off, the model goes through multiple analyst review steps, including specific checks for currency conversion timing, double counting between device categories, and outlier country growth rates. Reports are refreshed annually, with interim updates when material events occur, such as major regulatory actions, reimbursement changes, or facility expansion announcements. Right before delivery, we complete a final pass so clients receive the most current view available.
Mordor Intelligence's Brachytherapy Devices Market Estimate Compared With Other Published Estimates
Published numbers for brachytherapy devices do not always match because the product list, the year used as the starting point, and the pricing logic vary between studies. Even when the topic name is the same, some estimates are built more from broad oncology equipment totals, which can shift the final value.
External beam radiotherapy platforms sit outside Mordor Intelligence's scope here, and that single exclusion alone can move totals when other publishers treat radiotherapy equipment as one combined bucket. Differences also come from whether procedure-based demand is used to anchor volumes, how HDR versus LDR mix is projected, and whether currency conversion aligns to the same time window as the underlying input data.
Benchmark comparison
| Source | Market Size | Gaps in Research Methodology |
|---|---|---|
| Mordor Intelligence | USD 1.04 B (2026) | |
| Industry Publisher A | USD 1.02 B (2024) | Uses an earlier base year and a different mix assumption across HDR and LDR, which can understate the step-up from recent center expansions and replacement-driven purchases. |
| Industry Publisher B | USD 1.06 B (2024) | Appears to apply broader oncology equipment pricing progression to the category, which can inflate device revenue when local tender price bands and replacement cycles are not explicitly modeled. |
Taken together, the spread is mainly explained by scope boundaries, base-year timing, and how volumes are connected to pricing. By tying the model to treated patient pools, center capability, and realistic replacement behavior, the final value stays traceable to clear clinical and procurement signals, which makes it easier to defend on a client call and update when conditions change.
Key Questions Answered in the Report
How large is the Global brachytherapy devices market in 2026?
The market is valued at USD 1.04 billion in 2026 and is projected to reach USD 1.45 billion by 2031, reflecting a 6.98% CAGR.
Which technique segment is growing fastest?
Pulsed-dose-rate devices are set to grow at a 8.88% CAGR through 2031 as they blend HDR precision with LDR radiobiology.
What drives adoption in ambulatory surgical centers?
Favorable outpatient reimbursement, HDR’s single-visit protocols, and electronic systems that operate without shielded vaults underpin a 9.24% CAGR for ASCs.
How is AI influencing brachytherapy workflows?
Reinforcement-learning and large-language-model tools cut planning time from hours to minutes while maintaining plan quality, easing workforce pressure and standardizing care.
Which region will post the highest growth?
Asia-Pacific will record a 9.08% CAGR to 2031, propelled by expanding infrastructure, indigenous HDR technology, and government initiatives to bridge treatment gaps.