
Booster Compressor Market Size and Share
Market Overview
| Study Period | 2021 - 2031 |
|---|---|
| Market Size (2026) | USD 3.53 Billion |
| Market Size (2031) | USD 4.62 Billion |
| Growth Rate (2026 - 2031) | 5.51 % |
| Fastest Growing Market | Asia Pacific |
| Largest Market | Asia Pacific |
| Market Concentration | Medium |
Major Players *Disclaimer: Major Players sorted in no particular order Image © Mordor Intelligence. Reuse requires attribution under CC BY 4.0. | |
Booster Compressor Market Analysis by Mordor Intelligence
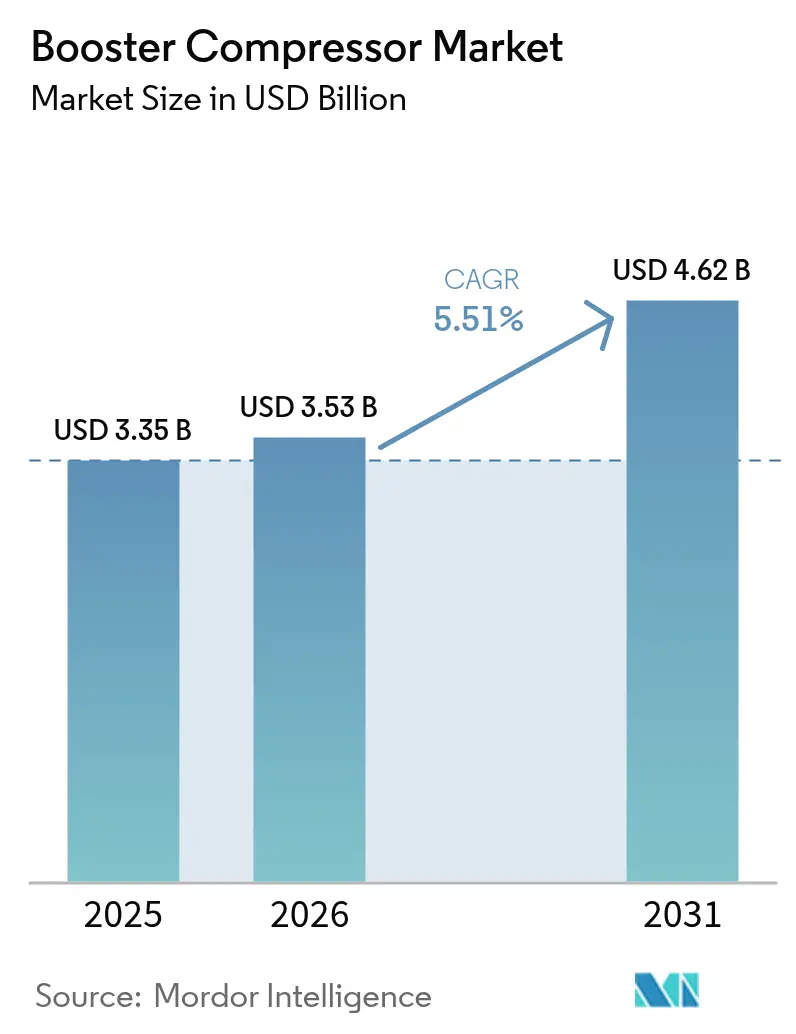
The Booster Compressor Market size was valued at USD 3.35 billion in 2025 and estimated to grow from USD 3.53 billion in 2026 to reach USD 4.62 billion by 2031, at a CAGR of 5.51% during the forecast period (2026-2031).
The sustained expansion reflects steady capital spending on natural gas transmission upgrades, manufacturing automation, and early hydrogen fuel infrastructure. Strong policy support for energy-efficient equipment, wider adoption of variable-speed technologies, and rental platforms that lower entry barriers also underpin demand. Tightening federal standards in the United States, as well as parallel rules in Canada and the European Union, are accelerating replacement cycles toward designs with higher isentropic efficiency and lower emissions [1]U.S. Department of Energy, “Energy Conservation Program: Test Procedures for Compressors,” energy.gov. In parallel, the hydrogen economy’s push for 450-900 bar refueling systems is creating premium opportunities at the upper end of the pressure spectrum, while the Asia-Pacific region’s industrialization keeps volume demand high.
Key Report Takeaways
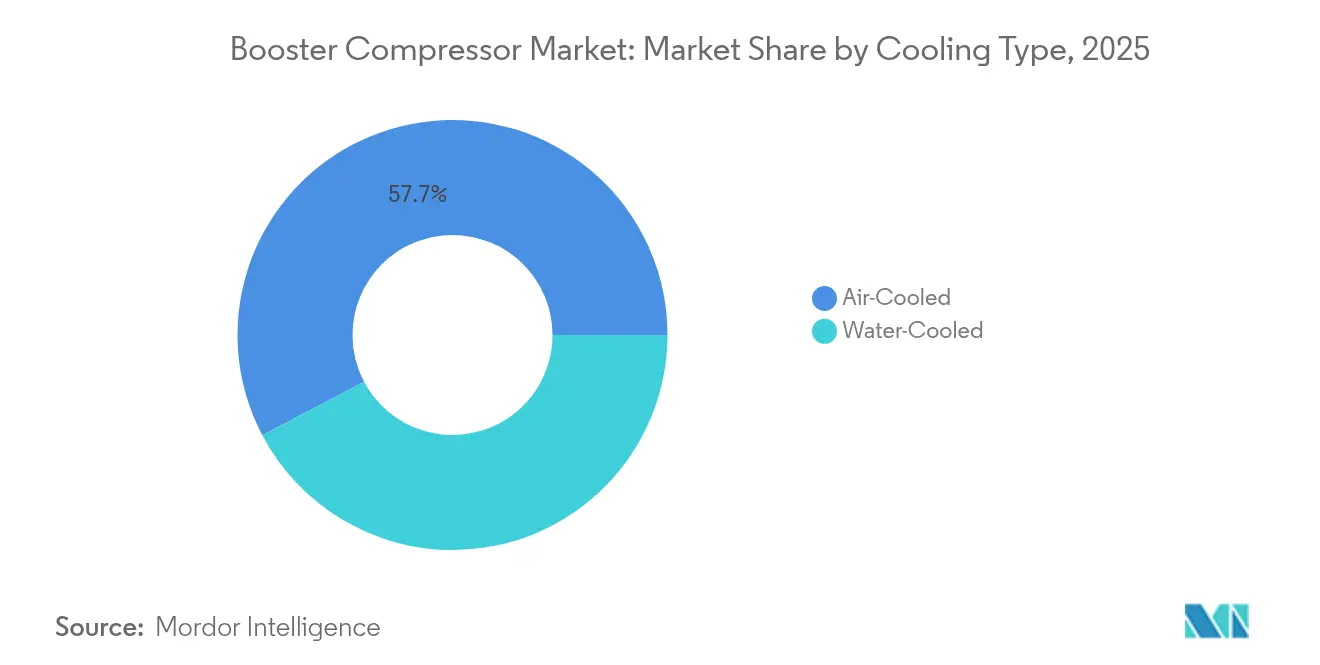
- By cooling type, air-cooled systems led with 57.72% revenue share in 2025; water-cooled designs are projected to expand at a 6.63% CAGR through 2031.
- By compression stage, single-stage units captured 50.35% of the booster compressor market share in 2025, whereas three-stage and above configurations are forecast to grow at a 7.08% CAGR.
- By lubrication type, oil-lubricated equipment accounted for 60.84% of the booster compressor market size in 2025; oil-free systems are projected to grow at a 6.86% CAGR through 2031.
- By pressure range, the 21–40 bar bracket commanded 43.55% share in 2025, while the 101–350 bar segment is advancing at 6.74% CAGR.
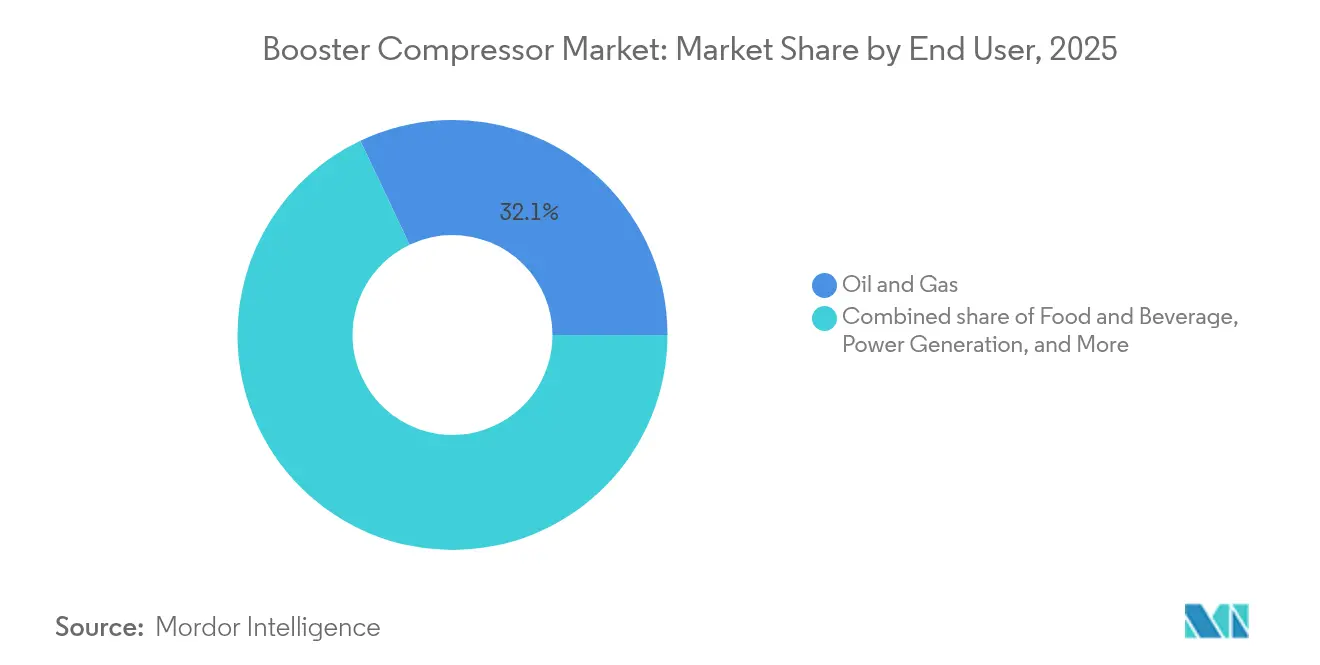
- By end user, the oil & gas sector accounted for a 32.05% share of the booster compressor market size in 2025, while the food & beverage sector is pacing the field at a 7.43% CAGR.
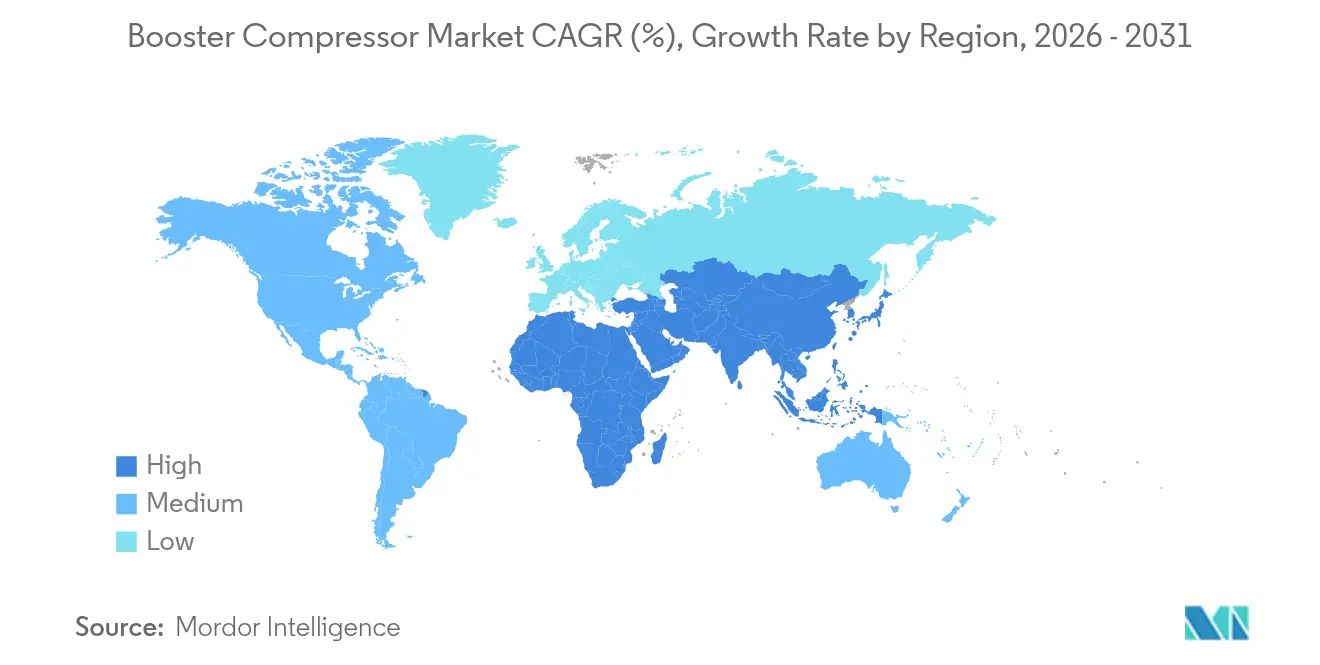
- By geography, the Asia-Pacific region dominated with a 39.45% revenue share in 2025 and is expected to continue posting the fastest regional growth at a 6.78% CAGR through 2031.
Note: Market size and forecast figures in this report are generated using Mordor Intelligence’s proprietary estimation framework, updated with the latest available data and insights as of 2026.
Market Trends and Insights
Drivers Impact Analysis of Booster Compressor Market*
| Driver | (~) % Impact on CAGR Forecast | Geographic Relevance | Impact Timeline |
|---|---|---|---|
| Rising natural-gas pipeline pressure upgrade programs | 1.20% | North America & Europe, spill-over to APAC | Medium term (2-4 years) |
| Industrial demand for high-pressure compressed air | 1.00% | Global, concentrated in APAC manufacturing hubs | Long term (≥ 4 years) |
| Expansion of EOR & well-head compression in oil & gas | 0.80% | North America core, Middle East & North Africa | Short term (≤ 2 years) |
| Energy-efficiency mandates for compressed-air systems | 0.70% | North America & EU regulatory leadership | Medium term (2-4 years) |
| Hydrogen refueling stations requiring 450-bar boosters | 0.60% | Europe & APAC early adoption, North America following | Long term (≥ 4 years) |
| “Compressed-air-as-a-service” rental platforms | 0.40% | Global, with early gains in developed markets | Medium term (2-4 years) |
| Source: Mordor Intelligence | |||
Rising Natural Gas Pipeline Pressure Upgrade Programs
Major transmission operators are modernizing aging lines to meet higher throughput targets and tighter emission limits. In 2024-2025, the Federal Energy Regulatory Commission cleared expansions, including the South System Expansion 4 project, which added 1.3 million Dth/d via new loops and 13 station upgrades.[2]Federal Energy Regulatory Commission, “Order Granting Certificate for South System Expansion 4,” ferc.gov Similar replacements by Consumers Energy in Michigan and Northwest Pipeline in Wyoming feature advanced boosters that reduce NOx emissions by 93% and methane emissions by 89%.[3][4]Consumers Energy, “Four Cities Metro Pipeline Project Overview,” consumersenergy.com Northwest Pipeline LLC, “Kemmerer Replacement Environmental Report,” nwpipeline.com Higher operating pressures require multi-stage reciprocating or integrally geared centrifugal designs that can maintain flow efficiency across varying load profiles. Vendors that can bundle equipment with turnkey installation and remote monitoring win orders because operators prefer single-point accountability for these capital-intensive projects.
Industrial Demand for High-Pressure Compressed Air
Precision manufacturing segments—such as laser cutting, PET bottle blowing, and semiconductor cleaning—now specify base pressures of 30-40 bar, rather than the legacy 7-13 bar range. The U.S. Department of Energy’s 2025 efficiency rule compels OEMs to raise minimum isentropic performance, pushing factories to retire legacy plants early. Asia-Pacific’s production-linked incentive schemes in India, along with the “Making Indonesia 4.0” roadmap, are increasing the installed base of automated lines that operate on oil-free, high-pressure air. Variable-speed drives improve part-load efficiency by up to 35%, making three-stage packages economical for mid-sized job shops. As a result, the booster compressor market is experiencing a structural shift toward equipment that balances pressure stability, energy consumption, and air purity.
Expansion of EOR & Well-Head Compression in Oil & Gas
Operators continue to extract incremental value from mature oil and gas reservoirs. Field trials show down-hole boosters can lift production by 32-41%, equivalent to 14-20 Bcf extra per well over five years. Projects such as the UAE’s Sajaa gas field have installed 12 surface boosters, totaling 18,600 HP, to counter declining formation pressure. Subsea compression is also scaling; Chevron’s USD 4 billion Jansz-Io project and Equinor’s Åsgard upgrades testify to the payoff in large gas provinces. These applications favor oil-free, three-stage and above units with magnetic bearings that reduce maintenance windows—a feature increasingly requested in tenders.
Energy-Efficiency Mandates for Compressed-Air Systems
Policy makers are turning the screw on industrial energy use. California’s Energy Commission enforces state-level compressor standards projected to save consumers USD 22 million per year. Natural Resources Canada adopts equivalent regulations for units manufactured after January 2025. OEMs are therefore redesigning packages with intercoolers, heat-recovery loops, and smart controllers that trim annual electricity bills by 20% in food-grade applications. In procurement, buyers now score bids on specific power (kW/m³/min) rather than headline horsepower, re-shaping competitive positioning within the booster compressor market.
Restraints Impact Analysis of Booster Compressor Market*
| Restraint | (~) % Impact on CAGR Forecast | Geographic Relevance | Impact Timeline |
|---|---|---|---|
| High capital & maintenance expenditure | -0.90% | Global, particularly affecting smaller operators | Long term (≥ 4 years) |
| Volatile upstream CAPEX cycles | -0.70% | North America shale regions, global offshore | Short term (≤ 2 years) |
| Shortage of certified high-pressure technicians | -0.50% | North America & Europe acute, APAC emerging | Medium term (2-4 years) |
| Price erosion from VSD centrifugal alternatives | -0.40% | Global industrial applications | Long term (≥ 4 years) |
| Source: Mordor Intelligence | |||
High Capital & Maintenance Expenditure
Multi-stage boosters rated above 350 bar can cost three times a standard plant air unit and require specialized alloys, precision components, and explosion-proof enclosures. Lifecycle studies indicate that service accounts for 15-25% of total ownership cost, a burden that deters smaller processors from upgrading. The global HVACR sector reports 80,000 open technician positions in North America, inflating labor rates and lengthening downtime. Manufacturers respond with ten-year service-interval designs that utilize magnetic bearings, eliminating the need for oil circuits, as seen in Baker Hughes’ Integrated Compressor Line. Even so, sticker shock slows adoption for cash-constrained buyers in emerging economies.
Volatile Upstream CAPEX Cycles
Oil-company budgets remain cyclical. U.S. independents trimmed spending to USD 61.7-65.4 billion in 2024 despite higher benchmark prices, reflecting shareholder pressure for capital discipline. Exploration’s share of global upstream capex slipped to 8%, curbing new gas-gathering compressor orders. While selective investments still flow to projects with rapid payback or ESG advantages, the booster compressor market experiences quarter-on-quarter order volatility. Suppliers therefore diversify into midstream and industrial segments to buffer revenue swings.
*Our forecasts treat driver/restraint impacts as directional, not additive. The impact forecasts reflect baseline growth, mix effects, and variable interactions.
Booster Compressor Market Segment Analysis
By Cooling Type:
Water-Cooled Systems Drive Efficiency GainsWater-cooled boosters delivered the fastest revenue growth, although air-cooled models still dominated the booster compressor market size. Water-based intercooling dissipates heat more effectively across three-stage trains, trimming motor kW by up to 8% in 350-bar hydrogen service. Demand is strongest in food-grade and high-duty petrochemical plants where continuous operation justifies higher installation costs. OEMs tout heat-recovery kits that repurpose rejected thermal energy to power building hot-water systems, thereby improving overall facility efficiency. In contrast, air-cooled units remain the preferred choice for construction sites, containerized rigs, and regions facing water scarcity regulations. Their rugged design, minimal auxiliary hardware, and simpler maintenance keep them central to rental fleets that underpin the booster compressor market.
Second-generation water-cooled designs now feature stainless-steel tube bundles and fully welded plates to resist scaling in variable water quality. Operators running hydrogen stations report discharge-temperature reductions of 15°C and valve life extensions of 30% after switching from air to water cooling. While capital outlay is higher, plant managers recoup their investment through lower electricity bills and reduced unscheduled shutdowns. Consequently, water-cooled share is expected to chip steadily at the dominance of air-cooled systems over the forecast period.


By Compression Stage:
Multi-Stage Configurations Gain MomentumSingle-stage boosters maintain a 50.35% share of the booster compressor market for pressures up to 100 bar due to their compact footprint and low part count. However, as hydrogen, laser-cutting, and PET lines migrate toward 350 bar requirements, three-stage and above packages log the fastest uptake. Multi-stage compression spreads pressure ratio across cylinders, cutting discharge temperature and valve stress, which in turn extends overhaul intervals. Energy audits in Asia-Pacific’s beverage plants show that three-stage machines save 12% in specific power compared to retrofitted two-stage sets.
Technological advances, such as active electronically controlled intercoolers and variable clearance pockets, further enhance multi-stage efficiency. High-pressure OEMs integrate magnetic-bearing crankcases that enable oil-free operation at 1,500 rpm, while maintaining vibration levels below API 618 thresholds. Engineering, procurement, and construction firms favor such integrated solutions because they simplify compliance with specifications in turnkey hydrogen stations. In parallel, two-stage units occupy a mid-range niche for users upgrading from plant air to 40-100 bar service yet lacking the budget or need for full three-stage performance.
By Lubrication Type:
Oil-Free Technology Addresses Contamination ConcernsHeightened scrutiny of food-grade safety and pharmaceutical purity is steering purchases toward Class 0 certified oil-free boosters. These designs employ high-temperature non-stick coatings, labyrinth seals, and, in some cases, water-injected compression to remove hydrocarbon risk. The extra investment—often 20-30% over oil-lubricated peers—is justified by avoiding product recalls and simplifying ISO 8573-1 compliance audits. Electronics fabs likewise adopt oil-free systems to prevent downstream contamination on wafer lines. As a result, the oil-free booster compressor industry is expected to see a CAGR outpacing the overall market through 2031.
Oil-lubricated boosters continue to dominate high-horsepower, EOR duty because the lubricant film dampens piston slap and facilitates heat dissipation in sour-gas service. Contemporary filtration systems achieve 0.01-micron particle removal, making them suitable for many industrial applications where absolute oil-free air is not critical. Aftermarket vendors market synthetic PAO oils that extend oil-change intervals to 8,000 hours, thereby lowering downtime. Therefore, while oil-free units grow the fastest, the absolute installed base of oil-lubricated machines remains large, especially in the heavy industry sector, supporting a healthy spare parts and service economy within the booster compressor market.

By Pressure Range:
High-Pressure Applications Accelerate GrowthSystems rated 101-350 bar are the breakout segment because they enable premium processes such as high-definition laser cutting, PET preform blowing, and pressure testing of carbon-fiber pressure vessels. The booster compressor market size for this band recorded a 6.74% CAGR, driven by the expansion of fleets of laser cutters in metal fabrication hubs across China, Vietnam, and Mexico. OEM field data show a 100-bar laser-assist gas can cut stainless steel 20% faster, offsetting higher utility costs. Meanwhile, base-load plant air in the 21-40 bar range continues to anchor volume shipments to general manufacturing and mining.
Above 350 bar boosters, though niche, command the highest unit prices. Hydrogen hubs in Germany and South Korea specify a discharge pressure of 700-900 bar for heavy-duty truck dispensing, generating premium margins for diaphragm or compound piston designs. Exploratory CCS projects also require CO₂ compression above 200 bar for pipeline injection. As governments roll out net-zero roadmaps, vendors with proven ultra-high-pressure references are poised to capture a disproportionate share of the profit.
By End User:
Food & Beverage Sector Leads GrowthFood & beverage processors are automating to boost throughput and comply with Hazard Analysis and Critical Control Point protocols, creating upsized demand for clean, dry, high-pressure air. Class 0 oil-free boosters now power blow-molding, mixing, and packaging lines that run 24/7. Global bottlers report energy savings of 12% after switching to variable-speed, three-stage units paired with heat recovery for pasteurization water. Although oil & gas still account for 32.05% of current revenue, its growth track is slower due to cautious upstream capital expenditures. Chemical and petrochemical sites maintain steady replacement demand, while metals, automotive, and electronics plants broaden the customer base in the Asia-Pacific.
Global quick-service restaurant chains are pressuring suppliers to certify the quality of compressed air across their entire cold-chain network. That requirement trickles down the value chain to packaging converters and logistics firms, further enlarging the addressable pool for oil-free boosters. Net result: the food & beverage segment is the clear growth engine within the booster compressor market through 2031.
Geography Analysis
APAC Booster Compressor Market
Asia-Pacific remains the cornerstone of booster compressor demand. China, India, and ASEAN account for nearly 39.45% of 2025 sales, a share expected to edge up as new electronics fabs and vehicle plants break ground under national manufacturing roadmaps. Although China’s export share in low-value goods slipped, its higher value-added output still uses more compressed air per unit of GDP. India’s incentive scheme channels tax benefits to producers of mobile phones, solar modules, and specialty chemicals, each of which requires oil-free, high-pressure air systems. Southeast Asia’s greenfield plants often bypass legacy two-stage machines and order three-stage packages with digital controllers from the outset, accelerating the diffusion of technology.
North America and Europe Booster Compressor Market
North America ranks second, thanks to upgrades in shale gas infrastructure. The U.S. Department of Energy’s new compressor standards, effective January 2025, are prompting early replacements, while FERC-approved pipeline extensions require modern boosters equipped with methane leak detection. Modular hydrogen stations in California and Texas add a small but fast-growing volume. Europe shows steady replacement demand, particularly in Germany, France, and the Nordics, where automotive, food, and green hydrogen projects converge. The EU policy, which requires public hydrogen stations every 200 km along core corridors by 2030 under the Alternative Fuels Infrastructure Regulation, directly lifts ultra-high-pressure orders.
South America and MEA Booster Compressor Market
South America and the Middle East & Africa form the long-term frontier. Brazil’s pre-salt developments and Saudi Arabia’s push into non-oil industries provide anchor projects; however, political and logistical risks temper near-term volumes. Nonetheless, vendors focused on service quality and financing packages can win outsized shares as these regions diversify their industrial bases.
Mordor Intelligence provides coverage of the booster compressor market across other key regional markets, including Middle East and Africa and Asia, each with their regulatory frameworks and demand patterns.

Regulatory Landscape
In the United States, booster compressor packages sold for commercial and industrial duty are governed by U.S. Department of Energy energy conservation standards and certification requirements under 10 CFR 431.345, which has been a key compliance anchor for OEM basic models manufactured from 2025 onward. Safety and mechanical integrity requirements also shape equipment design and documentation, including OSHA 29 CFR 1910.169 for compressed air receivers (ASME-coded vessels, relief protection, and drainage provisions) and oil and gas procurement norms that reference API Standard 618 (6th edition, May 2024) for reciprocating compressors, aligning design and fabrication expectations with ASME Boiler and Pressure Vessel Code Section VIII.
In Europe, ongoing standards updates continue to influence compressor package specification language used by EPCs and end users for compressor packages and adjacent applications. These include CEN publication of EN 12693:2026 (June 2026) and EN 12900:2025 for compressor rating conditions and performance data in refrigerant-related contexts. Broader EU ecodesign policy for refrigerating appliances (Commission Regulation (EU) 2019/2024) and related energy-efficiency procurement practices reinforce demand for higher-efficiency configurations, with suppliers pressed to provide verifiable test data, controls, and component traceability across global shipments.
Competitive Landscape
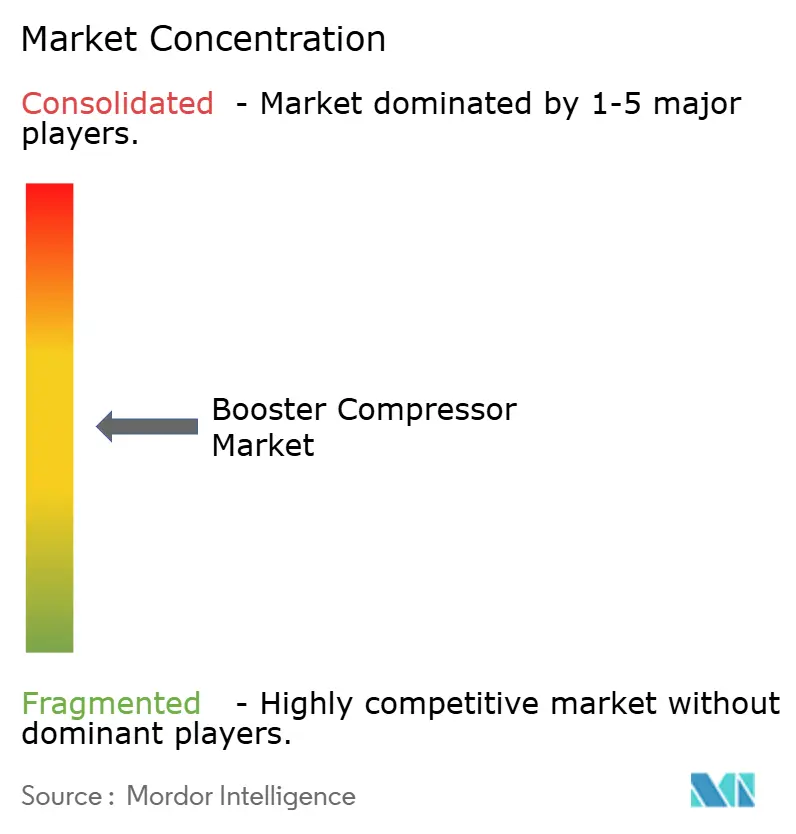
The booster compressor market is moderately concentrated, with the top five vendors controlling a combined 55-60% of global revenue. Atlas Copco, Ingersoll Rand, and Baker Hughes rank at the front, and all three continued bolt-on acquisitions to deepen product portfolios. Atlas Copco’s purchase of Kyungwon Machinery adds local Korean manufacturing and 126 staff, strengthening service proximity in Asia-Pacific. Honeywell’s USD 2.16 billion deal for Sundyne broadens reach into integrally geared packages for clean-fuel complexes. These moves illustrate a pivot toward higher-pressure, higher-value machines that align with hydrogen and carbon-capture megatrends.
Technology boundaries are blurring. Variable-speed centrifugal systems now overlap reciprocating designs up to 150 bar, forcing piston OEMs to innovate oil-free cylinders and smart unloaders. Digital twins embedded in control software predict bearing wear and optimize valve timing, trimming energy use by 5-7% in refinery service. Smaller specialists—Burckhardt Compression, Howden, and Ariel—leverage deep engineering competence in ultra-high-pressure or process-gas niches to defend margins. Meanwhile, distributors such as Hitachi Global Air Power’s newly acquired dealers in Texas integrate parts, rental, and condition-monitoring services to secure annuity revenue.
White-space opportunities arise in service-based models. Customers increasingly request guaranteed compressed-air supply rather than equipment ownership, leading major players to scale “air-as-a-service” contracts with IoT dashboards. Rental fleets also become a pathway for rapid adoption of energy-efficient units because pay-back risk shifts to the provider. The net result is intensifying competition not only on hardware capabilities but on financing, digital services, and sustainability credentials.
Booster Compressor Industry Leaders
Ingersoll-Rand plc
Atlas Copco AB
Baker Hughes Company
Siemens Energy AG
Gardner Denver Inc.
- *Disclaimer: Major Players sorted in no particular order
Booster Compressor Market Companies Covered in this Report
- Atlas Copco AB
- Ingersoll Rand PLC
- Baker Hughes Company
- General Electric Company
- Siemens Energy AG
- Gardner Denver Inc.
- Kaeser Kompressoren SE
- Bauer Kompressoren GmbH
- Quincy Compressor LLC
- Sullair LLC (Hitachi)
- Elgi Equipments Ltd
- Ariel Corporation
- Kobelco Compressors
- Doosan Portable Power
- BOGE Kompressoren
- IDEX Corporation
- Aircomp Enterprises
- Fusheng Group
- Hanwha Power Systems
- IHI Rotating Machinery

Market Opportunities and Future Outlook
Energy-efficiency driven retrofit and optimization is the main whitespace theme. Operating-cost sensitivity is rising alongside mandatory efficiency and test-procedure compliance in key markets such as the United States (10 CFR 431.345). Buyers are increasingly weighting equipment on measurable efficiency and controllability, creating room for variable-speed integration, packaged controls, and service bundles that reduce lifecycle cost, particularly for mid-pressure industrial air systems where pressure management translates into direct energy savings. Right-sizing and pressure reduction positioning also supports demand, since end users can reduce system losses by installing point-of-use boosters rather than running entire plants at elevated pressure.
Higher-pressure and specialty-gas applications also continue to broaden the addressable mix, supported by visible supplier activity and specification requirements. Atlas Copco Gas and Process, for instance, offers centrifugal fuel gas boosters up to 70 bar(a) with wide flow ranges, aligning with gas processing and combustion systems that need stable supply under fluctuating inlet conditions. Industrial electrification and low-emissions operating philosophies are further pushing upgrades toward modernized booster architectures and tighter sealing and monitoring, which supports take-up of digital condition monitoring, modular skid packages, and design features aimed at stricter process and safety requirements in oil and gas, hydrogen-adjacent projects, and CCUS-related compression trains.
Recent Industry Developments in Booster Compressor Market
- February 2026: TEWATT launched a new booster compressor featuring a four-row, three-stage compression architecture and incorporating Ariel technology. The release targets higher-pressure duties with a compact design approach, supporting OEM differentiation in reliability-focused applications where proven compression technology is a key purchasing criterion.
- March 2025: Honeywell completed its acquisition of Sundyne for USD 2.16 billion, expanding its portfolio in integrally geared compression for refining and clean-fuels applications. The deal strengthens Honeywell's ability to address packaged, higher-value compression trains and aftermarket support needs that influence long-cycle capital projects.
- May 2024: API published the 6th edition of API Standard 618 for reciprocating compressors used in petroleum, chemical, and gas industry services. The revision refreshes baseline design, manufacturing, and testing expectations referenced in tender specifications, prompting OEMs and packagers to align documentation, materials, and QA processes for project acceptance.


Booster Compressor Market Report Scope and Research Methodology
Market Definition and Coverage
For this report, the booster compressor market means revenue earned from booster compressors that raise already-compressed air or gas to a higher pressure, across industrial and energy end uses, and counted at the equipment sales level.
Scope exclusions: We exclude routine maintenance-only services and generic upstream air compressors that do not perform a dedicated boosting step.
Segments Covered in This Report
- By Cooling Type
- Air-Cooled
- Water-Cooled
- By Compression Stage
- Single-Stage
- Two-Stage
- Three-Stage and Above
- By Lubrication Type
- Oil-Lubricated
- Oil-Free
- By Pressure Range
- 21 to 40 bar
- 41 to 100 bar
- 101 to 350 bar
- Above 350 bar
- By End User
- Oil and Gas
- Chemicals and Petrochemicals
- Power Generation
- Manufacturing
- Food and Beverage
- Other Process Industries
- By Geography
- North America
- United States
- Canada
- Mexico
- Europe
- Germany
- United Kingdom
- France
- Italy
- NORDIC Countries
- Russia
- Rest of Europe
- Asia-Pacific
- China
- India
- Japan
- South Korea
- ASEAN Countries
- Rest of Asia-Pacific
- South America
- Brazil
- Argentina
- Rest of South America
- Middle East and Africa
- Saudi Arabia
- United Arab Emirates
- South Africa
- Egypt
- Rest of Middle East and Africa
- North America
Data Sources, Market Sizing, and Validation
Desk Research
Desk research was used to set the factual base of the market model and keep the scope grounded in actual industrial activity. We reviewed public energy and manufacturing indicators, trade and production signals, and safety or performance references that show how booster compressors are specified and purchased.
Sources included non-paywalled and official references such as U.S. Energy Information Administration statistics, Eurostat industrial production series, UN Comtrade trade data, International Energy Agency releases, and standards bodies guidance such as ISO and ASME publications. We also used company annual reports, investor presentations, and credible industry press to understand typical pressure ranges, application fit, and ordering cycles. Where needed, paid subscriptions for company financials and intelligence, news and financials, patent databases, and shipment-level import and export data were used to cross-check company exposure and product activity. These examples are not exhaustive, and many other public and paid references were used to collect data, validate assumptions, and clarify open questions.
Primary Interviews and Surveys
Primary work focused on confirming how booster compressors are selected, priced, and replaced across end users such as oil and gas, manufacturing, and other process industries, and then validating regional demand patterns. We spoke with a mix of manufacturers, distributors, integrators, and plant-side users to test assumptions on pressure-range mix, oil-free versus oil-lubricated preference, and lead times that affect how annual revenue is recognized.
Distribution of primary research fieldwork respondents
| Company type | Respondent position | Region |
|---|---|---|
| Top tier: 33% | CXOs: 13% | APAC: 45% |
| Mid tier: 53% | Functional/Unit leaders: 34% | EMEA: 30% |
| Smaller Players: 14% | Managers: 53% | Americas: 25% |
Market-Sizing & Forecasting
Sizing started with a top-down build that reconstructs demand using industrial activity signals and application-level adoption, then converts that demand pool into equipment revenue by applying typical pressure-range and lubrication preferences. In practice, we used indicators such as refinery and petrochemical project momentum, broader manufacturing output, industrial gas and process-air needs, compressor replacement cycles, and observed ordering patterns by region.
The totals were then corroborated with selective bottom-up approximations, where supplier roll-ups, channel checks, and sampled average selling price by volume were used to validate the order of magnitude and adjust for gaps. When company disclosures did not isolate booster compressors, revenue splits were inferred from product-line emphasis, application exposure, and trade signals, then checked again with interviewees.
For forecasting, we used scenario analysis supported by a simple multivariate regression layer in regions where consistent macro series were available, and the drivers were kept practical. Variables that mattered most included energy and industrial capex direction, capacity additions in process industries, the mix shift toward higher pressure ranges, and the pace of oil-free adoption in sensitive applications. The final forecast path was reviewed with experts so the growth curve stays aligned with on-the-ground procurement behavior rather than only macro averages.
Data Validation & Update Cycle
Outputs were checked through multiple steps so unexpected jumps are explained before sign-off. We compared model results against independent signals such as industrial production trends, trade movement for relevant equipment categories, and the timing of large project awards, then investigated variances that did not fit the expected demand story.
A second analyst review was used to re-check scope boundaries, unit economics logic, and regional splits, and outreach was repeated when a key assumption looked unstable. Reports are refreshed annually, and interim updates are made when material events occur that can shift demand, pricing, or supply availability. Before delivery, a fresh analyst pass is completed so the client receives the most up-to-date view.
Mordor Intelligence's Booster Compressor Market Size Compared With Other Published Estimates
Published market sizes for booster compressors often differ, even when the growth story sounds similar, because the counting boundary is not always the same and the base year can vary across studies. Differences also come from how firms treat adjacent equipment, what they assume on average selling price progression, and how frequently underlying inputs are refreshed.
Shipment and trade movement checks, industrial activity indicators, and interview-backed pressure-range mix validation are the evidence points that keep Mordor Intelligence's estimate tied to equipment revenue for dedicated booster compressors rather than wider compressor families. If a study blends booster units with broader compressed-air systems, or applies a single global price curve without regional weighting, the total can move meaningfully in either direction.
Benchmark comparison
| Source | Market Size | Gaps in Research Methodology |
|---|---|---|
| Mordor Intelligence | USD 3.53 B (2026) | |
| Trade Journal A | USD 4.48 B (2025) | Uses a different base year and tends to include a wider set of booster and adjacent compressed-air packages, with limited clarity on pressure-range cutoffs and whether system components are counted with the core unit. |
| Industry Publisher B | USD 3.40 B (2023) | Anchors the market on an earlier year and may rely more on high-level industry totals, which can understate recent order-cycle changes and pricing updates across regions. |
Across the three figures, the spread is mostly explained by base-year choice and how strictly the scope is limited to dedicated booster compressors. By keeping the demand signals and pricing logic traceable to a few repeatable inputs, the model gives us a stable number that can be updated cleanly when new industrial and project data becomes available.


Key Questions Answered in the Report
What is the current size of the booster compressor market?
The booster compressor market size stands at USD 3.53 billion in 2026 and is projected to reach USD 4.62 billion by 2031.
Which region leads the booster compressor market?
Asia-Pacific holds 39.45% of global revenue and also records the fastest 6.78% CAGR through 2031.
Why are water-cooled booster compressors gaining traction?
Water-cooled designs dissipate heat more efficiently, enabling continuous 350-bar duty while lowering specific power, making them attractive for hydrogen stations and high-duty food plants.
How will DOE efficiency rules affect the market?
Mandatory test procedures effective July 2025 push buyers toward higher-isentropic efficiency models, stimulating replacement demand for compliant boosters.
Which end-use sector is expanding the fastest?
Food & beverage applications grow at a 7.43% CAGR as factories automate and adopt Class 0 oil-free air to meet stringent contamination standards.
What technology trend is reshaping competitive dynamics?
Variable-speed drive centrifugal packages now rival reciprocating boosters up to 150 bar, pressuring traditional suppliers to add smart control and hybrid designs.
Page last updated on:


 Your data is secure and never sold or shared.


