
Boat Rental Market Size and Share
Market Overview
| Study Period | 2019 - 2031 |
|---|---|
| Market Size (2026) | USD 19.46 Billion |
| Market Size (2031) | USD 25.65 Billion |
| Growth Rate (2026 - 2031) | 5.68 % |
| Fastest Growing Market | Asia Pacific |
| Largest Market | Europe |
| Market Concentration | Medium |
Major Players *Disclaimer: Major Players sorted in no particular order Image © Mordor Intelligence. Reuse requires attribution under CC BY 4.0. | |
Boat Rental Market Analysis by Mordor Intelligence
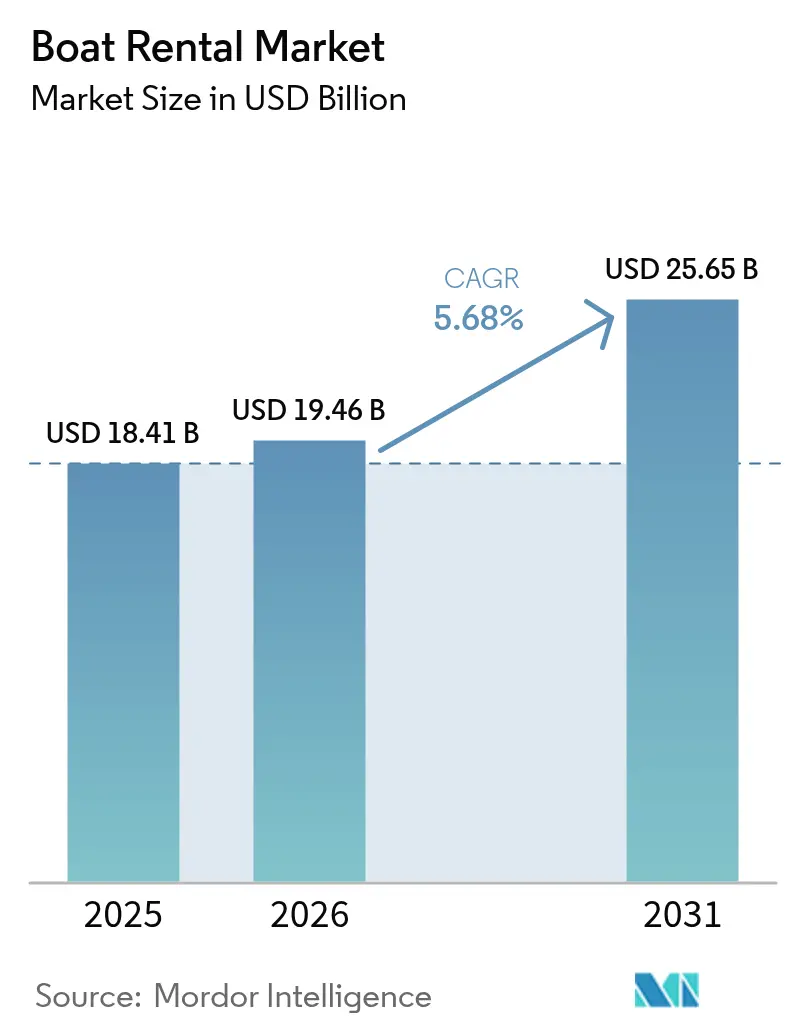
The boat rental market size is projected to expand from USD 18.41 billion in 2025 to USD 19.46 billion in 2026, reaching USD 25.65 billion by 2031, registering a 5.68% CAGR during the forecast period (2026-2031). A decisive shift from asset ownership to access-based consumption is unfolding, accelerated by the merger of two large peer-to-peer platforms that now aggregate supply in 50 countries. Demand is benefiting from the rebound in coastal and marine tourism, the convenience of digital booking, and millennials’ preference for experiences over possessions. Electrification mandates are nudging operators to evaluate battery-powered vessels, while subscription clubs are converting occasional renters into recurring users. Competitive intensity is moderate; technology-led scale advantages are emerging as the primary moat.
Key Report Takeaways
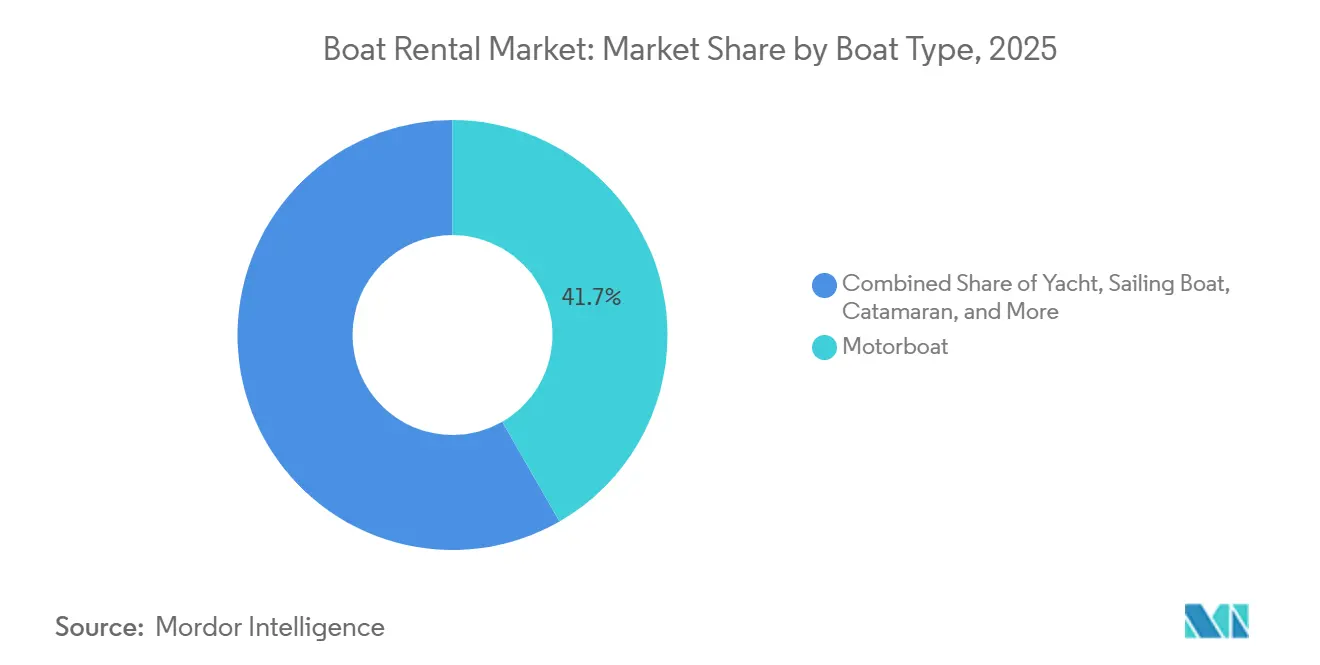
- By boat type, motorboats led with 41.71% of the boat rental market share in 2025, whereas catamarans are forecasted to grow at an 8.27% CAGR through 2031.
- By power source, internal-combustion engines dominated with 83.93% of the boat rental market share in 2025, while full-electric propulsion is set to advance at a 16.01% CAGR to 2031.
- By activity type, leisure sailing and cruising accounted for 47.17% of the boat rental market share in 2025, whereas watersports are projected to grow at a 7.48% CAGR during the forecast period.
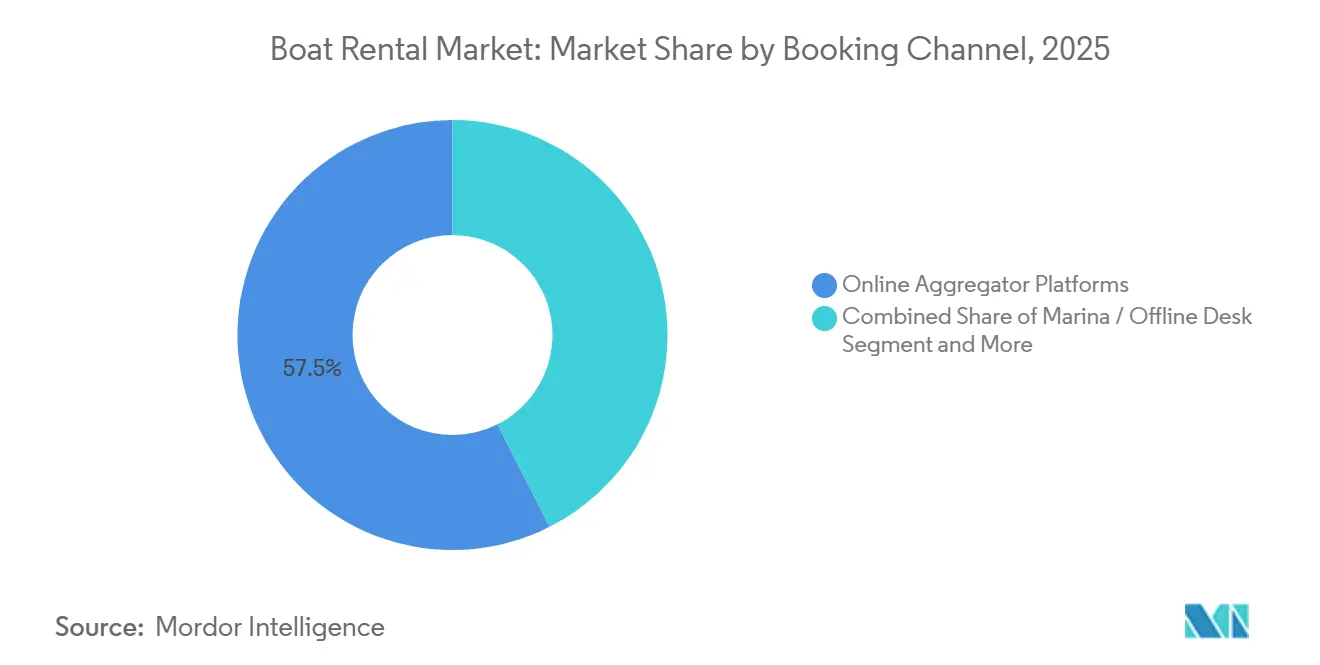
- By booking channel, online aggregator platforms accounted for 57.45% of the boat rental market share in 2025, while subscription and club models are expected to post a 10.73% CAGR through 2031.
- By rental duration, full-day rentals accounted for 41.71% of the boat rental market share in 2025; hourly bookings are likely to record a 9.24% CAGR through 2031.
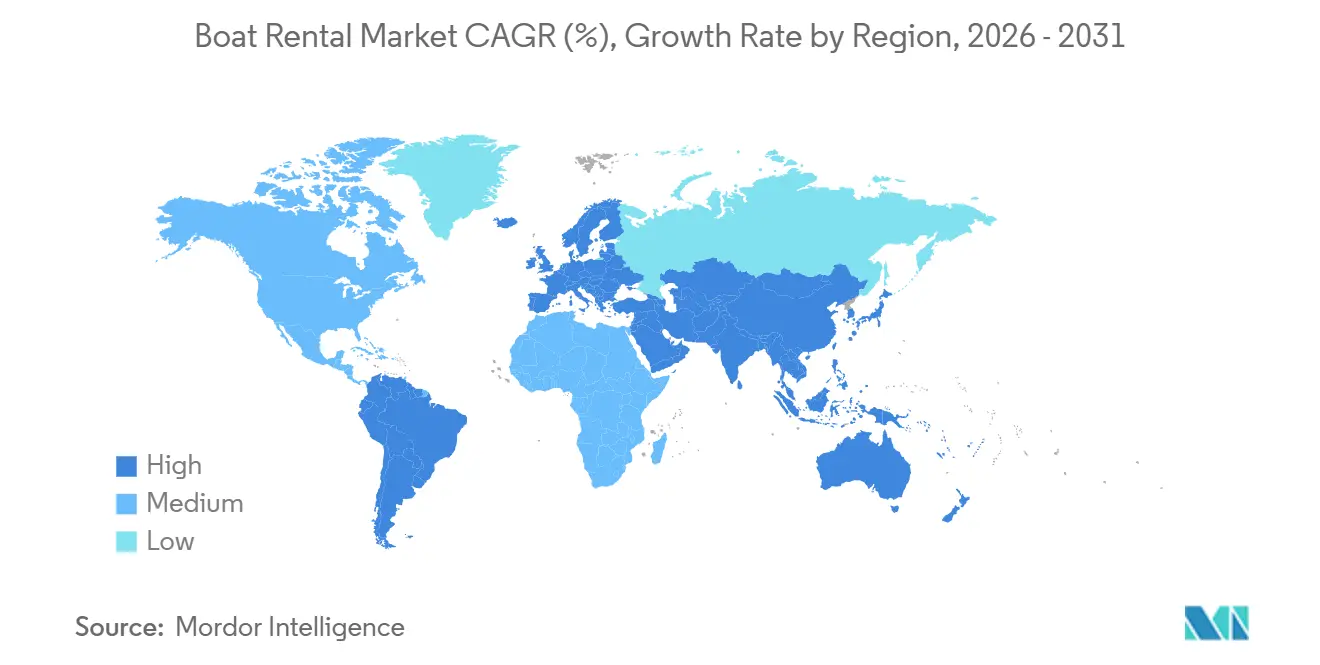
- By geography, Europe accounted for 39.43% of the boat rental market share in 2025, and Asia-Pacific is anticipated to expand at a 7.13% CAGR through 2031.
Note: Market size and forecast figures in this report are generated using Mordor Intelligence’s proprietary estimation framework, updated with the latest available data and insights as of 2026.
Market Trends and Insights
Drivers Impact Analysis of Boat Rental Market*
| Driver | (~) % Impact on CAGR Forecast | Geographic Relevance | Impact Timeline |
|---|---|---|---|
| Coastal and Marine Tourism | +1.8% | Global, with concentration in Mediterranean, Caribbean, Southeast Asia | Medium term (2-4 years) |
| Peer-to-Peer Rental Platforms’ Proliferation | +1.5% | Global, led by North America and Europe | Short term (≤ 2 years) |
| Access Over Ownership Preference | +0.9% | Global, strongest in urban coastal areas | Long term (≥ 4 years) |
| AI-Driven Dynamic Pricing | +0.8% | Global, platform-dependent adoption | Short term (≤ 2 years) |
| Predictive Fleet Maintenance | +0.7% | North America, Europe, developed Asia-Pacific markets | Medium term (2-4 years) |
| Municipal Waterfront-Revitalisation Grants | +0.4% | North America, Europe, selected Asia-Pacific cities | Long term (≥ 4 years) |
| Source: Mordor Intelligence | |||
Growth in Coastal and Marine Tourism
International tourist arrivals climbed to 1.52 billion in 2025, strengthening demand for short-term charters and day cruises[1]. Mediterranean destinations benefit from long sailing seasons that improve fleet utilization, while Caribbean and Southeast Asian hubs capture winter overflow. Resort tie-ins now bundle skippered excursions with accommodation packages, elevating boat rentals from optional to core itinerary elements. Multi-hull craft post higher occupancy because families value stability, driving fleet managers to pivot toward catamarans. New marinas in emerging Asian markets are widening berth capacity and easing high-season congestion.
Proliferation of Online Peer-to-Peer Rental Platforms
The 2025 merger of two major platforms, Boatsetter and GetMyBoat, created a combined marketplace with annual bookings exceeding USD 500 million, establishing network effects and deepening supply pools[2]. Owners retain a majority of revenue, incentivizing fresh listings without capital deployment from operators. Embedded insurance partnerships remove a historic barrier, while in-app reviews raise transparency and trust. Younger renters, comfortable with app-based services, now represent over one-third of transactions. Still, platform economics hinge on density; hence, consolidation is accelerating to shore up local liquidity.
Millennial Preference for Access Over Ownership
Freedom Boat Club logged 640,000 member trips in 2025, underscoring sticky demand. Entry fees and monthly dues replace the down-payment and upkeep costs of ownership, matching cash-flow preferences of younger cohorts. Reciprocal access across hundreds of locations turns a local membership into a de facto timeshare network. The model also extends fleet lifespan because usage is distributed across vessels, lowering per-boat engine hours. As clubs enter Europe and Asia-Pacific, local partners supply berths and regulatory know-how.
AI-Driven Dynamic Pricing Boosts Boat Utilization
Larger aggregators deploy machine-learning models that read weather patterns, local events, and historical demand to recalibrate rates hourly, lifting occupancy during shoulder periods. Operators report improved yield as underpriced inventory is surfaced to bargain hunters, while premium windows capture surges during festivals. However, price opacity can erode goodwill if renters perceive volatility as unfair. Hybrid pricing caps are emerging to temper extreme swings and maintain customer trust.
Restraints Impact Analysis of Boat Rental Market*
| Restraint | (~) % Impact on CAGR Forecast | Geographic Relevance | Impact Timeline |
|---|---|---|---|
| Seasonal Demand Volatility | -1.2% | Global, most severe in temperate climates | Short term (≤ 2 years) |
| Stringent Emissions and Noise Regulations | -0.8% | Europe, California, selected Asia-Pacific markets | Medium term (2-4 years) |
| Rising Insurance Premiums | -0.6% | Global, concentrated in high-litigation jurisdictions | Short term (≤ 2 years) |
| Shortage of Qualified Crew | -0.3% | Global, acute in premium charter segments | Medium term (2-4 years) |
| Source: Mordor Intelligence | |||
Seasonal Demand Volatility
Operators in temperate zones see their revenues peak in summer, leading to months of idle fleets. Winter brings challenges: storage, maintenance, and fixed crew contracts all weigh heavily on cash flow. While some companies attempt to chase summer by repositioning vessels across hemispheres, transport logistics often eat into their margins. Though subscription dues provide a buffer, off-season usage still takes a hit, limiting potential gains.
Stringent Emissions and Noise Regulations
The International Maritime Organization targets a 40% reduction in carbon intensity by 2030, compelling retrofits or full-electric transitions[3]. The European Union’s Stage V rules likewise squeeze older diesel engines. Compliance capital is onerous for small owners, widening the gap between scaled fleets that secure green financing and independent fleets that risk obsolescence. Noise limits in marine sanctuaries also restrict operating hours, pruning high-season inventory.
*Our forecasts treat driver/restraint impacts as directional, not additive. The impact forecasts reflect baseline growth, mix effects, and variable interactions.
Boat Rental Market Segment Analysis
By Boat Type:
Catamarans Gain on Stability PremiumMotorboats, which captured 41.71% of the boat rental market share in 2025, continue to anchor entry-level demand due to their intuitive handling and versatile day-use appeal. Catamarans are projected to rise at an 8.27% CAGR, the fastest within this segmentation, as travelers prioritize spacious layouts and minimal heel. The segment’s comfort advantage resonates with multi-generational groups exploring island chains, bolstering booking frequency in Croatia, Greece, and the Caribbean. Yachts maintain a luxury niche supported by corporate retreats and special events, whereas sailing boats face a shrinking pool of licensed skippers. Inflatable RIBs round out capacity for dive transfers and quick coastal hops.
Operators are enlarging catamaran fleets despite higher acquisition costs, betting that premium daily rates and elevated occupancy offset capital outlays. Sailing boats struggle to regain momentum as younger demographics forego certification courses, prompting some charter firms to bundle optional skipper services. Motorboat electrification is fragmenting the category; early adopters of battery-powered runabouts tout zero-emission branding to secure eco-travelers. Yachts increasingly operate under crewed-charter models to bypass skill shortages, while RIB providers leverage low draft and fuel thrift to penetrate shallow-water adventure hotspots.

By Power Source:
Electric Propulsion AcceleratesInternal-combustion engines, which held 83.93% of the boat rental market share in 2025, remain entrenched due to their convenience for refueling and resilient resale values. Still, growth is plateauing as new orders tilt toward hybrid or electric. Full-electric vessels are forecast to post a 16.01% CAGR through 2031, buoyed by regulatory tailwinds and falling battery prices. Hydrofoil designs extend range by lifting hulls above drag, mitigating the range-anxiety barrier.
Hybrid configurations provide a bridge: electric for harbor maneuvering, diesel for extended cruises, and compliance with emission zones without sacrificing endurance. Scandinavia leads adoption thanks to grid incentives and a clean-energy ethos, while Mediterranean marinas lag amid infrastructure gaps. Battery-swap concepts remain theoretical because marine packs are larger than automotive equivalents. Nonetheless, major charter groups are placing multi-year orders for electric models, signaling confidence that charging networks will mature.
By Activity Type:
Watersports Propel Experiential DemandLeisure sailing and cruising accounted for 47.17% of the boat rental market share in 2025, reflecting their broad vacation appeal, yet watersports are projected to grow at a 7.48% CAGR as resorts bundle wakeboarding, diving, and tubing into packaged adventures. Fishing retains a loyal but aging customer base, while sightseeing cruises serve urban day-trippers seeking brief waterfront escapes. Millennials and Gen Z travelers gravitate toward shareable, adrenaline-fueled experiences, elevating demand for boats equipped with tow bars and dive platforms.
To optimize vessel usage, operators are blending activities, like pairing morning snorkeling with evening sunset sails, ensuring a full-day experience for travelers. In a bid to broaden their appeal, fishing charters are incorporating eco-tourism elements, such as dolphin-watching, to attract families and nature enthusiasts. Meanwhile, urban sightseeing is reaping rewards from city waterfront revitalizations, which have made dockage available for short excursions, enhancing accessibility for tourists and locals alike.
By Booking Channel:
Subscription Models Disrupt Aggregator DominanceOnline aggregators handled 57.45% of the boat rental market share in 2025, but subscription clubs are on track for a 10.73% CAGR as they monetize high-frequency usage. The club proposition removes per-trip friction, replacing it with predictable monthly fees and guaranteed availability ratios. Aggregator platforms court scale advantages, yet rising listing fees are prompting some owners to experiment with multi-channel strategies.
As clubs expand cross-border, reciprocal access transforms regional memberships into global assets, smoothing seasonal demand by enabling members to chase warm climates. Aggregators refine AI matching to retain one-stop convenience, while marinas digitize walk-in desks to reclaim share. The ecosystem is segmenting between high-touch club loyalty and price-elastic aggregator shoppers.
By Rental Duration:
Hourly Bookings Capture Urban Micro-MobilityFull-day rentals accounted for 41.71% of the boat rental market share in 2025. However, with the rise of contactless kiosks by city rivers and lakes, hourly bookings are set to surge at a projected CAGR of 9.24%. While shorter slots cater to spontaneous outings and align with broader micro-mobility trends, multi-day charters, sensitive to skipper shortages, are increasingly favored for vacation itineraries, offering flexibility for travelers.
To boost utilization during off-peak hours, operators are breaking down their inventory into half-day and hourly segments. Meanwhile, subscription clubs, offering unlimited-use privileges, present challenges for yield management but simultaneously foster deeper customer loyalty by enhancing user convenience. Urban municipalities are adopting kiosk models as low-impact activations, breathing life into waterfronts without the need for heavy infrastructure. This move hints at a promising future for ultrashort rentals, especially in urban areas.
Geography Analysis
Europe Boat Rental Market
Europe accounted for 39.43% of the boat rental market revenue in 2025, benefiting from dense marina networks across the Mediterranean and a sailing season that stretches over 8 months. Harmonized licensing frameworks and Stage V emission rules encourage fleet upgrades to hybrid and electric models, positioning the region at the forefront of sustainable charters. Northern Europe contributes inland and Baltic traffic, though shorter seasons temper volume relative to southern waters. Cross-border rental reciprocity within the European Union reduces administrative friction, allowing platforms to scale pan-regionally with uniform insurance and skipper standards.
APAC Boat Rental Market
Asia-Pacific is projected to record a 7.13% CAGR through 2031, the fastest globally. China’s coastal provinces are investing in marinas to serve a rising middle class, while Southeast Asian resorts package charters with diving and island tours. Regulatory complexity, such as restrictions on foreign-flagged vessels, persists, yet local joint ventures are easing entry barriers. Japan and South Korea exhibit nascent but growing interest, spurred by government leisure-boating promotions. Charging networks remain sparse, so electric adoption lags European levels, but policy signals suggest accelerating rollout over the medium term.
North America, LATAM and MEA Boat Rental Market
North America combines year-round demand in Florida and California with seasonal spikes in the Great Lakes and Pacific Northwest. Subscription clubs dominate penetration due to extensive marina footprints and favorable Coast Guard captain-licensing thresholds that simplify skippered offerings. Municipal waterfront-revitalization grants unlock urban dockage, fuelling hourly rental schemes that mirror bike-share programs. Insurance premiums for peer-to-peer transactions remain a headwind, yet embedded-coverage partnerships are gradually normalizing risk pricing. Latin America, the Middle East, and Africa represent longer-dated opportunities contingent on tourism infrastructure and macroeconomic stability.
Regulatory Landscape
Regulation for boat rentals blends vessel technical compliance, passenger-for-hire safety rules, and local licensing for commercial rental operations, creating a multi-jurisdictional burden for platforms and fleet operators. In Europe, the Recreational Craft Directive (RCD) 2013/53/EU anchors conformity for recreational craft placed on the market, and the European Commission issued the 3rd edition RCD Application Guide in 2026, with updates that include a greater emphasis on digital documentation and the treatment of major craft conversion.
National and sub-national authorities are also tightening operating requirements for rental and charter activity. The UK introduced the Merchant Shipping (Vessels in Commercial Use for Sport or Pleasure) Regulations 2025, while Cyprus enacted Law No. 4(I)/2026 for recreational navigation, covering operator licensing, charter obligations, and environmental protection. In the United States, safety and inspection expectations for passenger operations align with U.S. Coast Guard frameworks (including Subchapter M where applicable), and state livery statutes (for example, Florida Statute 327.54 in 2025) add permitting and equipment obligations that affect day-rental operators.
Value Chain Analysis
The boat rental value chain starts with vessel design and manufacturing (including propulsion systems and onboard electronics), then moves into distribution and fleet acquisition by operators, clubs, marinas, and individual owners listing via marketplaces. Upstream and midstream enablers include marina and berth infrastructure, maintenance and refit services, insurance underwriters and brokers, financing and leasing providers, and compliance services linked to safety, licensing, and emissions. Downstream, demand is captured through direct operator channels (marina desks, tour operators, resorts) and increasingly through digital intermediaries, including online aggregator platforms and subscription and club models.
Scale players are integrating across the chain to improve utilization, service consistency, and cost control, particularly in maintenance and operations. For example, Freedom Boat Club (Brunswick) has expanded corporate control of operations through franchise acquisitions that include dedicated maintenance capacity, supporting faster turnaround and standardized service levels across locations. On the distribution side, marketplace consolidation (such as the Boatsetter and GetMyBoat merger completed in late 2025) and partnerships that extend booking into larger consumer platforms (for example, Uber working with Click&Boat in Europe) strengthen demand aggregation, shift pricing power toward platforms with higher local liquidity, and increase the importance of embedded insurance and digital identity checks as core transaction infrastructure.
Competitive Landscape
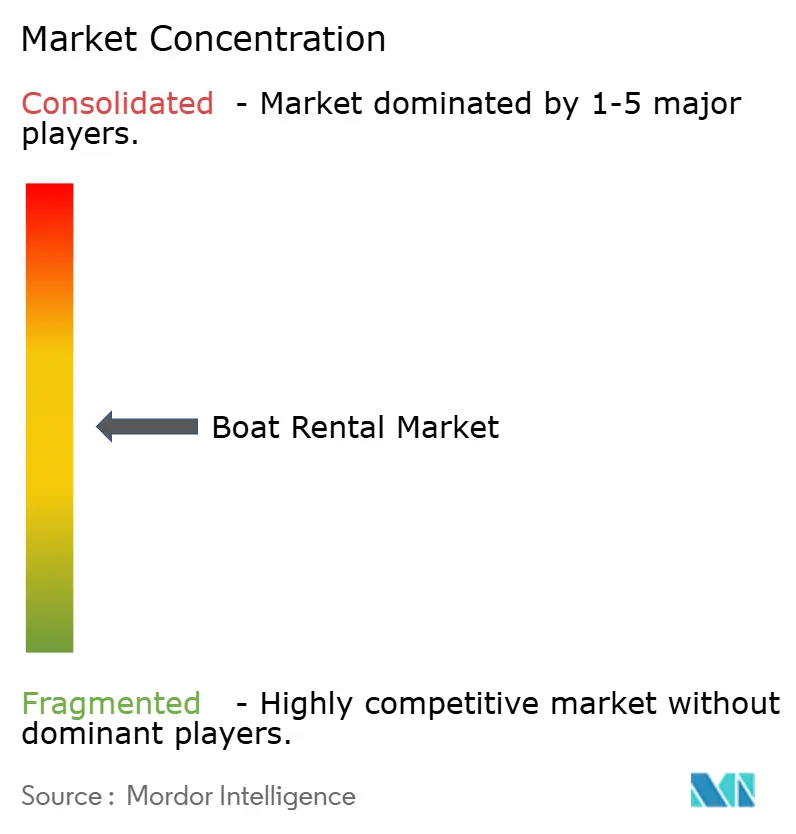
The boat rental market is moderately concentrated, with the five most prominent players accounting for a meaningful but non-dominant share of global bookings. The 2025 merger creating the largest peer-to-peer platform underscores a pivot toward scale economics in insurance, technology, and marketing. Subscription pioneer Freedom Boat Club demonstrates the power of recurring revenue in smoothing seasonality. Dream Yacht Charter leverages a large multi-hull fleet to address premium crewed demand, while European native Click&Boat accelerates AI investments following fresh venture funding.
Technology stands out as the competitive fulcrum. Aggregators wield dynamic-pricing engines that flex rates in real time, and fleet owners deploy telematics to slash downtime. Smaller entrants carve niches by focusing on underserved regions or specialized activities, such as fishing charters. Regulatory burdens around emissions and safety are erecting new barriers; thus, operators with capital for fleet renewal gain an edge. Overall, rivalry is shifting from sheer vessel count to data acumen, insurance innovation, and environmental compliance.
Strategic partnerships are multiplying as incumbents seek end-to-end control over the customer journey. Platform operators are integrating payment gateways, embedded insurance, and skipper-booking services into single-screen workflows, locking in users and raising switching costs. Vessel manufacturers are also entering joint ventures with rental companies to guarantee fleet refresh cycles and showcase new electric models to a steady stream of trial users. In parallel, marina owners are negotiating exclusivity deals that give specific platforms first-right access to docking during peak weekends. These cross-sector alliances signal that competitive advantage is migrating toward ecosystem orchestration rather than standalone scale.
Boat Rental Industry Leaders
-
GetMyBoat
-
Boatsetter Inc.
-
Click&Boat
-
SamBoat
-
Dream Yacht Worldwide
- *Disclaimer: Major Players sorted in no particular order
Boat Rental Market Companies Covered in this Report
- Boatsetter Inc.
- GetMyBoat
- ClickandBoat
- Nautal
- Sailo Inc.
- SamBoat
- Zizooboats GmbH
- Boat Jump
- Incrediblue
- Globe Sailor
- Yachtico Inc.
- Le Boat
- Dream Yacht Charter
- Freedom Boat Club
- Anchor Rides
- Adventure Boat Rentals
- Blue Boat Yacht Entertainment Co.
Market Opportunities and Future Outlook
Marina-side energy and charging infrastructure is a visible whitespace area for operators looking to expand electric and hybrid rental fleets in regulated or high-traffic coastal markets. In Europe, European Boating Industry (EBI) published a 2026 roadmap focused on alternative fuel infrastructure in marinas, and EBI also highlighted the EU Sustainable Transport Investment Plan that includes recreational craft within an EU transport investment strategy, with support cited through 2027. This policy and industry alignment creates a practical opening for rental operators, marinas, and OEMs to co-deploy charging and shore-power upgrades, reducing operational constraints for electric rentals and improving standardization at popular destinations.
Another opportunity is emerging at the intersection of travel ecosystems and rentals, where boat access can be expanded through large consumer platforms while operator software professionalizes fleet dispatch, safety workflows, and yield management. Recent moves such as Uber launching boat booking with Click&Boat across Mediterranean destinations show how non-marine platforms can route incremental demand to local supply without requiring fleet ownership, while reinforcing the role of digital booking, verification, and bundled services (skippers and insurance) as differentiators. In North America, industry reporting puts 2025 recreational marine spending at USD 54 billion, reinforcing the commercial incentive for rental and club operators to build higher-frequency offerings (hourly and subscription access) around urban waterfronts and established marina networks.
Recent Industry Developments in Boat Rental Market
- May 2026: Click&Boat partnered with Uber to launch boat rental services across more than 20 European destinations, with service rolling out from mid-June 2026 in Mediterranean markets including France, Spain, Italy, Portugal, and Croatia. The tie-up plugs boat rental inventory into a mass-market mobility app, expanding top-of-funnel demand and increasing the strategic value of platform-managed availability, pricing, and customer verification.
- December 2025: Boatsetter and GetMyBoat completed their merger, combining two large peer-to-peer marketplaces into a connected global platform while keeping headquarters operations in Miami. The consolidation increases supply and demand density for key geographies and strengthens platform leverage in insurance packaging, marketing efficiency, and multi-market liquidity.
- May 2024: GetMyBoat announced a strategic partnership with Visa to provide offers and benefits for Visa Platinum, Signature, and Infinite cardholders. The collaboration broadens customer acquisition through a payments ecosystem, supporting premium user targeting and potentially increasing conversion for higher-value rentals and experiences.
Boat Rental Market Report Scope and Research Methodology
Market Definition and Coverage
This market covers the revenue generated when boats are rented to customers for a limited time, whether it is self-drive or with a skipper, and booked through offline channels or online platforms. The sizing reflects rental activity across major coastal, lake, and marine tourism locations.
Scope exclusions: Boat sales, long term leasing that resembles ownership transfer, and standalone marina services (such as docking-only fees) are excluded from the market value.
Segments Covered in This Report
- By Boat Type
- Yacht
- Sailing Boat
- Catamaran
- Motorboat
- Inflatable / RIB
- By Power Source
- Internal Combustion Engine
- Hybrid
- Full-Electric
- By Activity Type
- Fishing
- Leisure Sailing / Cruising
- Watersports (towing, diving, etc.)
- Sight-seeing / Day-cruise
- By Booking Channel
- Online Aggregator Platforms
- Marina / Offline Desk
- Subscription and Club Models
- By Rental Duration
- Hourly
- Half-Day
- Full-Day
- Multi-Day / Weekly
- By Geography
- North America
- United States
- Canada
- Rest of North America
- South America
- Brazil
- Argentina
- Rest of South America
- Europe
- Germany
- United Kingdom
- France
- Italy
- Spain
- Greece
- Netherlands
- Denmark
- Rest of Europe
- Asia-Pacific
- China
- Japan
- India
- South Korea
- Rest of Asia-Pacific
- Middle East and Africa
- United Arab Emirates
- Saudi Arabia
- South Africa
- Rest of Middle East and Africa
- North America
Data Sources, Market Sizing, and Validation
Desk Research
Desk work starts with building a consistent demand and supply picture using public references that can be rechecked, such as tourism arrival statistics, coastal recreation releases, and marine safety datasets. For this market, we lean on sources such as UN tourism publications, World Bank macro indicators, national tourism boards, US Coast Guard recreational boating safety summaries, and Eurostat travel and tourism statistics to keep assumptions grounded.
Next, we connect those indicators to the business side using materials such as company filings, investor presentations, marina and charter association websites, and reputed press coverage of booking behavior and seasonality. Where needed, paid subscriptions for company financials and news intelligence, import and export shipment-level checks on relevant boat categories, and patent databases for electrification and propulsion trends are used only to sharpen inputs, not to replace public signals. The sources listed here are illustrative, and many other public and commercial references were also used for data collection, validation, and clarification.
Primary Interviews and Surveys
Primary work was used to validate rental price bands, utilization patterns, and the share of bookings that flow through platforms versus direct operators, which often varies by location and season. We spoke with a mix of fleet operators, marina-side rental managers, booking intermediaries, and ecosystem experts across APAC, EMEA, and the Americas, and then cross-checked differences to tighten key assumptions and remove outliers.
Distribution of primary research fieldwork respondents
| Company type | Respondent position | Region |
|---|---|---|
| Top tier: 32% | CXOs: 15% | APAC: 42% |
| Mid tier: 52% | Functional/Unit leaders: 41% | EMEA: 32% |
| Smaller Players: 16% | Managers: 44% | Americas: 26% |
Market-Sizing & Forecasting
The core model uses a top-down approach where travel and leisure activity indicators are converted into a realistic rental demand pool by location, and then expanded using penetration and spend per trip logic. Results are corroborated with selective bottom-up approximations, such as sampled daily and weekly rental rates multiplied by expected active rental days, plus channel checks on commission structures, and then totals are adjusted when the two views drift too far.
Key inputs are kept simple and repeatable, including season length by region, fleet utilization (days rented per boat), average rental duration, typical price per hour or per day by boat class, and the share of rentals with skipper or crew that lifts average tickets. When data is thin for smaller lakeside locations, gaps are handled by using comparable tourism intensity and marina density as proxies, followed by interview-based sanity checks. Forecasts are built using scenario analysis supported by trend signals on tourism recovery, disposable income, digital booking adoption, and electrified boat availability, with assumptions reviewed again before finalizing the forward curve.
Data Validation & Update Cycle
Validation is done by comparing modeled revenue against independent signals like tourism nights, marina berth capacity direction, and observed rental price movement, which helps us spot unrealistic jumps early. If a region shows unusual shifts in utilization or pricing, the assumptions are rechecked, and targeted follow-ups are triggered with industry respondents to confirm what changed.
Before sign-off, the work goes through multi-step analyst reviews where calculation logic, currency conversion timing, and year alignment are checked so the story matches the numbers. Reports are refreshed annually, and interim updates are made when material events occur, such as demand shocks in tourism corridors or rule changes that affect boating access. Right before delivery, a final refresh pass is completed so the market view reflects the latest available signals.
Mordor Intelligence's Boat Rental Market Size Versus Other Published Estimates
Published market sizes for boat rental do not always line up because authors can count different revenue streams and can anchor the model on different base years, which changes the starting point. Differences also show up when one study assumes a faster normalization of tourism demand, or when currency timing and price inflation are handled differently.
By tracking utilization days, average rental rate bands, and channel mix updates through year-end checks, Mordor Intelligence keeps the boat rental total focused on paid rental transactions rather than nearby marine services that can inflate the number. Some estimates also push aggressive growth by extending peak-season pricing across more months, while others undercount smaller operators by leaning too heavily on platform visibility, which is not uniform across regions.
Benchmark comparison
| Source | Market Size | Gaps in Research Methodology |
|---|---|---|
| Mordor Intelligence | USD 18.41 B (2025) | |
| Global Consultancy A | USD 20.76 B (2024) | Uses an earlier base year and appears to apply broader commercial leasing language, which can pull in adjacent charter-like services and raise the starting value when compared to a rental-only transaction lens. |
| Industry Publisher B | USD 25.52 B (2026) | Starts from a later year that already reflects higher pricing, and the higher 2026 level can also result from stronger assumptions on post-pandemic tourism normalization and peak-season pricing carryover. |
The spread in values is mostly explained by what is counted as rental revenue, the year chosen to anchor the series, and how pricing and seasonality are applied across regions. Our approach stays traceable to a small set of measurable drivers, which makes it easier for buyers to understand what moved and to re-run the logic when conditions change.
Key Questions Answered in the Report
How large will the boat rental market be by 2031?
It is valued at USD 19.46 billion in 2026 and is projected to grow to USD 25.65 billion by 2031, with a 5.68% CAGR from 2026 to 2031.
Which boat type is growing the fastest?
Catamarans, aided by an 8.27% CAGR that reflects demand for stability and space.
What region is expected to lead growth?
Asia-Pacific, forecast to expand at a 7.13% CAGR as new marinas and resort partnerships proliferate.
Why are subscription clubs gaining popularity?
They replace ownership costs with predictable fees and guarantee access, driving high renewal rates.
How are emissions rules affecting fleet strategy?
Operators are ordering hybrid and electric models to comply with IMO and EU mandates, especially in Europe.