
Blue Hydrogen Market Size and Share
Market Overview
| Study Period | 2021 - 2031 |
|---|---|
| Market Volume (2026) | 0.81 Million tons |
| Market Volume (2031) | 7.89 Million tons |
| Growth Rate (2026 - 2031) | 57.64 % |
| Fastest Growing Market | Asia Pacific |
| Largest Market | Asia Pacific |
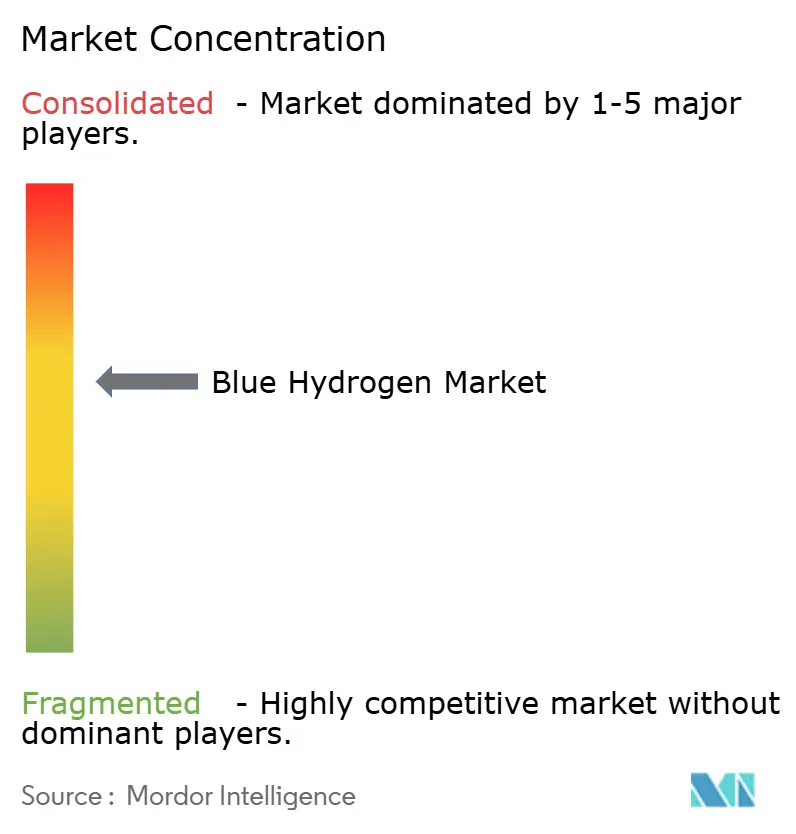
| Market Concentration | Medium |
Major Players *Disclaimer: Major Players sorted in no particular order Image © Mordor Intelligence. Reuse requires attribution under CC BY 4.0. | |
Blue Hydrogen Market Analysis by Mordor Intelligence
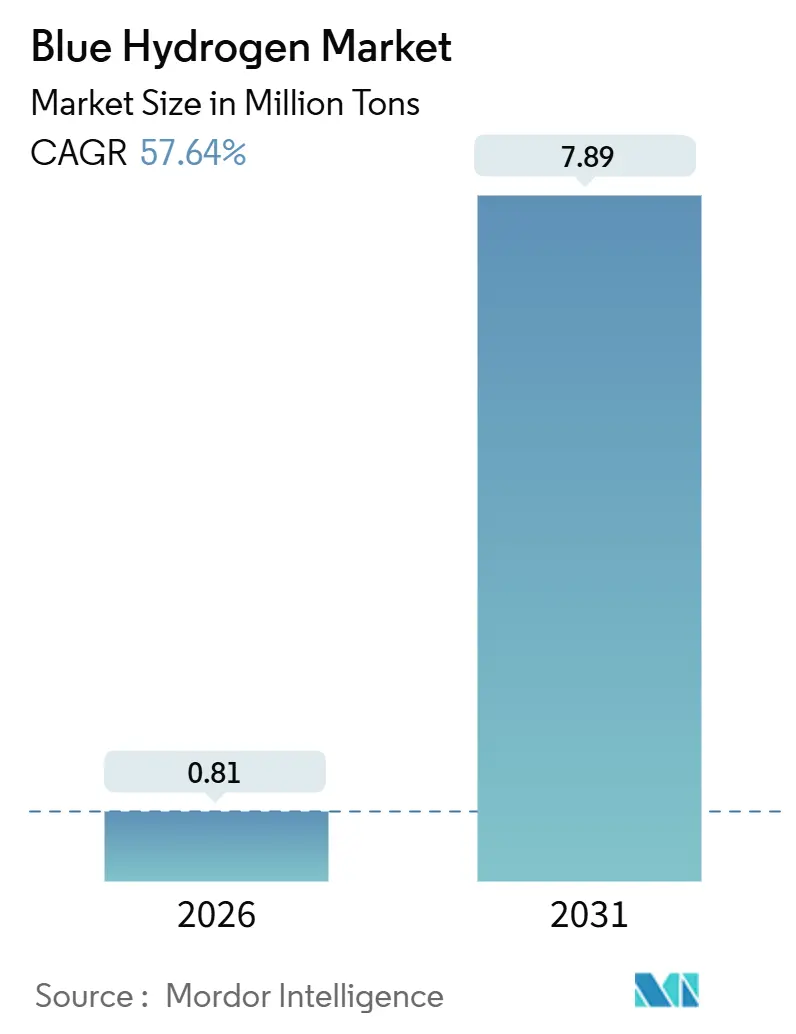
The Blue Hydrogen Market size is estimated at 0.81 Million tons in 2026, and is expected to reach 7.89 Million tons by 2031, at a CAGR of 57.64% during the forecast period (2026-2031). The narrowing cost gap with grey hydrogen, accelerated by the United States’ IRA 45V tax credit and the European Union’s RFNBO mandate, is the central force behind this growth. Developers are prioritizing autothermal-reforming (ATR) plants with carbon capture because their 95-plus % capture rates qualify for the most lucrative subsidies, while shared CCS hubs in the US Gulf Coast, the North Sea, and Alberta are trimming project capital outlays by 25-35%. Regional momentum is strongest in Asia-Pacific, where blue-ammonia back-haul corridors from Saudi Arabia and Australia to Japan and South Korea create long-term offtake visibility. Heavy-duty trucking and maritime bunkering trials in California, Rotterdam, and Singapore move transportation from the demonstration phase to commercial scale, signaling a clear policy-driven demand pivot.
Key Report Takeaways
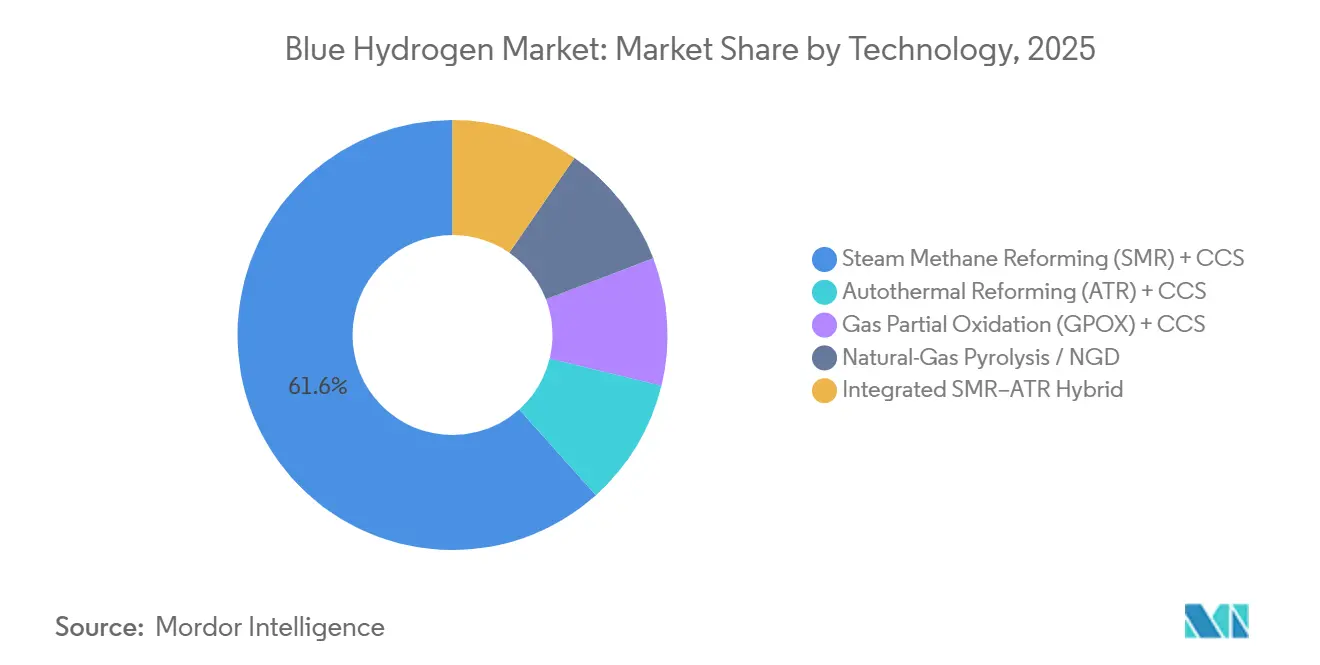
- By technology, Steam Methane Reforming (SMR) + CCS held 61.62% of the blue hydrogen market share in 2025, while Autothermal Reforming (ATR) + CCS is poised to grow at a 62.25% CAGR through 2031.
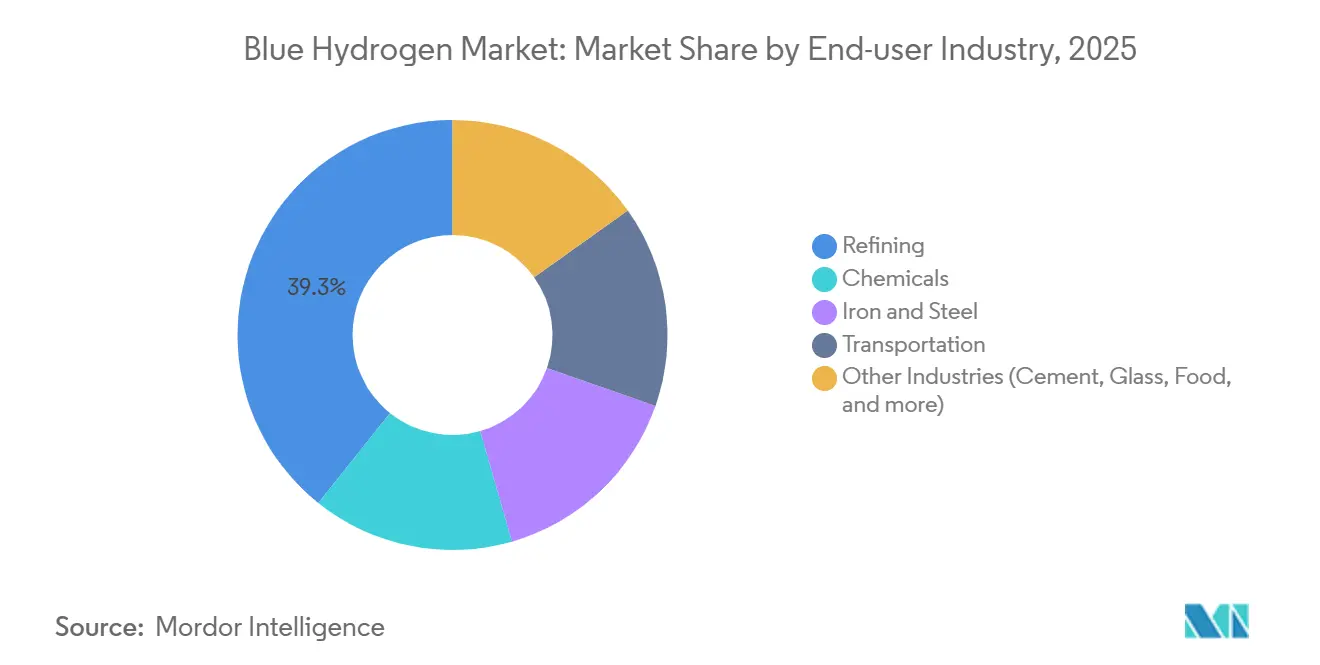
- By end-user industry, the refining sector led with 39.27% revenue share in 2025; transportation is projected to post the fastest 58.06% CAGR to 2031.
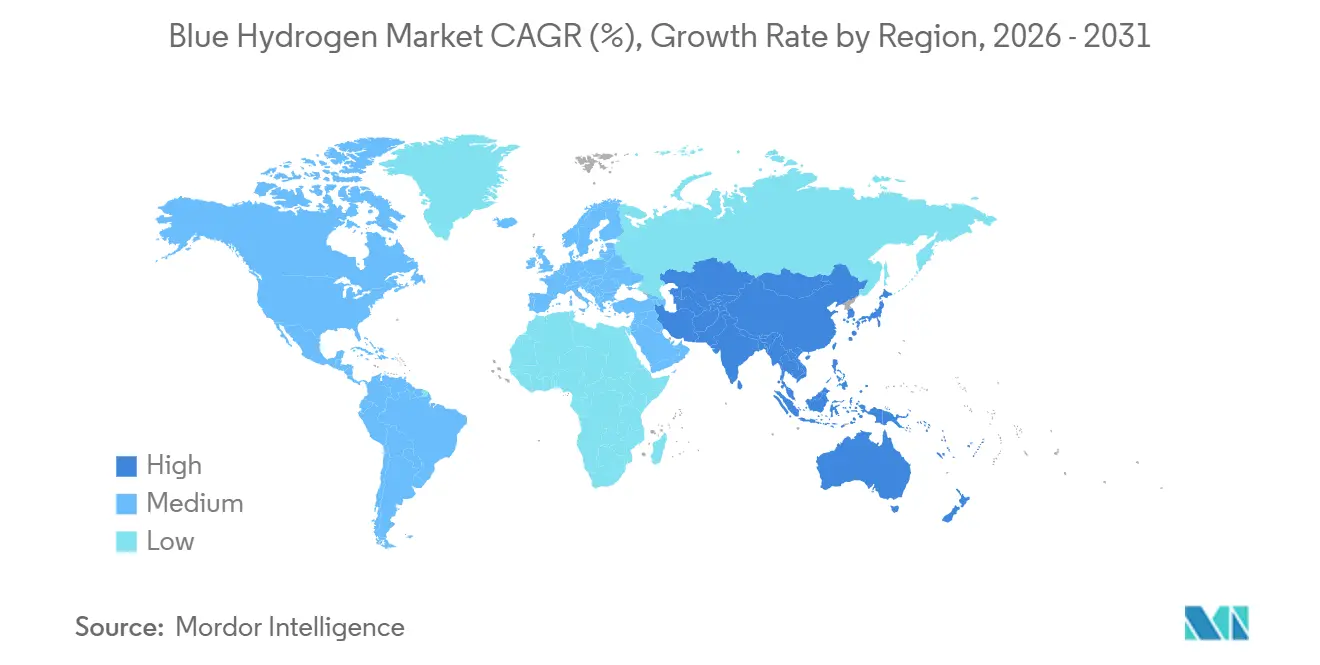
- By geography, Asia-Pacific accounted for 38.24% of the blue hydrogen market size in 2025 and is advancing at a 59.42% CAGR between 2026 and 2031.
Note: Market size and forecast figures in this report are generated using Mordor Intelligence’s proprietary estimation framework, updated with the latest available data and insights as of January 2026.
Market Trends and Insights
Drivers Impact Analysis of Blue Hydrogen Market*
| Driver | (~) % Impact on CAGR Forecast | Geographic Relevance | Impact Timeline |
|---|---|---|---|
| Fuel-cell electric-vehicle adoption | +11.2% | North America, Europe, Japan, South Korea | Medium term (2-4 years) |
| Blue-ammonia export corridors | +11.8% | Asia-Pacific core, spillover to Middle East | Long term (≥ 4 years) |
| Low-carbon chemical feedstocks | +11.5% | Global, concentrated in Asia-Pacific and North America | Medium term (2-4 years) |
| IRA 45V and EU RFNBO incentives | +12.1% | North America and Europe | Short term (≤ 2 years) |
| Rapid CCS-hub build-out | +11.3% | North America, Europe, Middle East | Medium term (2-4 years) |
| Source: Mordor Intelligence | |||
Surging Application in Fuel-Cell Electric Vehicles
Heavy-duty trucking is moving beyond pilots. Nikola delivered 72 Class 8 fuel-cell trucks in 1H 2025, and Hyundai committed to 1,600 XCIENT units across California and Switzerland by 2027. California’s Low Carbon Fuel Standard credits give blue hydrogen with 90% capture a competitive total cost of ownership, and early fleet operators lock in multi-year supply contracts. Maritime interest is rising as Maersk and TotalEnergies complete bunkering trials in Rotterdam, aiming for 2028 route commercialization. These adopters value immediate emissions compliance without waiting for renewable overbuild, pushing the blue hydrogen market toward transportation inflection.
Growing Blue-Ammonia Back-Haul Corridors in Asia
A first shipment of 40 tons of blue ammonia from Saudi Aramco to JERA in 2024 proved the commercial case for long-distance hydrogen carriage in ammonia form. South Korea’s POSCO earmarked USD 1.2 billion in 2025 for cracking facilities targeting 200,000 tons of hydrogen by 2028. Middle-Eastern producers deliver blue hydrogen at USD 1.20 kg and sell into Northeast Asia near USD 2.50 kg, a 40% price advantage over domestic green supply. The corridor satisfies Japan and South Korea’s 2030 hydrogen targets despite renewable-land constraints, embedding long-term trade lanes in the blue hydrogen market.
Rising Demand from Chemical Feedstocks (Ammonia, Methanol)
BASF’s Ludwigshafen site began taking blue hydrogen from Air Liquide’s Normandy plant in 2025, cutting ammonia-unit emissions 65% and qualifying for EU Green Deal tenders. OCI Global’s Texas methanol complex followed in 2024 to tap California’s renewable-fuel premium. Capturing 1 million tons of CO₂ secures USD 50-80 million annually in EU ETS allowances or IRA 45Q credits, offsetting 40-60% of CCS capex. Blue variants therefore meet certification thresholds for low-carbon fertilizers and marine fuels, underpinning multi-year supply agreements.
IRA 45V and EU RFNBO Incentives Compress Levelized Cost
The IRA offers USD 0.60 kg for blue hydrogen under the 2.5-kg CO₂-eq threshold, slicing U.S. Gulf Coast costs from USD 2.00 kg to USD 1.40 kg[1]. Europe’s RFNBO rule compels 42% low-carbon hydrogen in industry by 2030, guaranteeing local demand. ExxonMobil sanctioned the 1-bcf/d Baytown project in 2025 at a 12% IRR thanks to 45V inflows. Conversely, most Asian markets lack equivalent subsidies, limiting domestic offtake and reinforcing the region’s export orientation.
Restraints Impact Analysis of Blue Hydrogen Market*
| Restraint | (~) % Impact on CAGR Forecast | Geographic Relevance | Impact Timeline |
|---|---|---|---|
| High production cost versus grey hydrogen | -6.4% | Global, most acute in Asia-Pacific and South America | Short term (≤ 2 years) |
| Energy-intensity and efficiency losses | -4.8% | Global | Medium term (2-4 years) |
| Methane-slip measurement and certification | -3.6% | Europe, North America | Short term (≤ 2 years) |
| Source: Mordor Intelligence | |||
High Production Cost vs. Grey Hydrogen
Unsubsidized blue hydrogen ranges USD 1.80-2.50 kg versus USD 1.00-1.30 kg for grey in gas-rich regions, sustaining a 40-90% premium. EU carbon prices above EUR 80 t narrow the gap to 10-20%, but Asian buyers remain price-sensitive. SMR-CCS capex of USD 2.5-3.0 kg yr capacity is double conventional SMR, mainly from capture equipment. Small industrial users cannot amortize these costs, limiting early adoption to refineries, ammonia, and steel complexes and slowing penetration of the blue hydrogen market.
Energy-Intensity and Efficiency Losses
CCS lowers plant efficiency to 65-72%, pushing feedstock use 15% higher than grey hydrogen. ATR recovers some efficiency at 68-74% but needs oxygen plants that add USD 0.20-0.30 kg to capital costs. High European gas prices lift feedstock cost to USD 2.10 kg before capture, squeezing margins, while emerging pyrolysis remains pilot-scale until 2029. The efficiency drag confines blue hydrogen’s role in peaking power, favoring long-duration storage niches instead.
*Our forecasts treat driver/restraint impacts as directional, not additive. The impact forecasts reflect baseline growth, mix effects, and variable interactions.
Blue Hydrogen Market Segment Analysis
By Technology:
ATR Gains on Capture-Rate SuperioritySteam-methane reforming with CCS retains the bulk 61.62% share in 2025 because refineries can retrofit existing reformers at 40-50% lower capital cost than greenfield ATR. Gas partial oxidation remains confined to petrochemical sites needing high-CO heat, while natural-gas pyrolysis is pre-commercial. Linde’s planned hybrid SMR-ATR plant in Texas signals a pragmatic middle ground, balancing capture efficiency and cost. Autothermal reforming with CCS is on track for a 62.25% CAGR, the quickest among production pathways. ATR achieves 95-98% CO₂ capture by combining oxygen-blown partial oxidation with high-pressure reforming, producing a near-pure CO₂ stream that slashes solvent-regeneration energy. Air Products’ USD 7 billion Louisiana complex will use ATR to deliver 750,000 t yr hydrogen and sequester 5 million t CO₂, targeting Tier 4 IRA credits[2].
Project economics increasingly hinge on subsidy structures. Where maximum carbon credits are available, ATR dominates; where brownfield integration advantages count more, SMR retrofits prevail. Technology licensors are locked in a competitive race, Topsoe captured eight ATR awards in 2025 thanks to modular SynCOR units that cut construction time 30%, while Johnson Matthey recorded three for its LCH, underscoring a technology shake-out that will reshape the blue hydrogen market.

By End-User Industry:
Transportation Outpaces Refining GrowthTransportation is set for a 58.06% CAGR through 2031, making it the fastest-expanding consumer cluster even as refining retains 39.27% of 2025 demand. California’s Advanced Clean Fleets rule drives the conversion of drayage fleets serving Los Angeles and Long Beach ports, creating a secured pull for 120,000-150,000 t yr of hydrogen. Maritime interest compounds growth: the Port of Rotterdam intends to handle 20% low-carbon fuels by 2030, a target underpinned by early blue-hydrogen bunkering trials. In contrast, refining demand scales linearly with renewable-diesel capacity, keeping the segment’s volume steady but growth modest.
Chemicals absorb 25-30% of demand, mainly ammonia that feeds fertilizers and shipping fuel. Yara’s Sluiskil plant switched to blue hydrogen in 2025, cutting product carbon intensity by 60%. Steel is emerging with pilot direct-reduced-iron lines in Germany and Sweden, consuming 8,000-10,000 t of hydrogen annually and showing 75% emissions abatement. Other industrial uses remain marginal until process-equipment retrofits mature. The diverging trajectories confirm that policy-aligned transport applications will be the principal upside lever for the blue hydrogen market through 2031.
Geography Analysis
APAC Blue Hydrogen Market
Asia-Pacific commanded 38.24% of the 2025 blue hydrogen market and is forecast to grow 59.42% CAGR, the strongest regional pace. China commissioned three Inner Mongolia and Shaanxi facilities totaling 180,000 t yr hydrogen in 2025 and paired them with 1.2 million t yr CO₂ sequestration. South Korea’s first commercial cracking terminals come online in 2026, positioning Busan and Gwangyang as regional import hubs. Japan’s updated hydrogen strategy targets 3 million t yr imports by 2030, 60% from blue ammonia, using legacy LNG terminals for offloading. India pilots blue hydrogen at Mathura but awaits a national carbon price before scaling beyond 2028. Competitive delivered-cost baselines of USD 1.20-1.50 kg, plus ample CCS geology, anchor Asia-Pacific’s cost leadership even as certification lags restrict export access to European RFNBO markets.
North America Blue Hydrogen Market
North America leverages IRA 45V credits to secure most of the regional capacity within the United States. ExxonMobil’s Baytown and Air Products’ Louisiana projects together add 1.5 million t yr by 2028. Canada’s Edmonton region hosts four operating facilities and plans to triple output by 2030 through the Pathways Alliance, capitalizing on proven saline aquifer storage. Mexico’s participation is exploratory only. Post-2032 sunset clauses for 45V create long-term policy risk that could strand 40-50% of un-sanctioned plans, making subsidy durability the critical variable.
EMEA and South America Blue Hydrogen Market
Europe presents a mixed picture. RFNBO mandates guarantee demand, yet high gas prices and methane-certification delays slow new FIDs. Germany’s EUR 3 billion fund backed only Linde’s Leuna and Uniper’s Wilhelmshaven projects to date. United Kingdom clusters HyNet and East Coast supply 80,000 t yr hydrogen under GBP 1.50 kg contracts-for-difference, but broader uptake hinges on resolving liability for CO₂ storage. France and Italy focus on green hydrogen, leaving blue to refinery retrofits. Middle East-Africa and South America are early-stage exporters: Saudi Aramco’s Jafurah rises to 1.5 million t yr blue ammonia by 2025, while Petrobras pilots CCS-enabled hydrogen in Brazil, both targeting premium Northeast Asian demand.
Value Chain Analysis
The blue hydrogen value chain begins with natural gas supply and conditioning (including sulfur removal), followed by hydrogen generation through SMR or oxygen-blown ATR. In many designs, oxygen and nitrogen supply from air separation units (ASUs) is a key input, alongside the integration choices that determine how well the plant can capture and condition CO2.
In integrated projects, the production block is linked with CO2 capture, compression, and dehydration, then routed to transport and storage via shared CCS hubs or dedicated pipelines, with utilization pathways where relevant. Downstream, distribution often relies on captive or near-site supply for refineries and chemical complexes, while international trade frequently shifts toward ammonia for shipping and subsequent cracking in import markets. Measurement, reporting, and verification (MRV) is increasingly treated as part of the value chain: ISO 19870-1:2026 provides a common framework for GHG emission-intensity calculation, and third-party schemes such as TUV Rheinland H2.21 are used to validate captured CO2 handling for CCS/CCU-linked pathways. This certification layer affects contracting and bankability by tying product qualification to capture performance and auditable lifecycle accounting across geographies, which in turn influences how hydrogen projects are financed and operated.
Competitive Landscape
The Blue Hydrogen market is moderately consolidated. White-space opportunities lie in mid-scale plants (30-80 kt yr) serving regional chemical clusters. Engineering contractors such as Technip Energies aim to fill this gap with modular ATR-CCS packages. Disruptive entrants pursue methane pyrolysis; BASF and Monolith bet on premium carbon-black sales above USD 800 t to co-fund hydrogen output, though market depth is uncertain. The looming decline in electrolyzer capex could squeeze blue hydrogen’s cost cushion to under USD 0.30 kg by 2030 in renewable-rich regions, intensifying competitive pressure and making early asset monetization critical.
Blue Hydrogen Industry Leaders
-
Air Liquide
-
Air Products and Chemicals, Inc.
-
Linde PLC
-
Shell plc
-
BP p.l.c.
- *Disclaimer: Major Players sorted in no particular order
Blue Hydrogen Market Companies Covered in this Report
- Air Liquide
- Air Products and Chemicals, Inc.
- ATCO Ltd.
- BP p.l.c.
- CERTIFHY CONSORTIUM.
- Cummins Inc.
- Equinor ASA
- Exxon Mobil Corporation
- Johnson Matthey
- Linde PLC
- Plug Power Inc.
- Reliance Industries Limited
- SABIC
- Saudi Arabian Oil Co.
- Shell plc
- Siemens Energy
- Suncor Energy Inc.
- Technip Energies N.V.
- Topsoe A/S
- TotalEnergies
- Uniper SE
- Xebec Adsorption Inc.
Market Opportunities and Future Outlook
The main opportunities cluster where blue hydrogen can plug into existing industrial-gas networks and high-purity on-site supply models. Air Liquide's July 2026 investment of over USD 160 million in Arizona to expand industrial gas supply for advanced semiconductor manufacturing points to demand pull from energy-intensive, high-specification production ecosystems, where hydrogen and syngas infrastructure can support decarbonization targets alongside broader industrial gas systems.
White-space also shows up in mid-scale plants (30-80 kt/yr) serving clustered chemical and refining demand, particularly where modular ATR-CCS packages and shared CO2 transport and storage lower the threshold for final investment decisions. A second opportunity set is tied to ammonia-based corridors and the enabling infrastructure around them. Linde's June 2025 long-term agreement and about USD 400 million investment to supply oxygen and nitrogen to a world-scale low-carbon ammonia facility in Louisiana indicates that blue-hydrogen value creation is expanding beyond the reformer to include dedicated ASUs and integrated site utilities. Standardization and policy mechanics can also shorten execution timelines: ISO 19870-1:2026 supports more consistent cross-border emissions accounting, and the 45V timeline constraint (construction start required by January 1, 2028, under the 2025 OBBBA) pulls forward development schedules, which tends to benefit developers that can secure CO2 storage access, equipment slots, and credible MRV inputs earlier.
Recent Industry Developments in Blue Hydrogen Market
- July 2026: Air Products announced the cancellation of the Louisiana Clean Energy Complex, a project previously planned to produce 1,700 metric tons of blue hydrogen per day. The decision reduces near-term capital outlays and redirects attention toward hydrogen and CCS initiatives with higher returns, which can free up resources for other regional decarbonization efforts.
- July 2026: Air Liquide announced a new 160 million USD project in Arizona for production related to semiconductor support, with associated gas infrastructure. The expansion reinforces regional supply chains for semiconductor manufacturing and broadens Air Liquide's North American gas-infrastructure footprint.
- December 2025: Air Products announced advanced negotiations with Yara for potential partnership on low-emission ammonia projects, targeting final investment decisions by mid-2026. The talks could accelerate low-emission ammonia deployment and strengthen cross-sector links between fertilizer demand and hydrogen supply.
Blue Hydrogen Market Report Scope and Research Methodology
Market Definition and Coverage
For this methodology, the blue hydrogen market covers hydrogen produced mainly from natural gas or coal where most process CO2 is captured and then stored or used, and the market is measured as production volume delivered for end use.
Scope exclusions: We exclude green hydrogen and gray hydrogen volumes, and we also exclude revenue from carbon capture services that is not reflected in blue hydrogen output.
Segments Covered in This Report
- By Technology
- Steam Methane Reforming (SMR) + CCS
- Autothermal Reforming (ATR) + CCS
- Gas Partial Oxidation (GPOX) + CCS
- Natural-Gas Pyrolysis / NGD
- Integrated SMR–ATR Hybrid
- By End-user Industry
- Refining
- Chemicals
- Iron and Steel
- Transportation
- Other Industries (Cement, Glass, Food, and more)
- Geography
- Asia-Pacific
- China
- India
- Japan
- South Korea
- Rest of Asia-Pacific
- North America
- United States
- Canada
- Mexico
- Europe
- Germany
- United Kingdom
- France
- Italy
- Rest of Europe
- South America
- Brazil
- Argentina
- Rest of South America
- Middle-East and Africa
- Saudi Arabia
- South Africa
- Rest of Middle-East and Africa
- Asia-Pacific
Data Sources, Market Sizing, and Validation
Desk Research
Desk research was used to set clear boundaries and to build an initial supply and demand picture before any assumptions were finalized. We referred to public sources such as the International Energy Agency, the US Energy Information Administration, the US Geological Survey, and the World Bank for energy balances, fuel price direction, and country level industrial indicators that shape hydrogen demand.
To avoid over relying on announcements, the model was also checked against government and standards bodies where policy and definitions are stated, such as the US Department of Energy, the European Commission publications, and UN Comtrade where relevant for trade signals around ammonia and industrial gases. Along with these, we used company annual reports, investor presentations, association websites, and reputable press releases to track project timing, carbon capture linkage, and offtake visibility. In a few cases, paid subscriptions for company financials and patent databases were used to confirm ownership, project maturity, and technology orientation. These sources are illustrative only, and many other public and proprietary references were used for collection, cross-checking, and clarification.
Primary Interviews and Surveys
Primary work focused on validating what is actually buildable and sellable in the forecast window, since blue hydrogen is strongly shaped by permitting, capture performance, and contracts. We spoke with a mix of producers, engineering and project stakeholders, large industrial buyers, and logistics and storage ecosystem participants across the major producing and importing regions so that utilization, pricing logic, and start-up timing could be stress-tested before finalizing totals.
Distribution of primary research fieldwork respondents
| Company type | Respondent position | Region |
|---|---|---|
| Top tier: 28% | CXOs: 12% | APAC: 43% |
| Mid tier: 50% | Functional/Unit leaders: 32% | EMEA: 34% |
| Smaller Players: 22% | Managers: 56% | Americas: 23% |
Market-Sizing & Forecasting
Sizing was built using a top-down approach where planned and operating hydrogen and carbon capture capacity, typical load factors, and expected commissioning schedules are reconstructed into annual blue hydrogen output for each geography, and then rolled up to the global total. To keep the estimate grounded, we corroborated the result with selective bottom-up checks such as sampled project level capacity additions, channel discussions on offtake readiness, and implied output based on end-use demand signals.
Key inputs included announced and permitted blue hydrogen capacity, carbon capture rate assumptions (since capture performance affects what qualifies as blue), natural gas price direction by region, and expected utilization ramps after start-up. End-use readiness was tracked through indicators like refining and ammonia related demand pull, industrial cluster build-outs, and storage and pipeline availability, which then informed the probability weighting for projects that are earlier stage. Forecasts were produced using scenario analysis, where policy and incentive cases, fuel price ranges, and start-up delays were varied, and then aligned to the most consistent view from expert feedback. Where project data was incomplete, we filled gaps using benchmark unit yields and regional utilization averages, and then re-validated these with interview learnings before locking the model.
Data Validation & Update Cycle
Outputs were validated through triangulation across independent signals, including capacity announcements, permitting and financing milestones, and the implied demand pool from major industrial consumers. Variance checks were run at country and regional levels so that sudden jumps were questioned, and outliers were traced back to a small set of drivers such as utilization, capture rate, or timing.
A multi-step review was followed, where an analyst reviews assumptions, another analyst checks math and consistency, and a final pass is done before sign-off so the storyline matches the numbers. Reports are refreshed annually, and interim updates are made when there are material changes such as major policy shifts, project cancellations, or large new final investment decisions. Before delivery, we do a fresh scan to ensure the latest public developments are reflected in the final view shared with clients.
Mordor Intelligence's Blue Hydrogen Market Size Compared Against Other Published Estimates
Published market estimates for blue hydrogen often look far apart because the unit of measure, the boundary around what counts as blue hydrogen, and the assumed ramp-up speed for new plants can change from one study to another. Differences also come from how pricing is treated, since some sources present value terms while others focus on production output.
A practical gap driver is refresh cadence and currency timing, since project start dates and revised cost curves can shift within months and change implied average price assumptions, which is why we run a scheduled refresh and re-check the key commissioning and utilization inputs before publishing figures at Mordor Intelligence.
Benchmark comparison
| Source | Market Size | Gaps in Research Methodology |
|---|---|---|
| Mordor Intelligence | USD 0.81 M (2026) | |
| Industry Publisher A | USD 2.30 B (2024) | Uses a revenue-based framing and an earlier estimate year, so pricing and currency assumptions drive the total more than production output, and the build-out timeline may not be re-weighted for start-up delays. |
| Market Tracker B | USD 4.20 B (2025) | Appears to aggregate broader value-chain and distribution elements into a single market value and applies a smoother growth curve, which can overstate near-term scale in a project-led supply market. |
The table shows that the spread is largely explained by unit choice and what gets counted around pricing and adjacent services, rather than a simple difference in growth expectations. By keeping the steps tied to capacity, utilization, and commissioning timing, and then checking them against buyer readiness signals, our estimate stays traceable and easier to replicate when new project updates occur.
Key Questions Answered in the Report
How large is the blue hydrogen market in 2026 and how fast will it grow?
How large is the blue hydrogen market in 2026 and how fast will it grow?
Which region is growing the fastest in blue hydrogen demand?
Asia-Pacific leads with a 59.42% CAGR through 2031, underpinned by Japan and South Korea’s import programs and China’s coal-with-CCS projects.
What technology will dominate future blue hydrogen projects?
Autothermal reforming with CCS is scaling the quickest thanks to 95-plus % capture rates that unlock the highest policy incentives.
Why is transportation the fastest-growing end-user segment?
Heavy-duty fuel-cell trucks and maritime bunkering receive strong regulatory support, driving a 58.06% CAGR for transport demand.
How do IRA 45V tax credits affect project economics?
The credit can lower U.S. Gulf Coast production costs from USD 2.00 kg to roughly USD 1.40 kg, converting marginal projects into bankable investments.