
Blowers Market Size and Share
Market Overview
| Study Period | 2021 - 2031 |
|---|---|
| Market Size (2026) | USD 9.09 Billion |
| Market Size (2031) | USD 11.39 Billion |
| Growth Rate (2026 - 2031) | 4.62 % |
| Fastest Growing Market | Asia-Pacific |
| Largest Market | Asia-Pacific |
| Market Concentration | Medium |
Major Players *Disclaimer: Major Players sorted in no particular order Image © Mordor Intelligence. Reuse requires attribution under CC BY 4.0. | |
Blowers Market Analysis by Mordor Intelligence
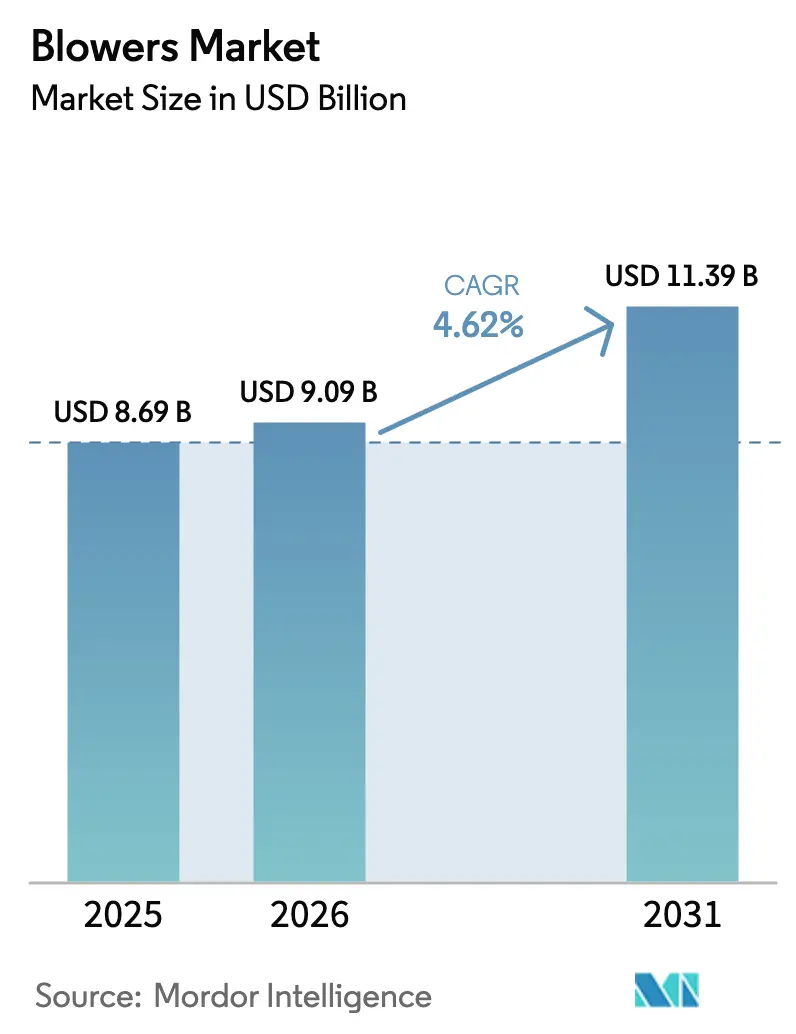
The Blowers Market size is expected to grow from USD 8.69 billion in 2025 to USD 9.09 billion in 2026 and is forecast to reach USD 11.39 billion by 2031 at 4.62% CAGR over 2026-2031.
Growing wastewater-treatment capacity additions, tougher industrial emission standards, and the migration from oil-lubricated machines to magnetic-bearing designs, which cut energy use by 30%, are the primary drivers of growth. End users view energy as more than 40% of total wastewater-plant operating costs, making efficiency upgrades financially compelling. The Asia-Pacific region leads demand, driven by public infrastructure spending, while medium-pressure applications in the process industries register the fastest incremental volume growth. Consolidation among top suppliers is reshaping the competitive landscape as firms acquire technology specialists to expand their portfolios and reduce the lifecycle costs of air-handling systems.
Key Report Takeaways
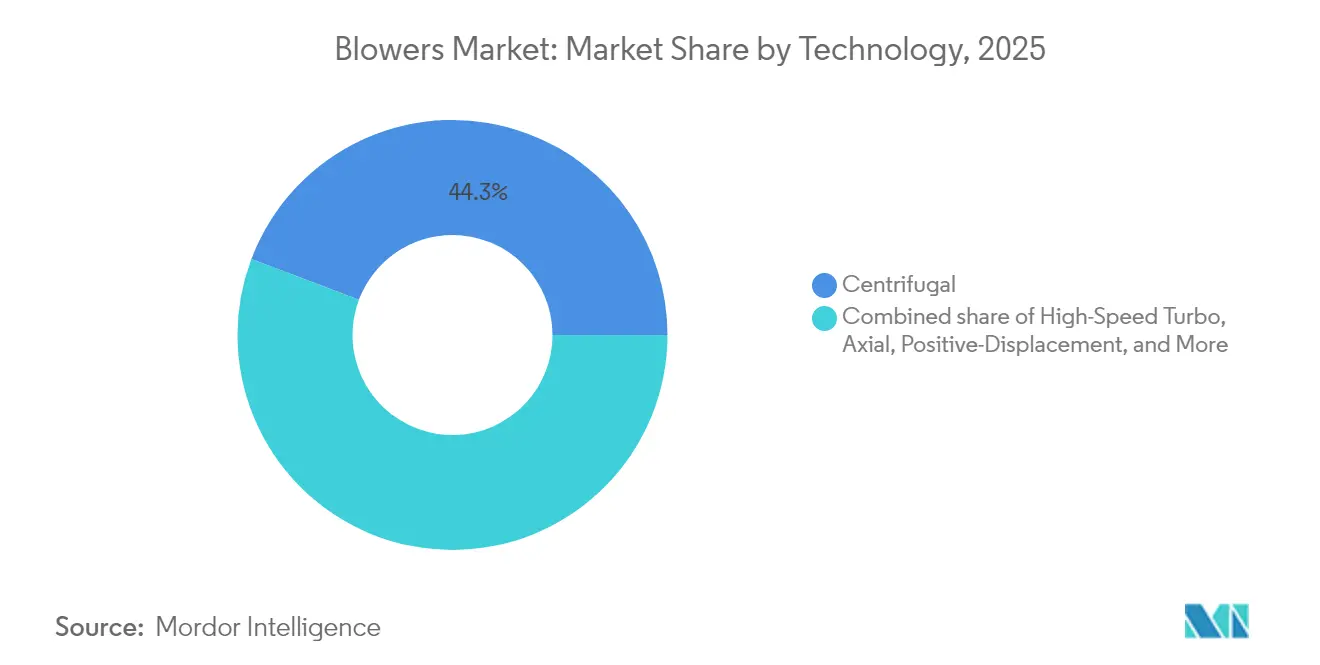
- By technology, centrifugal blowers held 44.25% of the blower market share in 2025, whereas high-speed turbo blowers are projected to expand at a 5.86% CAGR to 2031.
- By pressure range, low-pressure units captured 41.85% of the blower market size in 2025, while the medium-pressure segment is poised to grow at a 5.46% CAGR during the forecast period.
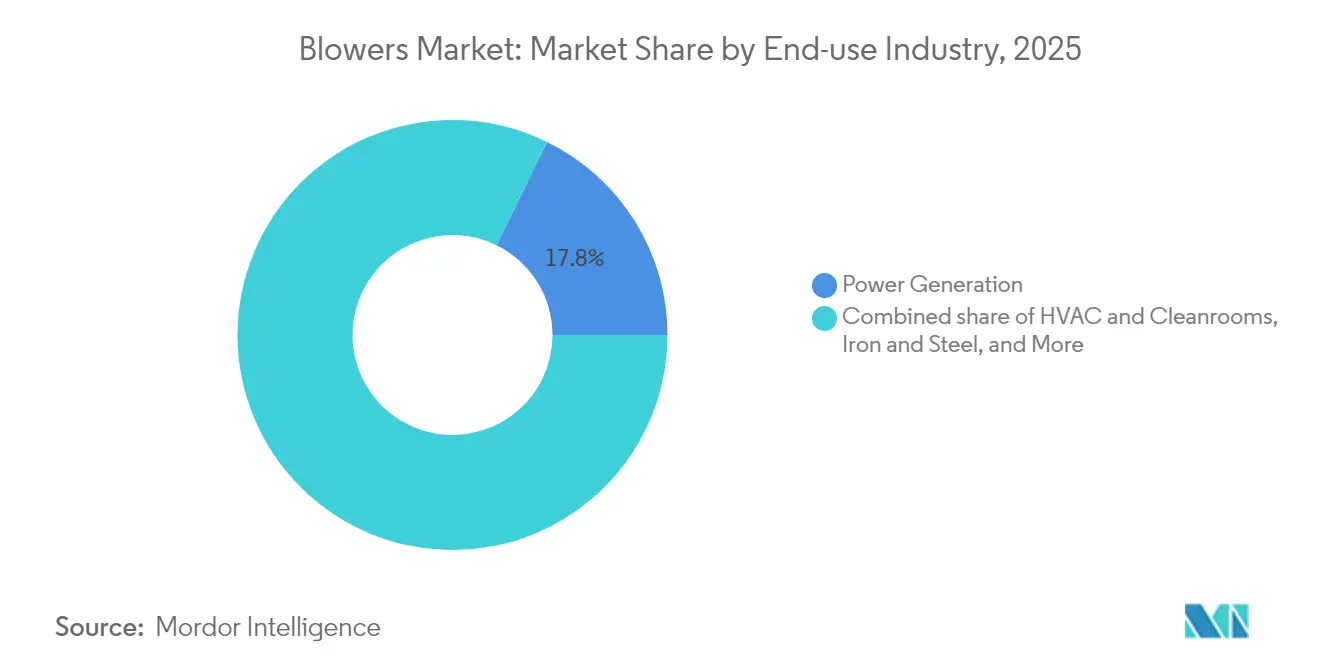
- By end-use industry, power generation accounted for an 17.75% revenue share of the blower market size in 2025; HVAC and cleanrooms are projected to advance at a 6.44% CAGR through 2031.
- By geography, the Asia-Pacific region commanded 43.10% of 2025 sales and is also the fastest-growing regional market, with a 5.02% CAGR through 2031.
Note: Market size and forecast figures in this report are generated using Mordor Intelligence’s proprietary estimation framework, updated with the latest available data and insights as of 2026.
Market Trends and Insights
Drivers Impact Analysis of Blowers Market*
| Driver | (~) % Impact on CAGR Forecast | Geographic Relevance | Impact Timeline |
|---|---|---|---|
| Rapid expansion of wastewater-treatment infrastructure | +1.20% | Global, with APAC and MEA leading | Medium term (2-4 years) |
| Stricter industrial air-emission regulations | +0.80% | North America & EU, expanding to APAC | Long term (≥ 4 years) |
| Power-generation additions in emerging economies | +0.90% | APAC core, spill-over to MEA | Medium term (2-4 years) |
| Industrial energy-efficiency retrofits | +0.70% | Global, with EU and North America early adoption | Short term (≤ 2 years) |
| Data-centre liquid-cooling demand for high-pressure blowers | +0.60% | North America, APAC, expanding to EU | Short term (≤ 2 years) |
| Farm-scale biogas digesters boosting regenerative blowers | +0.40% | EU, North America, emerging in APAC | Long term (≥ 4 years) |
| Source: Mordor Intelligence | |||
Rapid Expansion of Wastewater-Treatment Infrastructure
Municipal and industrial wastewater facilities are increasing their aeration capacity, which typically accounts for 40-60% of a plant’s electricity budget, resulting in sustained demand for blowers.(1)Mark Hinckley, “Magnetic Bearings: An Attractive Force for Energy-efficiency,” blowervacuumbestpractices.com A retrofit at the Kansas Water Resource Recovery Facility cut annual energy costs by USD 35,000 after switching to high-speed integrally geared blowers. Asia-Pacific governments are coupling water-scarcity concerns with stricter discharge rules, spurring the uptake of centrifugal and magnetic-bearing turbo models that provide precise dissolved-oxygen control. Modular treatment packages help smaller municipalities standardize procurement, indirectly boosting the blower market by favoring brands with proven reliability. Vendors able to supply digital monitoring and predictive-maintenance software gain further advantage as utilities target whole-of-life operating savings.
Stricter Industrial Air-Emission Regulations
Tightening particulate and gas limits across chemical, power, and food-processing plants are pushing operators to acquire blowers that sustain constant flow under variable conditions.(2)Britt Burt & Brock Ramey, “U.S. Power Industry Outlook 2025,” turbomachinerymag.comThe United States plans 875 GW of new generating capacity between 2025-2029, each project integrating flue-gas treatment systems reliant on high-efficiency blowers. Europe’s revised Industrial Emissions Directive incorporates continuous emissions monitoring, a specification that favors magnetic-bearing turbo designs due to their oil-free reliability. Pharmaceutical producers and cleanrooms now require class 100 or better airflow, broadening the regulatory pull on the blower market. Overall, compliance costs steer procurement toward premium machines with verifiable energy and uptime metrics, enabling suppliers to secure higher margins despite price-sensitive sectors.
Power-Generation Additions in Emerging Economies
Rising electricity demand in the APAC and MEA regions underpins orders for forced-draft, induced-draft, and flue-gas desulfurization blowers that maintain combustion efficiency in natural-gas plants. The parallel rollout of utility-scale solar and wind power adds balancing requirements, driving demand for high-reliability machines that can cycle frequently without service downtime. Data centre proliferation creates a still-niche but fast-growing need for high-pressure liquid-cooling blowers capable of producing a stable output of 70+ kPa. Industrial gas-turbine packages likewise demand precision air-handling, often bundled with OEM maintenance agreements that lock in long-term parts revenue for blower vendors. In emerging markets, utilities prioritize low total cost of ownership, which reinforces the sales of magnetic-bearing systems, even where capital budgets remain constrained.
Industrial Energy-Efficiency Retrofits
Manufacturers worldwide target aggressive reductions in Scope 1 and Scope 2 emissions, translating into systematic upgrades of blower systems. The Victor Valley Wastewater Reclamation Authority reported an annual savings of 928,000 kWh and a cost reduction of USD 98,000 after replacing aging units with VFD-equipped alternatives. Energy-service companies now structure retrofit projects on performance-guarantee contracts, removing upfront capital expenditure barriers for plant operators. Variable-frequency drives, matched with smart control algorithms, enable facilities to trim airflow during low-load periods without compromising process stability, thereby reinforcing the demand for digitally enabled blower systems. High electricity tariffs and carbon pricing in the EU quicken payback periods, sharpening interest in magnetic-levitation solutions that cut operating expenditure by double-digit percentages.
Restraints Impact Analysis of Blowers Market*
| Restraint | (~) % Impact on CAGR Forecast | Geographic Relevance | Impact Timeline |
|---|---|---|---|
| Steel & copper price volatility | -0.50% | Global, with manufacturing-heavy regions most affected | Short term (≤ 2 years) |
| High energy consumption and noise versus alternative tech | -0.30% | Global, with stricter regulations in EU and North America | Medium term (2-4 years) |
| Magnetic-levitation turbo blowers cannibalising legacy units | -0.40% | North America & EU early adoption, expanding globally | Medium term (2-4 years) |
| Rare-earth magnet supply-chain exposure | -0.20% | Global, with China-dependent supply chains most vulnerable | Long term (≥ 4 years) |
| Source: Mordor Intelligence | |||
Steel & Copper Price Volatility
Commodity swings create budget uncertainty for end users and margin pressure for manufacturers, especially given steel’s weight in centrifugal-blower housings and copper’s role in motor windings. Producers respond by dual-sourcing metals and carrying higher inventories, which raises working-capital needs. Projects in cost-sensitive sectors often defer purchase orders until price signals stabilize, temporarily damping blower market demand. EPC contractors now insert price-escalation clauses into contracts, transferring part of the raw-material risk back to clients. Although hedging instruments offer partial relief, sustained volatility could delay large wastewater plant tenders scheduled for 2026-2027.
Magnetic-Levitation Turbo Blowers Cannibalising Legacy Units
Magnetic bearings reduce energy use by 30% and maintenance costs by 95%, enabling paybacks of two to three years that motivate rapid replacement of legacy systems. The resulting substitution erodes aftermarket revenue from the installed base for conventional-technology suppliers. Manufacturers without magnetic expertise face accelerated obsolescence unless they license or acquire suitable platforms. The upgrading trend is most intense in wastewater and high-duty industrial processes where uptime is critical. Over the medium term, the shift may cap unit-shipment growth in traditional positive-displacement segments even as overall blower market revenue rises.
*Our forecasts treat driver/restraint impacts as directional, not additive. The impact forecasts reflect baseline growth, mix effects, and variable interactions.
Blowers Market Segment Analysis
By Technology:
Centrifugal Dominance Faces Turbo DisruptionThe blower market size for centrifugal technology accounts for a 44.25% share in 2025, reflecting decades of proven reliability in municipal wastewater and general industrial applications. High-speed turbo designs, however, are projected to register a 5.86% CAGR through 2031, as buyers prioritize lifetime energy savings. Centrifugal models still appeal where lower upfront cost and simpler maintenance outweigh efficiency benefits, especially in developing regions with limited technical skill availability. Suppliers position hybrid portfolios that combine in-house centrifugal lines with acquired magnetic-bearing offerings to defend their market share. Turbo machines are increasingly integrating condition-monitoring sensors, providing operators with real-time data that further enhances their perceived value. Positive-displacement roots blowers retain relevance in flow-constant applications, such as the pneumatic conveying of bulk solids, although their share is declining. Axial machines occupy a niche in high-volume, low-pressure cooling towers, while regenerative units are growing in farm-scale biogas digesters, where moisture-tolerant airflows are crucial.
Second-generation turbo blowers operate at rotational speeds exceeding 40,000 rpm, supported by advanced micro-mesh filters that enhance bearing life in dusty environments. Several manufacturers now bundle software that automatically tunes impeller pitch to maintain efficiency across fluctuating loads, a key differentiator in variable-torque wastewater aeration. As magnet supply risks persist, a subset of operators signals interest in hybrid ceramic-bearing technology, although these prototypes remain unproven at an industrial scale. Overall, centrifugal equipment is expected to keep numerical leadership but cede incremental revenue gains to turbo units in high-value segments.


By Pressure Range:
Medium-Pressure Applications Drive GrowthLow-pressure machines, operating below 15 kPa, secured 41.85% of the blower market share in 2025, primarily driven by municipal aeration basins and HVAC distribution. Medium-pressure equipment (15-70 kPa) is expanding at a 5.46% CAGR, as chemical plants, cement kilns, and material-handling lines modernize with tighter process controls. The increasing demand for precise pressure regulation in specialty chemicals is driving the need for pneumatic transport systems, which centrifugal and turbo models effectively deliver. High-pressure variants above 70 kPa address niche combustion air and gas compression duties, with order intake tied to oil refinery turnarounds and gas turbine installations. Process intensification trends, such as higher throughput reactors, necessitate variable-speed drives that enable rapid pressure adjustments without wasting energy. Solution providers differentiate through integrated medium-voltage drives like SINAMICS PERFECT HARMONY GH180, which ensures stable output across a 10:1 speed range.
Emerging markets favor standardized medium-pressure skid packages, allowing faster greenfield plant startups while mitigating skill shortages. To tap into that need, several OEMs have relocated their final assembly closer to APAC, thereby cutting logistics costs and import duties. Aftermarket service revenues also tend to favor medium-pressure applications, as industrial users often sign multi-year performance agreements that cover instrumentation calibration and impeller rebalancing.
By End-use Industry:
HVAC & Cleanrooms Emerge as Growth LeaderPower generation accounted for 17.75% of the global blower market size in 2025. Base-load fossil plants, combined-cycle gas units, and biomass boilers rely on induced-draft and flue-gas desulfurization blowers to regulate combustion and control emissions. However, HVAC and cleanroom installations are projected to grow at a 6.44% CAGR to 2031 as the semiconductor and biologics industries build dozens of ultra-clean fabs. These facilities require laminar airflow that maintains ISO 14644 Class 1-5 particulate thresholds, often necessitating redundancy and magnetic-bearing designs to prevent oil contamination. Food and beverage processors incorporate hygienic stainless-steel blowers to comply with stricter sanitation codes, while the construction and cement segments utilize medium-pressure machines for material blending and dust mitigation.
Oil and gas applications face mixed fortunes: upstream gas gathering stations still specify regenerative blowers for vapor recovery, but downstream refineries defer non-critical capex amid energy transition uncertainty. Meanwhile, mining and metals expand cautiously alongside base-metal demand for electric-vehicle batteries, generating steady but unspectacular blower volumes. Across industries, the pivot toward digital maintenance dashboards that integrate vibration analytics is uniform, highlighting that ancillary software now influences purchase choice as much as mechanical design.
Geography Analysis
APAC Blowers Market
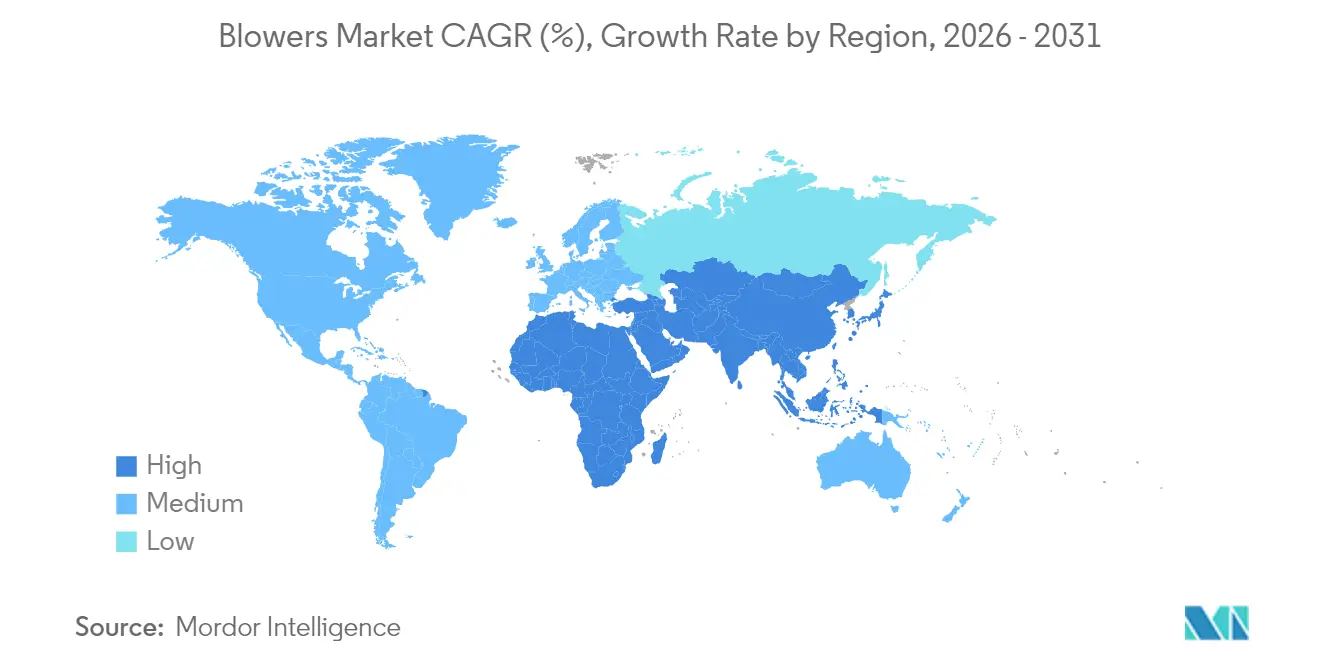
The Asia-Pacific region underpinned USD 3.75 billion worth of blower sales in 2025, accounting for 43.10% of the global value. China’s “Zero Discharge” mandates accelerate municipal wastewater upgrades, while India’s Jal Jeevan Mission funds new treatment plants that collectively boost the adoption of centrifugal and turbo blowers. ASEAN electronics hubs in Vietnam and Malaysia are installing cleanroom-grade HVAC blowers to support the fast-rising chip-assembly exports. The region’s 5.02% CAGR outlook reflects both greenfield infrastructure and retrofits aimed at lowering energy intensity.
North America Blowers Market
North America follows with mature but lucrative replacement demand. Utilities retrofit aged aeration equipment with VFD-linked turbo blowers to comply with state energy-efficiency incentives. The build-out of data centres across the United States generates high-pressure liquid-cooling orders, providing suppliers with margin-rich project opportunities. Federal emission-reduction targets are accelerating the early adoption of magnetic-bearing technologies in petrochemical clusters along the Gulf Coast. Canada’s expanding biogas programs enhance sales of moisture-resistant regenerative units for anaerobic digesters.
EMEA and South America Blowers Market
Europe sustains premium pricing on the back of the Industrial Emissions Directive, encouraging facilities to buy oil-free machines that guarantee class-zero air purity. Germany’s chemical and pharmaceutical complexes are investing in variable-speed centrifugal blowers to reduce energy bills amid rising carbon charges. The region’s advanced aftermarket environment favors subscription-based maintenance services, expanding recurring revenue streams. South America and the Middle East & Africa collectively contributed less than 10% of the 2025 volume, but signal upside linked to desalination plants and mining projects. Currency and political risks temper short-term adoption; however, international financiers’ focus on water security in the MEA supports long-term growth in the blower market.

Regulatory Landscape
Blower design and procurement are shaped by occupational safety and plant compliance requirements, with noise and worker-safety expectations tied to OSHA-aligned practices in industrial facilities. At the equipment level, OEM documentation and operating manuals reference compliance with prevailing safety regulations, which influences acceptance testing and on-site operating procedures in wastewater treatment and process industries.
Cross-border sales also depend on meeting market-entry conformity and quality regimes, prompting manufacturers to maintain widely recognized certifications. For instance, DongKun Industrial Co. Ltd cites ISO 9001, CE, CCC, CSA, and SASO to access global industrial markets, while EU and other regional standards such as the Industrial Emissions Directive favor oil-free magnetic-bearing designs for continuous operation under tighter emissions constraints. Indian manufacturers additionally navigate SEBI listing requirements and Indian Accounting Standards for financial reporting, which affects procurement disclosures and governance practices.
Competitive Landscape
The blower market exhibits moderate fragmentation, with the top five vendors controlling an estimated 35-40% of global revenue, leaving sizable room for regional specialists. Ingersoll Rand spent more than USD 300 million on acquisitions between 2024-2025, adding wastewater and air-treatment expertise to its industrial portfolio. Atlas Copco’s 2025 acquisition of Korean compressor maker Kyungwon Machinery expands its Asia-Pacific manufacturing footprint and reduces lead times for regional buyers. Such inorganic moves demonstrate that scale and technological depth are critical to defending a share in energy-efficient magnetic-bearing segments.
Technology integration stands out as the competitive frontier. Market leaders bundle IoT nodes that stream vibration, temperature, and bearing data to cloud dashboards, enabling predictive maintenance and remote troubleshooting. Start-ups targeting the blower industry leverage proprietary bearing materials or advanced aerodynamics to achieve sub-0.1 kW/m³/min efficiency metrics, pressuring incumbents to accelerate R&D. Price rivalry remains intense in low-pressure municipal tenders, but differentiation through life-cycle cost modeling enables premium brands to secure supply agreements despite higher upfront prices.
Regional dynamics add complexity. Chinese domestic suppliers are growing rapidly in mid-tier municipal projects, yet they struggle to enter export-controlled semiconductor cleanrooms that require ISO-certified, oil-free air. European firms capitalize on stringent environmental regulations to sell high-end magnetic-levitation units, while North American OEMs focus on aftermarket contracts that secure parts and service revenue. Raw-material cost volatility squeezes smaller producers, who lack purchasing leverage, catalyzing further consolidation over the forecast horizon.
Blowers Industry Leaders
Continental Blower LLC
CG Power and Industrial Solutions Limited
DongKun Industrial Co. Ltd
Howden Group Ltd
Loren Cook Company
- *Disclaimer: Major Players sorted in no particular order

Blowers Market Companies Covered in this Report
- Acme Engineering & Manufacturing Corp.
- Airmaster Fan Company Inc.
- Atlas Copco AB
- Continental Blower LLC
- CG Power & Industrial Solutions Ltd.
- DongKun Industrial Co. Ltd.
- Flakt Woods Group SA
- Gardner Denver Holdings Inc.
- Greenheck Fan Corp.
- Howden Group Ltd.
- Loren Cook Company
- Pollrich GmbH
- Ingersoll Rand Inc.
- Chicago Blower Corporation
- Twin City Fan & Blower
- Spencer Turbine Company
- New York Blower Company
- AirPro Fan & Blower Co.
- Atlantic Blowers
- Shandong Zhangqiu Blower Co. Ltd.
- Zhejiang Shangfeng Industrial Holdings
- Hitachi Industrial Equipment Systems Co. Ltd.

Market Opportunities and Future Outlook
Energy-efficiency retrofits and packaged upgrade offerings are prominent growth themes in the blower market. End users view energy as a significant portion of wastewater plant operating budgets, and the payback logic around magnetic-bearing and high-efficiency blowers tends to drive capital-decision tradeoffs. Bundled offerings that combine VFDs, digital monitoring, and performance guarantees fit energy-service company procurement models and utility-driven retrofit programs.
Data center expansion, hyperscale deployments, and semiconductor localization are also shaping industrial air-handling demand. A US hyperscale data center project tied to a USD 99.2 million power-transformer contract to CG Power illustrates continued data-center capex, while APAC markets benefit from municipal upgrades under China’s Zero Discharge mandates and India’s Jal Jeevan Mission. Together, these dynamics support broader uptake of oil-free and digitally monitored blowers, and they reinforce supplier differentiation around magnetic-bearing systems.
Recent Industry Developments in Blowers Market
- June 2026: Everllence announced a contract to supply two RC vacuum blowers for a new ultra-premium tissue production machine in the United States, with commissioning scheduled for 2028. The vacuum blower order for high-end tissue manufacturing points to entry into premium downstream markets and extends US manufacturing-adjacent exposure. The deal strengthens Everllence's specialized blower footprint in premium packaging and creates long-cycle OEM service opportunities.
- April 2025: Geiger Pump & Equipment (representing Continental Blower LLC) partnered to represent Continental Blower's complete range of high-performance blower systems in the Mid-Atlantic region. The arrangement expands North American distribution and improves customer access to advanced blower technology in a strategic market. It also accelerates Continental Blower's regional service availability and reach.
- March 2025: Atlas Copco announced a pending acquisition of Kyungwon Machinery Industry Co. Ltd to expand its Industrial Air Division in Asia-Pacific. The acquisition expands its presence in key APAC blower and air handling markets and improves access to magnetic-bearing and energy efficient solutions. It also increases scale and reinforces the regional footprint for high-end products.


Blowers Market Report Scope and Research Methodology
Market Definition and Coverage
For this study, the blower market covers mechanical equipment that moves air or gas at a defined flow and pressure for industrial, commercial, and infrastructure applications. Revenue is measured as blower sales and related supply.
Scope exclusions: handheld consumer air devices and non-mechanical alternatives, such as pure compressed air systems without blower equipment, are not counted.
Segments Covered in This Report
- By Technology
- Centrifugal
- Axial
- Positive-Displacement (Roots)
- High-Speed Turbo
- Regenerative
- By Pressure Range
- Low (Below 15 kPa)
- Medium (15 to 70 kPa)
- High (Above 70 kPa)
- By End-use Industry
- Power Generation
- Oil and Gas
- Iron and Steel
- Chemical and Petrochemical
- Mining and Metals
- Construction and Cement
- Food and Beverage
- Waste-Water Treatment
- HVAC & Cleanrooms
- Others
- By Geography
- North America
- United States
- Canada
- Mexico
- Europe
- Germany
- United Kingdom
- France
- Italy
- Spain
- NORDIC Countries
- Russia
- Rest of Europe
- Asia-Pacific
- China
- India
- Japan
- South Korea
- ASEAN Countries
- Rest of Asia-Pacific
- South America
- Brazil
- Argentina
- Rest of South America
- Middle East and Africa
- Saudi Arabia
- United Arab Emirates
- South Africa
- Rest of Middle East and Africa
- North America
Data Sources, Market Sizing, and Validation
Desk Research
Desk research started with public sources that describe demand drivers and equipment usage patterns in sectors that buy blowers. We leaned on the US Energy Information Administration for industrial energy context, the US EPA for wastewater and emissions-related references, and World Bank and UN data for macro indicators tied to industrial activity and infrastructure builds.
To translate those demand signals into market inputs, we also reviewed sources such as UN Comtrade for trade flows of relevant machinery categories, publications from engineering and fluid handling associations, and technical papers that clarify efficiency classes and typical operating ranges. Company annual reports, investor presentations, and press releases helped map product mix and regional exposure, and we used approved paid subscriptions for company financials and patent lookups to confirm product focus and investment direction. These desk sources are illustrative only, and other public documents and data tables were also used for cross-checking and clarification.
Primary Interviews and Surveys
Primary work focused on interviews and short surveys with manufacturers, distributors, EPC stakeholders, and end users across key buyer industries like wastewater treatment, power, chemicals, cement, and general manufacturing. Respondent input clarified typical order sizes, replacement cycles, channel markups, and the practical split between standard units and engineered units, which then helped close gaps left by public datasets and keep assumptions realistic across regions.
Distribution of primary research fieldwork respondents
| Company type | Respondent position | Region |
|---|---|---|
| Top tier: 38% | CXOs: 18% | APAC: 48% |
| Mid tier: 43% | Functional/Unit leaders: 27% | EMEA: 30% |
| Smaller Players: 19% | Managers: 55% | Americas: 22% |
Market-Sizing & Forecasting
We sized the market using a top-down approach that reconstructs blower demand from end-use activity and equipment intensity, then checked the result with selective bottom-up rollups from sampled supplier revenue splits and channel feedback. Where public data was too broad, the model used practical ratios taken from interviews, and totals were adjusted only after the logic matched what buyers and sellers describe about project pipelines.
Key inputs included industrial production growth, wastewater capacity additions and upgrade cycles, energy efficiency adoption including variable speed drive attachment rates, typical replacement timing by duty cycle, and average selling price ranges by pressure class. Because forecast outputs can drift if any single input is pushed too far, we ran scenario analysis anchored on a base case aligned with the most common planning outlook shared by respondents, and then stress-tested it with faster and slower industrial capex paths. When the bottom-up check did not fully cover smaller countries or fragmented channels, we filled the gap using import and export signals plus normalized per-site equipment counts, and then rechecked those assumptions using regional interview feedback.
Data Validation & Update Cycle
Validation was done through multiple passes where outputs were compared with independent signals such as trade movement direction, sector capex trends, and the implied installed base replacement spend. If a country or end-use result looked unusual, we traced it back to the specific variable that moved it, then corrected the input or documented the reason for variance before internal sign-off.
Reports are refreshed on an annual cycle, and interim updates are triggered when major events materially change pricing, supply availability, or demand outlook. Before delivery, we run a final review pass so the tables, assumptions, and narrative reflect the latest available information and the most recent expert feedback.
Mordor Intelligence's Blower Market Size Measured Against Other Published Estimates
Published blower market numbers can differ because scope is not always set the same way, and because pricing and volume assumptions draw on different data signals. Differences also show up when firms choose different base years, apply different currency conversion timing, or update models on different schedules.
Some estimates bundle adjacent equipment like fans, compressors, or full air handling systems, which can make totals look larger even when the buyer problem is similar. In Mordor Intelligence's model, value is kept to blower equipment revenue only. It is then validated using pressure-class mix, replacement cycles, and interview-led ASP ranges before the final total is locked.
Benchmark comparison
| Source | Market Size | Gaps in Research Methodology |
|---|---|---|
| Mordor Intelligence | USD 8.69 B (2025) | |
| Global Consultancy A | USD 10.20 B (2025) | Uses a wider equipment bucket that can include fans and packaged ventilation modules, and it applies blended pricing without separating pressure class and duty cycle differences. |
| Industry Association B | USD 7.90 B (2025) | Leans heavily on member-reported shipment activity, which can undercount non-member sales and aftermarket-related revenue, and it may not fully normalize regional price levels. |
The comparison shows that the spread is mainly explained by what equipment gets counted and how prices are converted into revenue for a given year. Our approach stays traceable because each step ties back to clear demand drivers, realistic price bands, and checks that flag overstatement or undercoverage before results are finalized.


Key Questions Answered in the Report
What was the global blower market size in 2026?
The blower market size reached USD 9.09 billion in 2026.
How fast is the blower market expected to grow?
Between 2026 and 2031, the blower market is projected to post a 4.62% CAGR.
Which region leads the blower market?
Asia-Pacific held 43.10% of global revenue in 2025 and is also the fastest-growing region at 5.02% CAGR through 2031.
What technology segment is growing the quickest?
High-speed turbo blowers are forecast to expand at 5.86% CAGR, the fastest among all technology segments.
Why are magnetic-bearing blowers gaining popularity?
Magnetic-bearing units lower energy consumption by 30% and cut maintenance costs by 95%, yielding paybacks in under three years.
Which end-use industry will grow most rapidly?
HVAC and cleanroom applications are expected to advance at 6.44% CAGR through 2031, outpacing all other industries.
Page last updated on:


 Your data is secure and never sold or shared.


