
Blood Transfusion Diagnostics Market Size and Share
Market Overview
| Study Period | 2020 - 2031 |
|---|---|
| Market Size (2026) | USD 6.41 Billion |
| Market Size (2031) | USD 9.14 Billion |
| Growth Rate (2026 - 2031) | 7.34 % |
| Fastest Growing Market | Asia-Pacific |
| Largest Market | North America |
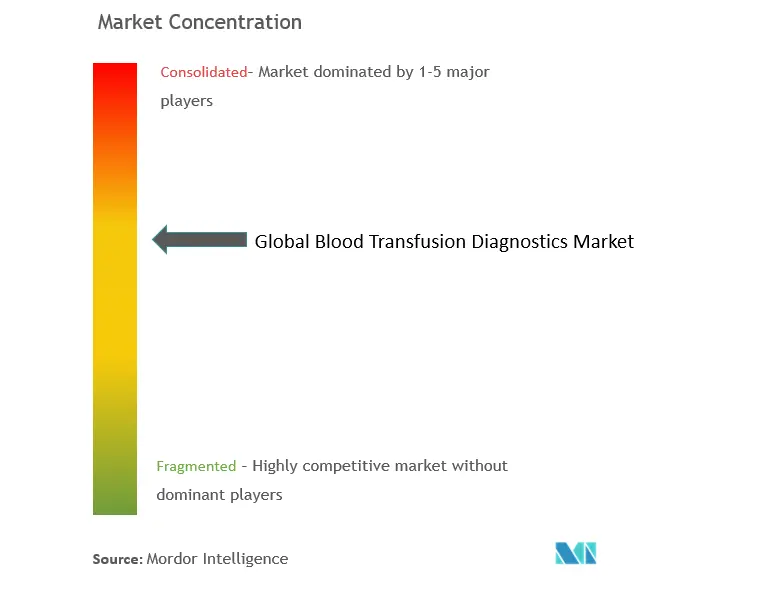
| Market Concentration | Medium |
Major Players *Disclaimer: Major Players sorted in no particular order Image © Mordor Intelligence. Reuse requires attribution under CC BY 4.0. | |
Blood Transfusion Diagnostics Market Analysis by Mordor Intelligence
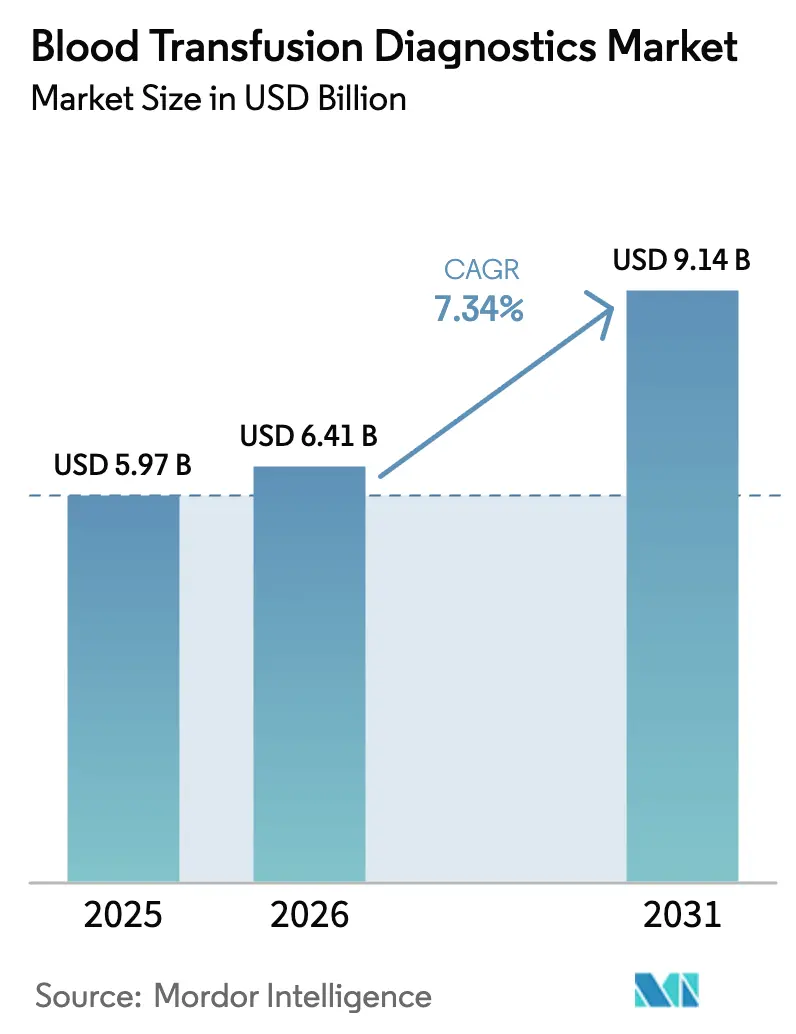
Blood transfusion diagnostics market size in 2026 is estimated at USD 6.41 billion, growing from 2025 value of USD 5.97 billion with 2031 projections showing USD 9.14 billion, growing at 7.34% CAGR over 2026-2031. Growth reflects the United States Food and Drug Administration’s decision to place laboratory-developed tests under full device regulations, widespread deployment of high-throughput nucleic acid testing platforms, and expanding donor-to-patient safety programs across emerging economies[1]. Upgrades in automation, artificial-intelligence-driven sample inspection, and fingertip capillary-blood devices shorten turnaround times, reducing staffing pressures in hospitals and blood banks. National donation campaigns in Asia-Pacific and Africa, rising surgical volumes in North America and Europe, and the increasing complexity of trauma care together expand baseline transfusion volumes. Simultaneously, industry players face cost inflation in reagents and logistics, prompting consolidation of purchasing through group-purchasing organizations while favoring manufacturers that already operate under robust quality systems.
Key Report Takeaways
- By product type, consumables led with 53.62% revenue share in 2025, whereas instruments are projected to expand at a 8.95% CAGR to 2031.
- By technology, serology held 45.12% of the blood transfusion diagnostics market share in 2025, while nucleic acid testing records the fastest trajectory at 8.63% CAGR through 2031.
- By application, disease screening accounted for 60.05% of the blood transfusion diagnostics market size in 2025; blood group typing advances at 9.78% CAGR through 2031.
- By end user, hospitals commanded 46.12% share in 2025, yet blood banks show the highest forecast growth at 10.14% CAGR.
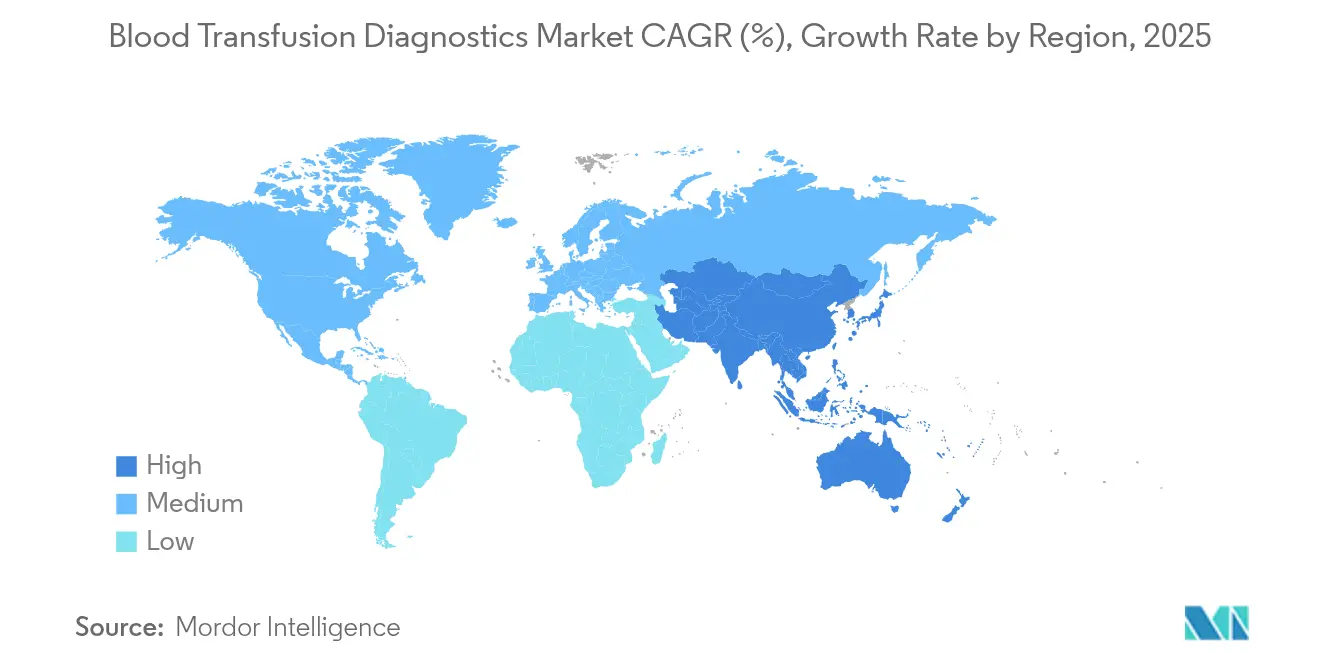
- By region, North America dominated with 39.12% share in 2025; Asia-Pacific is on track for the quickest rise at 8.31% CAGR to 2031.
Note: Market size and forecast figures in this report are generated using Mordor Intelligence’s proprietary estimation framework, updated with the latest available data and insights as of 2026.
Market Trends and Insights
Drivers Impact Analysis of Blood Transfusion Diagnostics Market*
| Driver | (~) % Impact on CAGR Forecast | Geographic Relevance | Impact Timeline |
|---|---|---|---|
| Rising global blood donations and transfusion demand | +1.8% | Asia-Pacific and Africa highest | Medium term (2-4 years) |
| Growing incidence of trauma and surgical procedures | +1.5% | Developed markets | Long term (≥ 4 years) |
| Technological advancements in transfusion diagnostics | +2.1% | North America & Europe lead | Short term (≤ 2 years) |
| Integration of point-of-care testing in blood banks | +1.2% | North America & Europe early adopters | Medium term (2-4 years) |
| Expansion of healthcare infrastructure in emerging markets | +1.6% | Core momentum in Asia-Pacific | Long term (≥ 4 years) |
| Adoption of cloud-based blood bank information systems | +0.9% | Faster uptake in high-income regions | Short term (≤ 2 years) |
| Source: Mordor Intelligence | |||
Rising Global Blood Donations and Transfusion Demand
Voluntary donor drives and hemovigilance programs stimulate steady growth for the blood transfusion diagnostics market. China’s National Health Commission partners with youth organizations to broaden group donations, while India’s Hemovigilance Program trains more than 15,000 clinicians to improve adverse-event reporting[2]. In the United States, college competitions supported by Abbott Laboratories raise public awareness, and Cerus Corporation’s INTERCEPT pathogen-reduction kits safeguard platelet and plasma components. Europe continues to call for 2 million extra donors to lessen import dependence, underscoring global supply challenges.
Growing Incidence of Trauma and Surgical Procedures
The blood transfusion diagnostics market benefits from rising trauma care complexity and higher surgical case loads. The 2025 Medicare Physician Fee Schedule recognizes pre-hospital transfusion as advanced life support, increasing reimbursement for ambulance providers that stock blood. A large Midwest academic center reported 323 massive transfusion activations in 2024, a 7% increase year on year. Point-of-care coagulation analyzers now guide intraoperative decisions, and machine-learning dashboards predict inventory surges, cutting wastage.
Technological Advancements in Transfusion Diagnostics
Next-generation platforms strengthen the blood transfusion diagnostics market by shortening diagnostic windows. Roche’s cobas Malaria assay, the first molecular malaria test cleared for U.S. donor screening, complements multiplex viral NAT panels. Metagenomic sequencing from Karius detects more than 1,000 pathogens in a single sample, tripling bloodstream infection detection versus culture methods. Deep-learning modules integrated into automated workstations improve buffy-coat recognition accuracy, streamlining nucleic-acid extraction.
Integration of Point-of-Care Testing in Blood Banks
Fingertip capillary sampling devices launched by BD and Babson Diagnostics need just six drops of blood, letting non-phlebotomists collect specimens. The FDA’s authorization of the first point-of-care hepatitis C RNA test delivers confirmatory results in one hour. bioMérieux’s acquisition of SpinChip Diagnostics adds a handheld immunoassay platform that produces lab-quality results within 10 minutes. Sysmex’s automated hematology analyzer with blood-bank mode counts residual leukocytes, raising efficiency in component processing.
Restraints Impact Analysis of Blood Transfusion Diagnostics Market*
| Restraints Impact Analysis | (~) % Impact on CAGR Forecast | Geographic Relevance | Impact Timeline |
|---|---|---|---|
| High cost of advanced diagnostic instruments | -1.4% | Greatest drag in emerging markets | Medium term (2-4 years) |
| Stringent regulatory approval processes | -1.1% | Global, most stringent in Europe | Long term (≥ 4 years) |
| Limited availability of rare blood reagents | -0.8% | Worldwide supply-chain concentration | Short term (≤ 2 years) |
| Fragmented donor traceability systems | -0.6% | Primarily emerging markets | Medium term (2-4 years) |
| Source: Mordor Intelligence | |||
High Cost of Advanced Diagnostic Instruments
Price tags on high-throughput analyzers restrain adoption in resource-constrained settings, challenging broader penetration of the blood transfusion diagnostics market. Routine assay reimbursements continue to drop, forcing laboratories to cross-subsidize molecular test investments. The FDA estimates annual compliance costs up to USD 3.56 billion as laboratory-developed tests transition to full device oversight. Hospital outpatient departments still bill three times more for identical tests than independent labs, underscoring procurement asymmetries[3].
Stringent Regulatory Approval Processes
Four-year phase-in periods for quality-system compliance and Europe’s In Vitro Diagnostic Regulation impose new documentation burdens. Hematology laboratories report that 75% of their in-house assays presently lack CE-marked equivalents, necessitating costly validations. The upcoming Regulation on Substances of Human Origin aims to unify European oversight yet demands IT upgrades and new donor-traceability rules for blood establishments.
*Our forecasts treat driver/restraint impacts as directional, not additive. The impact forecasts reflect baseline growth, mix effects, and variable interactions.
Blood Transfusion Diagnostics Market Segment Analysis
By Product Type:
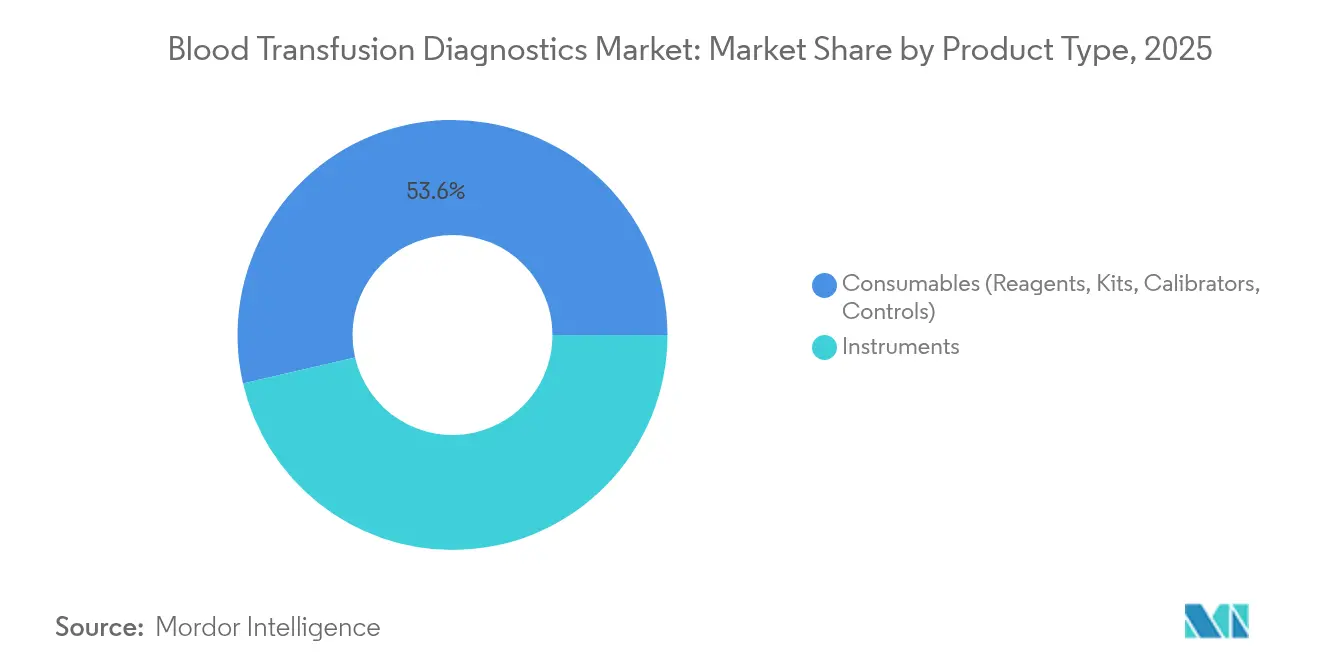
Consumables Sustain Revenue Momentum, Instruments Trigger Upgrade CyclesConsumables generated 53.62% of the 2025 blood transfusion diagnostics market. Continuous demand for reagents, calibrators, and quality-control materials provides steady cash flows, especially as test menus now include malaria, Babesia, and Zika screening. Integrated cartridge designs minimize pipetting errors while lowering hands-on time.
The instrument segment is expected to advance at a 8.95% CAGR through 2031. AI-enhanced vision systems within new centrifuge and reader platforms drive throughputs exceeding 400 samples per hour. Partnerships such as the Siemens Healthineers–Sysmex supply deal illustrate how manufacturers combine hemostasis, immunohematology, and NAT modules within single middleware ecosystems. The blood transfusion diagnostics market size attributable to new instrument placements is set to widen as leasing models and reagent-rent contracts lower upfront capital barriers.

By Technology:
Serology Holds Ground, Nucleic Acid Testing Gains SpeedSerology retained 45.12% of revenue in 2025, capitalizing on cost-efficient enzyme-linked and chemiluminescent assays that fit legacy analyzers. Reagent refinements cut false positives, preserving donation throughput.
Nucleic acid testing exhibits the highest growth at 8.63% CAGR, narrowing diagnostic windows and improving blood safety. Roche’s cobas systems now screen tens of millions of donations annually for HIV, HBV, HCV, and malaria. The blood transfusion diagnostics market share associated with NAT platforms will expand further as regulators mandate multiplex screening for additional pathogens and as pooling protocols moderate per-donor costs.
By Application:
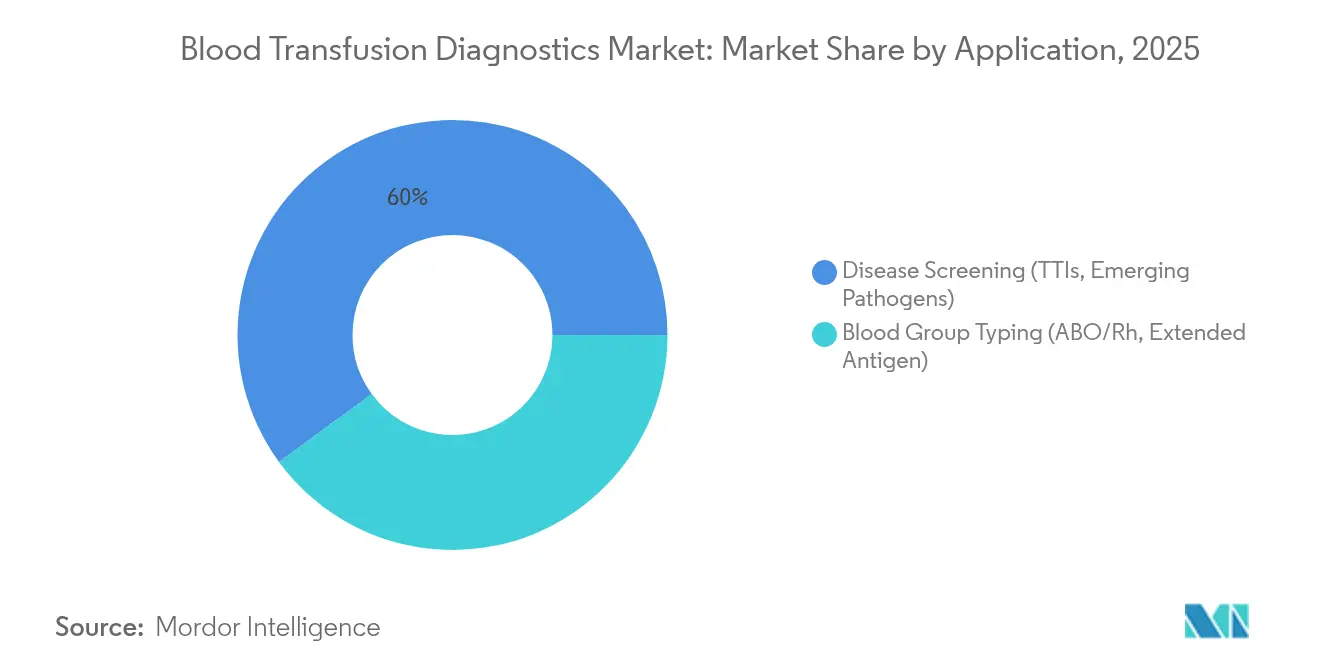
Disease Screening Dominates, Extended Typing SurgesDisease screening activities contributed 60.05% of total 2025 revenue. Mandatory viral testing and growing concern over vector-borne diseases sustain reagent pull-through. Middleware links donor records to national surveillance dashboards, improving outbreak response.
Blood group typing advances at a 9.78% CAGR. Laboratories now pursue extended antigen profiling to prevent alloimmunization, fueled by next-generation microarray and molecular kits. The blood transfusion diagnostics market size devoted to genotypic typing grows as payers acknowledge the downstream cost savings of reduced transfusion reactions.
By End User:
Hospitals Dominate, Blood Banks Accelerate DigitalizationHospitals accounted for 46.12% of 2025 revenue, leveraging in-house transfusion services to support trauma, oncology, and transplant programs. Integration with electronic medical records streamlines cross-department sample tracking.
Blood banks are projected to grow at 10.14% CAGR. Terumo BCT’s Reveos system trims manual processing from 26 to 9 steps, improving platelet yields. Cloud-based information systems offer predictive analytics for component usage, attracting smaller regional centers that previously lacked advanced informatics. The blood transfusion diagnostics industry is witnessing rapid skill-mix changes, with software specialists joining traditional laboratory teams.
Geography Analysis
North America Blood Transfusion Diagnostics Market
North America held 39.12% of global revenue in 2025. FDA guidance on device regulation and Medicare’s elevation of pre-hospital transfusion drive demand for high-sensitivity assays. Becton Dickinson’s USD 10 million domestic expansion underscores efforts to shorten supply chains. Persistent price gaps—hospital outpatient departments bill three times what independent labs charge—shape purchasing strategies.
APAC Blood Transfusion Diagnostics Market
Asia-Pacific is forecast to rise at an 8.31% CAGR, the strongest worldwide. China’s Healthy China 2030 plan funds modern blood-collection centers and supports Terumo BCT’s USD 15 million localization investment. India’s nationwide hemovigilance program lifts clinician competence, while Southeast Asian countries pilot cloud-based donor registries. Heterogeneous reimbursement and fragmented supply chains remain barriers, yet urban hospitals continue to adopt NAT and automation platforms.
Europe Blood Transfusion Diagnostics Market
Europe retains a substantial position amid unique supply and regulatory challenges. The region needs 2 million additional donors to cut reliance on imported plasma, a gap that primes demand for donor-recruitment analytics. Implementation of the Regulation on Substances of Human Origin will harmonize oversight by 2027, but labs must bridge gaps created by the In Vitro Diagnostic Regulation’s stricter evidence requirements. The blood transfusion diagnostics market continues to benefit from public-sector funding aimed at achieving self-sufficiency.
Regulatory Landscape
In the United States, blood donor screening and associated in vitro diagnostics operate under the FDA Center for Biologics Evaluation and Research (CBER) framework, including 21 CFR 610.40 requirements for testing to reduce the risk of relevant transfusion-transmitted infections. FDA activity in 2025-2026 reinforced the shift toward higher evidence and quality requirements. In January 2025, the FDA issued draft guidance on reducing transfusion-transmitted malaria risk, and in July 2025 it issued draft guidance on testing blood donations for hepatitis B surface antigen. The FDA also released its 2026 CBER guidance agenda, which includes work on blood component manufacturing and platelet collection by automated methods.
Globally, accreditation and standards increasingly shape laboratory operations alongside national regulator requirements. AABB released the 35th edition of Standards for Blood Banks and Transfusion Services, effective April 1, 2026, and it adds requirements tied to monitoring critical technology infrastructure and communications around accreditation-impacting events. In Europe, the In Vitro Diagnostic Regulation continues to raise expectations for clinical evidence and technical documentation for transfusion testing menus, while the planned Regulation on Substances of Human Origin increases the need for IT and donor-traceability upgrades across blood establishments.
Competitive Landscape
The blood transfusion diagnostics market features medium concentration. Global leaders—Roche, Abbott, Grifols, and Danaher—combine regulatory expertise, broad assay menus, and global distribution. Roche’s dual approvals for malaria and Lp(a) tests demonstrate how expansive R&D pipelines secure first-mover advantage. Abbott aligns brand visibility with nationwide donor drives, reinforcing its Alinity analyzer footprint.
Strategic acquisitions reshape portfolios. BioMérieux’s EUR 111 million purchase of SpinChip Diagnostics secures microfluidic know-how. Werfen’s acquisition of Omixon strengthens next-generation sequencing for transplant diagnostics, while BD invests in Babson’s fingertip-blood technology.
Cost inflation drives hospitals and blood banks toward multi-year reagent-rental contracts that bundle service and informatics. Suppliers respond by embedding predictive maintenance and remote calibration to minimize downtime. Emerging entrants position cloud-native traceability platforms that integrate bar-coding, blockchain, and artificial intelligence, challenging incumbents on data-service features. The blood transfusion diagnostics industry thus balances entrenched equipment ecosystems with digital disruptors targeting workflow efficiency.
Blood Transfusion Diagnostics Industry Leaders
-
Grifols, S.A.
-
F. Hoffmann-La Roche Ltd.
-
Diasorin S.p.A
-
Bio-Rad Laboratories, Inc.
-
Quotient Suisse SA
- *Disclaimer: Major Players sorted in no particular order
Blood Transfusion Diagnostics Market Companies Covered in this Report
- Grifols
- Roche
- Abbott Laboratories
- Bio-Rad Laboratories
- Immucor
- Danaher (Beckman Coulter & Cepheid)
- Siemens Healthineers
- DiaSorin
- Werfen (Instrumentation Laboratory)
- Merck KGaA (MilliporeSigma)
- Sysmex Corp.
- QuidelOrtho Corp.
- Fresenius
- Haemonetics Corp.
- Beckton Dickinson
- Thermo Fisher Scientific
- Terumo Corp.
- Trinity Biotech
- bioMérieux
Market Opportunities and Future Outlook
Regulatory-guidance updates and expanding pathogen screening menus create whitespace for manufacturers that can validate and scale high-throughput donor testing workflows. In 2026, FDA actions and product clearances underscored demand for modernized screening, including Grifols' FDA approval for the Procleix Plasmodium Assay for malaria screening on the Procleix Panther System and its later updated FDA approval for the Procleix Babesia Assay on the same platform. DiaSorin also secured FDA 510(k) clearance for the LIAISON Murex HBsAg Qual assay and the LIAISON XL Analyzer for hepatitis B surface antigen detection. Together, these approvals support opportunities in multiplex NAT, emerging-pathogen assays, and analyzer placements that drive recurring consumables.
Laboratory automation and informatics form a second opportunity area as blood banks and hospital transfusion services tighten turnaround targets and compliance demands. The AABB 35th edition standards (effective April 1, 2026) put additional emphasis on critical technology infrastructure and event communications, which supports procurement interest in connected analyzers, middleware, and monitoring capabilities that reduce downtime and documentation gaps. Vendors that bundle instruments with service, quality-system-ready workflows, and traceability-aligned software are positioned to address fragmentation in donor traceability systems, and point-of-care and capillary-blood collection approaches create room for decentralized testing models where staffing constraints are most pronounced.
Recent Industry Developments in Blood Transfusion Diagnostics Market
- June 2026: Grifols launches Evanzys IH, a next-generation automated system for immunohematology sample analysis, at the International Society of Blood Transfusion Congress. The deployment signals a step change in lab automation and workflow efficiency across transfusion centers. It strengthens Grifols' end-to-end automation footprint in transfusion labs, improving throughput and reducing staffing needs.
- April 2026: Grifols receives U.S. FDA approval for the Procleix Plasmodium Assay for screening blood donors for malaria. The regulatory clearance adds a donor malaria screening option to the Grifols portfolio for high-risk donor pools. It expands regulatory clearance and product portfolio for pathogen screening in high-risk donor pools.
- March 2026: Roche launches the cobas MPX-E assay, a 4-in-1 donor screening test for HIV, HCV, HBV, and HEV, in CE-mark accepting markets. The multiplex assay consolidates donor screening workflows across pathogens. It consolidates screening workflows and strengthens Roche’s multiplex capabilities in donor testing.
Blood Transfusion Diagnostics Market Report Scope and Research Methodology
Market Definition and Coverage
This market covers the revenue generated from diagnostic tests and related supplies used to screen donated blood and to type and match blood before transfusion, across routine blood-bank and hospital workflows.
Scope exclusions: It excludes blood collection devices, transfusion sets, storage bags, and pathogen-reduction treatment systems.
Segments Covered in This Report
- By Product Type
- Instruments
- Consumables (Reagents, Kits, Calibrators, Controls)
- By Technology
- Serology (ELISA, CLIA, Agglutination)
- Nucleic Acid Tests (PCR, TMA, NAT)
- Microarray & Next-Generation Sequencing
- Rapid / Lateral Flow Assays
- By Application
- Disease Screening (TTIs, Emerging Pathogens)
- Blood Group Typing (ABO/Rh, Extended Antigen)
- By End-User
- Hospitals
- Diagnostic Laboratories
- Blood Banks
- Plasma Fractionation Centers
- Geography
- North America
- United States
- Canada
- Mexico
- Europe
- Germany
- United Kingdom
- France
- Italy
- Spain
- Rest of Europe
- Asia-Pacific
- China
- Japan
- India
- Australia
- South Korea
- Rest of Asia-Pacific
- Middle East & Africa
- GCC
- South Africa
- Rest of Middle East & Africa
- South America
- Brazil
- Argentina
- Rest of South America
- North America
Data Sources, Market Sizing, and Validation
Desk Research
Desk work starts by building the demand environment for blood testing and typing, then mapping how testing volumes translate into spend. We mainly use public health and regulatory sources that describe donation activity, screening practices, and safety requirements, and then we connect those to published pricing and utilization signals.
Common reference points include sources such as the World Health Organization blood safety materials, national health agencies like the US CDC, FDA safety communications and device clearances, and blood donor and transfusion groups such as AABB, along with peer reviewed immunohematology and transfusion-medicine journals. We also review company filings, investor presentations, and reputable press coverage to check product mix shifts, including higher automation and the gradual spread of nucleic acid testing (NAT). When needed, paid subscriptions are used for company financials and intelligence, patent databases, and shipment-level trade data to sanity-check supply-side direction. The sources listed here are illustrative only, and many other public documents and datasets were reviewed to validate assumptions and fill data gaps.
Primary Interviews and Surveys
Primary inputs were collected through expert interviews and structured surveys with stakeholders across blood banks, hospitals, diagnostic labs, and distribution channels, so the model reflects how testing is actually purchased and used. These conversations helped confirm typical test menus, the adoption pace for NAT versus serology, instrument placement patterns, and how consumables attachment rates vary by workflow and throughput.
Distribution of primary research fieldwork respondents
| Company type | Respondent position | Region |
|---|---|---|
| Top tier: 27% | CXOs: 12% | APAC: 41% |
| Mid tier: 56% | Functional/Unit leaders: 39% | EMEA: 37% |
| Smaller Players: 17% | Managers: 49% | Americas: 22% |
Market-Sizing & Forecasting
Sizing is built using a top-down flow where donation and transfusion activity, together with screening and typing protocols, are used to reconstruct the total test volume pool by region. That volume pool is then translated into value using mix assumptions for serology versus NAT, routine versus confirmatory testing, and typical reagent and consumable consumption per test, before instrument revenue is added based on placement and replacement patterns.
To keep the totals realistic, the outputs are corroborated with selective bottom-up checks, such as sampled price points for key assays, channel feedback on reagent pull-through, and supplier-level revenue cues where disclosure allows it. Inputs that materially move the model include blood donation volumes and deferral rates, the share of donations tested with NAT, test-per-donation intensity for different infectious markers, automation levels in blood banks and hospital labs, and average selling price progression tied to menu complexity and procurement cycles.
Forecasts are produced using scenario analysis supported by expert-led assumptions, because policy adoption, funding changes, and refresh cycles can shift the pace unevenly across regions. Where bottom-up visibility is patchy in smaller countries, gaps are handled using proxy penetration rates and lab throughput bands, then rechecked with interview feedback before finalizing.
Data Validation & Update Cycle
Validation is done through repeated cross-checks between the model and independent signals like reported donation activity, regulatory screening requirements, and the observed spread of NAT and automation. Outliers are flagged when growth rates, regional shares, or implied pricing move outside what interviews and public references suggest, and then assumptions are revisited until the variance is explained.
Before sign-off, the work goes through multi-step analyst reviews, followed by targeted re-contacts with experts when a critical input changes or a new data point conflicts with earlier guidance. Reports are refreshed annually, and interim updates are made when material events occur, after which a final pre-delivery pass is completed so clients receive an updated view.
Mordor Intelligence's Blood Transfusion Diagnostics Market Estimate Compared With Other Published Estimates
Published market values for blood transfusion diagnostics can look different because the study scope and counting logic often vary, even when the same end use is being discussed. We also see differences driven by how test volumes are translated into revenue, and by whether updates capture recent shifts in NAT adoption and procurement pricing.
Pathogen-reduction treatment systems are kept outside Mordor Intelligence's scope, which narrows the value pool to screening and typing diagnostics, while some public figures appear to blend adjacent transfusion safety spending into the same total.
Benchmark comparison
| Source | Market Size | Gaps in Research Methodology |
|---|---|---|
| Mordor Intelligence | USD 6.41 B (2026) | |
| Trade Journal A | USD 4.91 B (2024) | Uses an earlier base year and applies a flatter adoption curve for NAT, which reduces implied test-per-donation intensity and keeps pricing assumptions conservative. |
| Industry Report B | USD 7.20 B (2028) | Blends broader transfusion-related spend and assumes faster ASP uplift from automation without consistently separating instrument revenue from recurring consumables. |
The spread in the table mainly comes from what is counted, the base year chosen, and how quickly testing mix and pricing are allowed to change. By keeping the model tied to observable donation activity, testing protocols, and realistic reagent pull-through, our estimate stays traceable to clear drivers that can be rechecked and updated.
Key Questions Answered in the Report
What is the current value of the blood transfusion diagnostics market?
The blood transfusion diagnostics market is valued at USD 6.41 billion in 2026.
How fast will the market grow through 2031?
It is projected to expand at a 7.34% CAGR, reaching USD 9.14 billion by 2031.
Which product category leads revenue generation?
Consumables account for 53.62% of 2025 revenue due to recurring reagent demand.
What technology segment is advancing the quickest?
Nucleic acid testing posts the highest growth rate at 8.63% CAGR.
Why is Asia-Pacific considered the fastest-growing region?
Government-backed blood-safety investments and rising surgical volumes support an 8.31% CAGR.
How do new FDA regulations affect diagnostic manufacturers?
Laboratory-developed tests now require device-level compliance, increasing costs but favoring suppliers with established quality systems.