
Blood Processing Devices And Consumables Market Size and Share
Market Overview
| Study Period | 2020 - 2031 |
|---|---|
| Market Size (2026) | USD 55.53 Billion |
| Market Size (2031) | USD 80.06 Billion |
| Growth Rate (2026 - 2031) | 7.61 % |
| Fastest Growing Market | Asia-Pacific |
| Largest Market | North America |
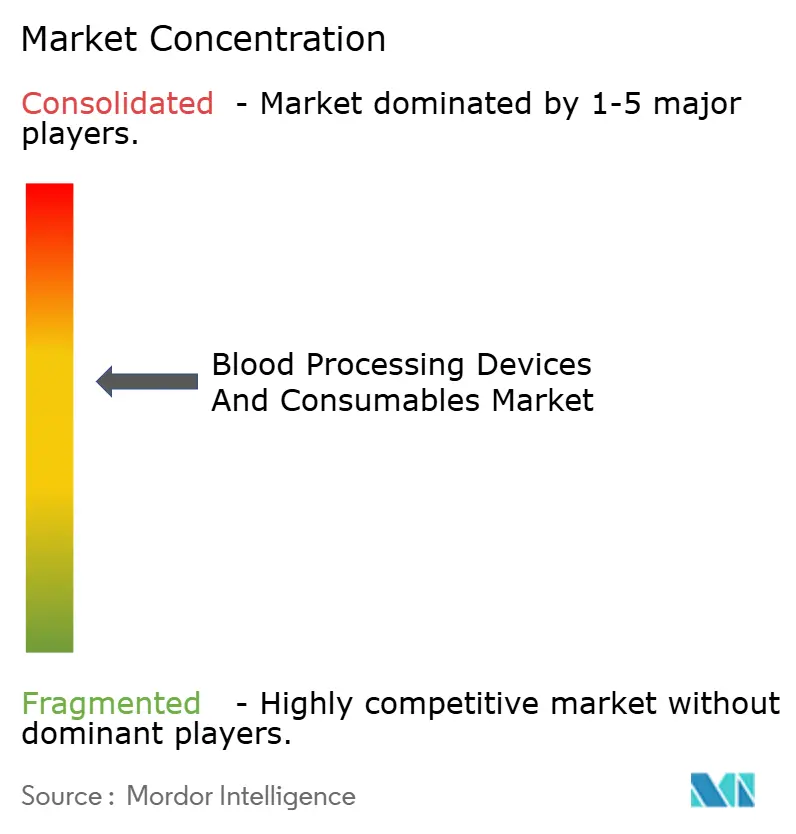
| Market Concentration | Medium |
Major Players *Disclaimer: Major Players sorted in no particular order Image © Mordor Intelligence. Reuse requires attribution under CC BY 4.0. | |
Blood Processing Devices And Consumables Market Analysis by Mordor Intelligence
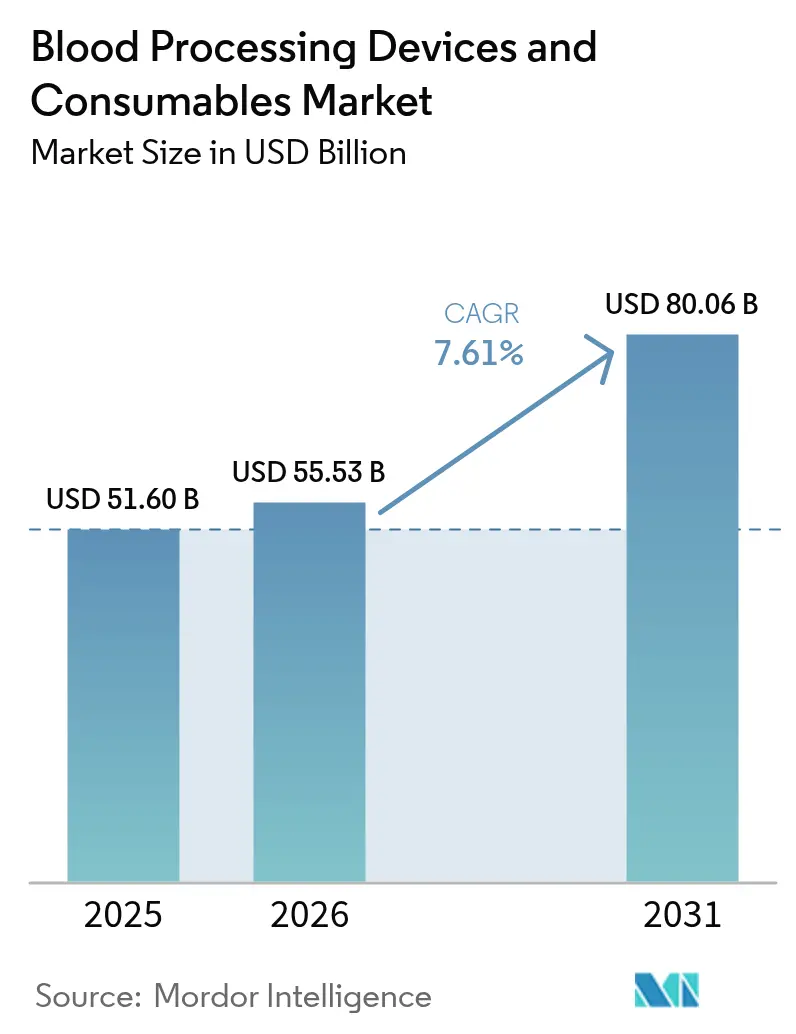
The blood processing devices and consumables market size is expected to grow from USD 51.60 billion in 2025 to USD 55.53 billion in 2026 and is forecast to reach USD 80.06 billion by 2031 at 7.61% CAGR over 2026-2031. Growing transfusion volumes, rapid uptake of automated apheresis systems, and heightened blood safety mandates are accelerating capital spending across blood centers and hospital laboratories. Hospitals are expanding mobile processing capabilities to serve remote locations, while AI-enabled cross-matching and inventory tools are beginning to optimize unit allocation and reduce wastage. Demand is reinforced by a rising geriatric base and by regenerative medicine procedures that rely on highly specialized components. Vendors are responding with modular device platforms, integrated software, and service models designed to boost throughput and lower per-unit processing costs.
Key Report Takeaways
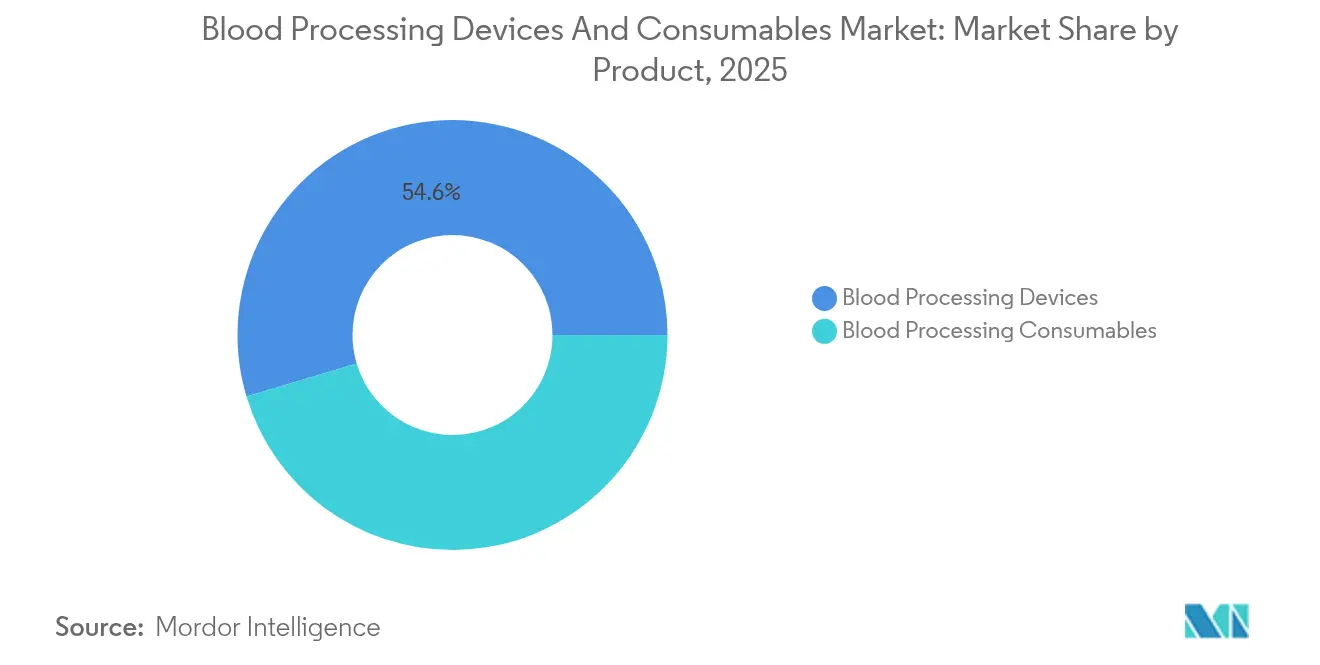
- By product, devices held 54.62% of blood processing devices and consumables market share in 2025, while consumables are expected to post the fastest 9.31% CAGR through 2031.
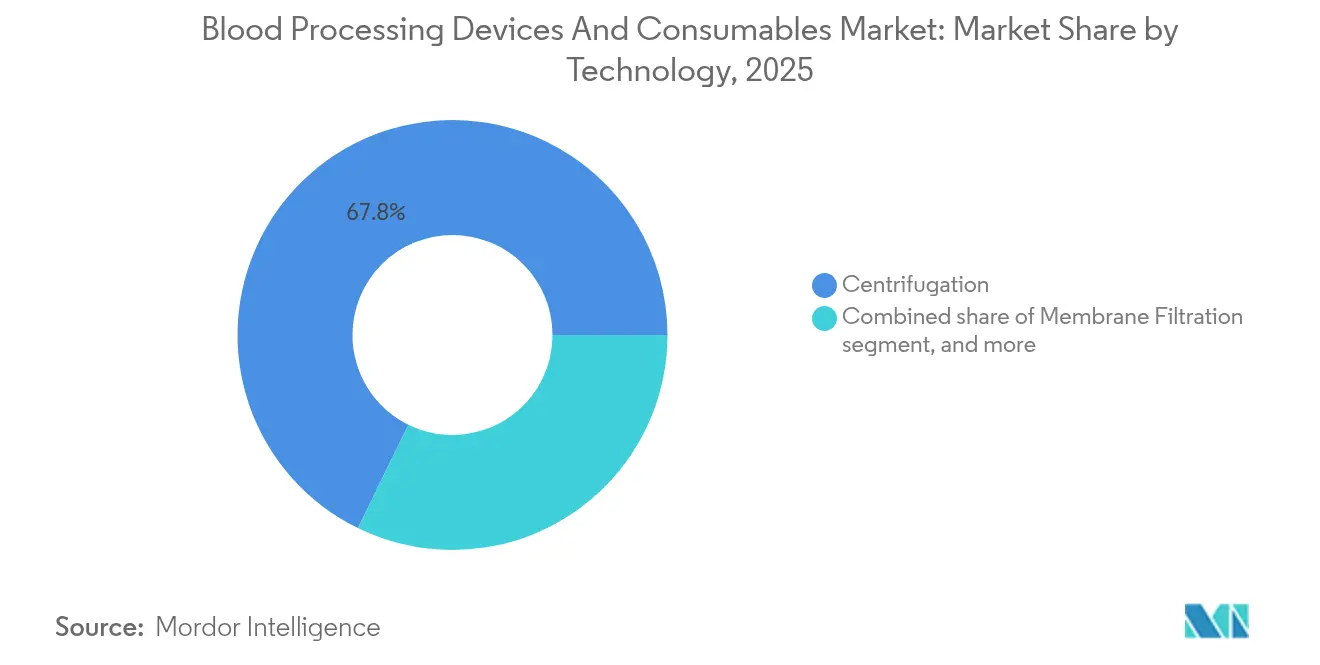
- By technology, centrifugation led with 67.75% revenue share in 2025; AI-enabled cross-matching platforms are expanding at the highest 8.70% CAGR to 2031.
- By end user, hospitals and clinics accounted for 65.60% of blood processing devices and consumables market size in 2025, whereas blood banks and transfusion centers are projected to grow at 9.96% CAGR by 2031.
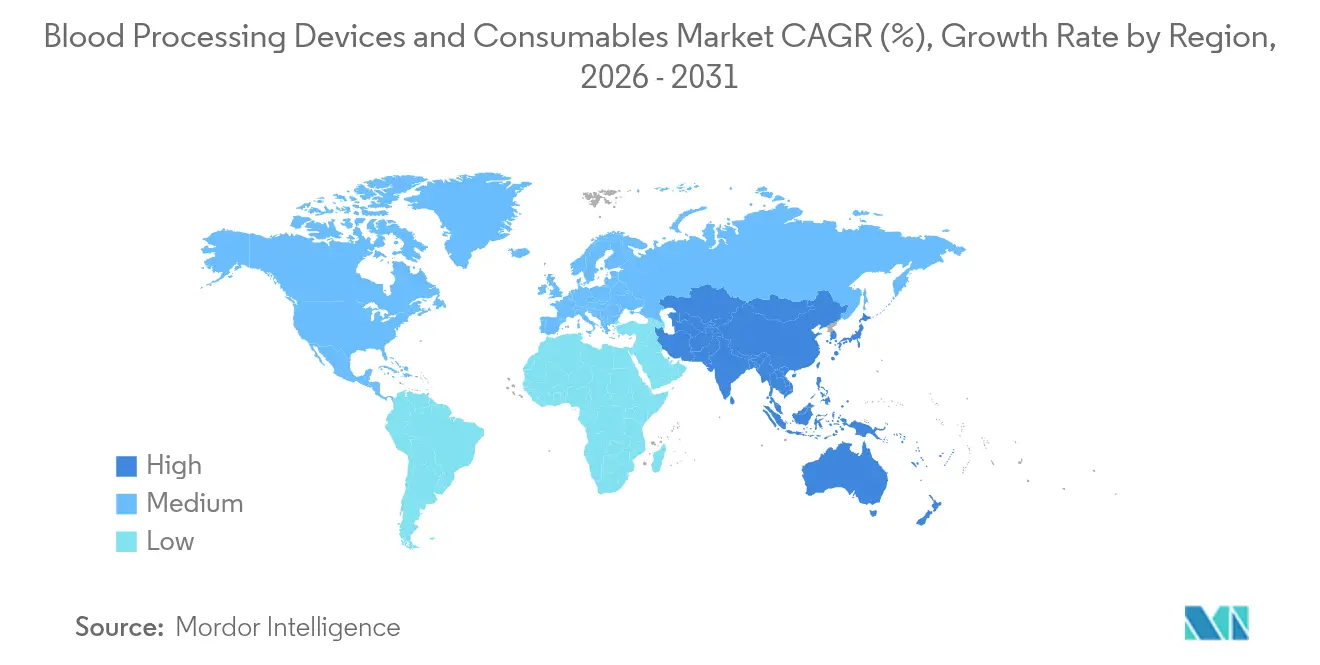
- By geography, North America dominated with 38.10% revenue share in 2025; Asia-Pacific is forecast to record the quickest 8.41% CAGR through 2031.
Note: Market size and forecast figures in this report are generated using Mordor Intelligence’s proprietary estimation framework, updated with the latest available data and insights as of 2026.
Market Trends and Insights
Drivers Impact Analysis of Blood Processing Devices And Consumables Market*
| Driver | (~) % Impact on CAGR Forecast | Geographic Relevance | Impact Timeline |
|---|---|---|---|
| Rising Global Blood Transfusion Demand | +2.1% | Global, with acute needs in emerging markets | Medium term (2-4 years) |
| Growing Geriatric Population Base | +1.8% | North America & Europe core, expanding to Asia-Pacific | Long term (≥ 4 years) |
| Expansion Of Regenerative Medicine And Cell Therapies | +1.5% | North America & EU leading, Asia-Pacific adoption accelerating | Medium term (2-4 years) |
| Government Programs To Enhance Blood Safety Infrastructure | +1.2% | Global, priority focus in developing nations | Long term (≥ 4 years) |
| Technological Advancements In Apheresis And Automation | +0.7% | Developed markets initially, scaling to emerging regions | Short term (≤ 2 years) |
| Increasing Point-Of-Care And Mobile Blood Processing Adoption | +0.2% | Rural and remote areas globally | Medium term (2-4 years) |
| Source: Mordor Intelligence | |||
Rising Global Blood Transfusion Demand
Worldwide transfusion requirements continue to outstrip donations, with the American Red Cross citing a 25% decline in supply even as surgical and trauma cases rise. The World Health Organization confirms that voluntary unpaid donations still contribute less than half of needed units in many low-income regions, underscoring chronic shortfalls[1]. High-yield component separators and automated cold-chain logistics are therefore essential. Taiwan’s teaching hospitals demonstrate best-in-class inventory control, trimming wastage to 0.08% through real-time monitoring. University Hospitals processed 7% more samples in 2024 after automating triage workflows, activating 323 Massive Transfusion Protocols in the same year. These examples illustrate how capacity gains hinge on sophisticated devices and consumables that maximize usable components from every donation.
Growing Geriatric Population Base
United Nations projections show rapidly aging populations across developing economies, converting erstwhile donors into recipients. U.S. healthcare spending rose 7.5% to USD 4.9 trillion in 2023, mainly through Medicare outlays linked to older patients. Blood centers are piloting donor-management systems that safely extend eligibility for seniors to mitigate shrinking youth donor pools. The WHO’s patient blood-management guidelines urge adoption of resource-efficient component processing for anemia in the elderly, spurring uptake of compact cell processors that can run small volumes with minimal wastage. As geriatrics grow, facilities must scale processing while navigating stricter hemovigilance standards.
Expansion of Regenerative Medicine and Cell Therapies
The cell-therapy arena is set to reach USD 26.8 billion by 2033 at 16.9% CAGR, intensifying demand for closed-system apheresis and controlled-rate freezing. Terumo Blood and Cell Technologies created a Global Therapy Innovations unit that combines the Spectra Optia and Quantum Flex platforms, aligning with growth of autologous CAR-T manufacturing. Real-world data on cilta-cel therapy show 89% response in 236 relapsed myeloma cases, many outside pivotal trial criteria, highlighting the escalating volume of patient-specific processing cycles. Such therapies rely on ultra-clean consumables and precision devices, positioning integrated suppliers for premium growth.
Government Programs to Enhance Blood Safety
Regulators worldwide are heightening scrutiny. CMS implemented an 18% CLIA-fee increase from January 2024, while the FDA’s fiscal-year 2025 user-fee schedule adds cost layers for device makers and blood facilities[2]. WHO quality-system blueprints encourage full digital traceability and pathogen-reduced components, stimulating demand for bag sets with RFID tags and rapid pathogen-inactivation kits. Public-private funding programs in Africa and South-East Asia are underwriting regional mega-centers that buy automated centrifuges in bulk, favoring vendors with turnkey installation and training packages.
Restraints Impact Analysis of Blood Processing Devices And Consumables Market*
| Restraints Impact Analysis | (~) % Impact on CAGR Forecast | Geographic Relevance | Impact Timeline |
|---|---|---|---|
| Stringent Regulatory and Quality Compliance Requirements | -1.4% | Global, with varying intensity by region | Long term (≥ 4 years) |
| High Capital and Maintenance Costs of Equipment | -0.9% | Emerging markets primarily; cost pressures in developed regions | Medium term (2-4 years) |
| Limited Reimbursement for Advanced Procedures | -0.6% | Developed markets and higher-income emerging economies | Medium term (2-4 years) |
| Shortage of Skilled Technicians in Low-Resource Settings | -0.4% | Sub-Saharan Africa, parts of South Asia and Latin America | Long term (≥ 4 years) |
| Source: Mordor Intelligence | |||
Stringent Regulatory and Quality-Compliance Requirements
The FDA’s updated donor-eligibility draft guidance expands documentation demands, extending validation cycles and internal audit workloads[3]. WHO technical directives stipulate that every blood establishment must embed quality systems covering donor recruitment through transfusion, forcing smaller centers to invest in bar-coded bags, audit software, and staff certification. While necessary for safety, these rules elevate operating costs and create steep learning curves, discouraging new entrants.
High Capital and Maintenance Costs of Equipment
Laboratory operating budgets often exceed USD 1 million yearly, with service contracts alone costing USD 20,000-50,000. Medicare’s 2.9% outpatient rate increase for 2025 is below inflation, squeezing margins for transfusion services that must still cover consumable and equipment upgrades. Terumo allocated USD 250 million to new manufacturing lines, highlighting the scale of investment needed to remain competitive. Capital intensity thus favors cash-rich incumbents and slows refresh cycles for budget-constrained public hospitals.
*Our forecasts treat driver/restraint impacts as directional, not additive. The impact forecasts reflect baseline growth, mix effects, and variable interactions.
Blood Processing Devices And Consumables Market Segment Analysis
By Product:
Devices Provide the Revenue Base, Consumables Propel Future GrowthDevices contributed 54.62% of blood processing devices and consumables market revenue in 2025, reflecting their indispensability in every transfusion service. FDA clearances for multi-bag automated separators and smart freezers confirm fast innovation. Hospitals prefer modular systems that integrate chilling, mixing, and barcode tracking to slash manual steps. Vendors are embedding predictive-maintenance algorithms that reduce downtime and extend asset life. Operating-lease models are emerging, shifting capex to opex and broadening access in mid-tier facilities.
Consumables, although smaller today, are the chief growth engine at 9.31% CAGR to 2031, making them critical to the long-term trajectory of the blood processing devices and consumables market. Single-use apheresis kits, pathogen-inactivation sleeves, and leukofilters are ordered with every procedure, producing recurring revenue streams. In Asia-Pacific, hospital upgrades and rural outreach programs are boosting baseline demand, while mature markets pivot to premium consumables with RFID and antimicrobial coatings. As a result, disposables producers with localized manufacturing footprints can shorten lead times and cushion currency risks.

By Technology:
Centrifugation Dominates, AI Platforms Shift Testing ProtocolsCentrifugation retained 67.75% of blood processing devices and consumables market share in 2025, underscoring its reliability and cost-effectiveness. Suppliers are refining rotor geometry and sensor arrays to achieve higher platelet yields per spin and reduce red-cell hemolysis. Compact tabletop centrifuges targeting satellite clinics are opening low-volume niches.
AI-enabled cross-matching platforms, expanding at an 8.70% CAGR, introduce algorithm-driven typing, automated image capture, and cloud-based analytics. Early adopters report fewer serology reruns and tighter inventory balance. Integration challenges persist-particularly data-privacy compliance and laboratory-information-system alignment-but pilot installations indicate double-digit time savings on compatibility tests. Over the forecast horizon, hybrid architectures that pair centrifugation for separation with AI for compatibility screening will dominate high-throughput labs, consolidating vendor ecosystems.
By End User:
Hospitals Anchor Demand, Blood Banks Expand the NetworkHospitals and clinics accounted for 65.60% of blood processing devices and consumables market size in 2025, driven by trauma, oncology, and obstetric needs. Operating-room transfusion remains the largest volume generator, prompting hospital labs to invest in rapid-response component processors and near-patient platelet agitators. Integrated health networks are standardizing device fleets across campuses to negotiate bulk consumable pricing and streamline training.
Blood banks and transfusion centers, while capturing a smaller share today, will grow fastest at 9.96% CAGR to 2031, reflecting consolidation into regional mega-centers. Centralized facilities use high-volume separators, robotic bag sealers, and automated storage carousels that lower per-unit costs. Emerging national services in Africa and South-East Asia are adopting this model to comply with WHO mandates. Such growth indicates that the blood processing devices and consumables market will increasingly hinge on specialized centers optimized for scale and compliance.
Geography Analysis
North America Blood Processing Devices and Consumables Market
North America commanded 38.10% of 2025 revenue, leveraging mature infrastructure, stringent but transparent regulation, and USD 4.9 trillion in healthcare spending. Large integrated delivery networks continuously refresh centrifuges, warmers, and compatibility analyzers to meet evolving AABB standards. Abbott’s USD 500 million manufacturing expansion in Illinois and Texas, scheduled to go live by end-2025, will amplify domestic supply of transfusion-diagnostic kits. FDA guidance pipelines foster predictable approval cycles that encourage vendors to pilot next-gen AI algorithms in regional reference labs.
APAC Blood Processing Devices and Consumables Market
Asia-Pacific is the fastest-growing territory at an 8.41% CAGR through 2031, fueled by hospital build-outs, medical tourism, and middle-class insurance uptake. China’s national quality re-certification program for 600 blood centers is accelerating centrifuge and apheresis upgrades. Terumo’s USD 15 million production plant in Hangzhou will assemble local versions of its Reveos system, aligning with provincial procurement preferences. In India and Thailand, public-private partnerships are co-financing regional plasma-fractionation hubs, mandating high-throughput separators and sterile-tube welders.
Europe Blood Processing Devices and Consumables Market
Europe shows steady replacement demand as hospitals tighten cost controls yet pursue pathogen-reduced components to meet new EN standards. Bulk-buying alliances in Germany and France favor suppliers offering multi-year service bundles with uptime guarantees. Eastern European modernization funds tied to EU cohesion budgets are financing first-time adoption of automated component extractors in mid-size cities, broadening the installed base.
MEA, South America and LATAM Blood Processing Devices and Consumables Market
Middle East & Africa and South America provide incremental upside though infrastructure gaps persist. Gulf states invest in cutting-edge robotics to support tertiary-care hubs, while Sub-Saharan Africa leans on donor-funded mega-centers outfitted with rugged centrifuges and solar-powered storage. Latin America’s private hospital chains are upgrading compatibility analyzers to win medical-tourism contracts. Across these regions, vendors that offer flexible financing and on-site training gain competitive traction.
Regulatory Landscape
Blood processing devices and consumables operate under tightly controlled safety and quality regimes that cover both device regulation and blood establishment requirements, including traceability. In the United States, the FDA applies special controls and device-specific guidance for automated blood cell separator devices that use centrifugal or filtration separation principles. Blood and blood components are governed through a framework that includes 21 CFR parts for establishment registration, current good manufacturing practice, and donor eligibility documentation.
A key compliance shift is the FDA Quality Management System Regulation (QMSR), which aligns quality-system expectations by incorporating ISO 13485:2016 by reference into 21 CFR Part 820. This increases the premium on harmonized design controls, supplier qualification, and post-market vigilance across global product portfolios. In Europe, blood processing devices fall under the EU Medical Device Regulation (MDR 2017/745), where Annex VIII classification rules (including Rule 2 for storage/channeling devices and Rule 14 for devices incorporating ancillary medicinal substances such as certain additive solutions used with blood bags) can raise the conformity-assessment burden and increase notified-body engagement. Separately, the EU SoHO Regulation (EU) 2024/1938, effective June 2024, strengthens quality and safety expectations for substances of human origin, tightening the compliance environment for blood establishments and reinforcing demand for validated, traceable processing workflows and compliant single-use sets.
Value Chain Analysis
The value chain starts with upstream inputs such as medical-grade polymers (for example PET/PVC for bags and housings), elastomers (bromobutyl rubber), silicone components, and specialized filtration media. This is followed by device and consumable manufacturing, sterilization (often dependent on ethylene oxide capacity), QA and release testing, and packaging under regulated quality systems.
Midstream, OEMs and brand owners integrate hardware (centrifuges, apheresis systems, analyzers, warmers, and cold storage) with proprietary single-use kits, tubing, and filters. Qualification through regulatory submissions and validation extends lead times and increases supplier-management requirements. Downstream distribution typically runs through direct sales and service organizations for capital equipment, while consumables are supplied via contracted procurement to hospitals, diagnostic laboratories, and blood banks and transfusion centers. The chain remains exposed to periodic bottlenecks from single-source plastics and sterilization constraints, which has driven greater emphasis on localized manufacturing, multi-sourcing of critical polymers, and tighter demand planning with large blood networks. Recent approvals and contracting activity around advanced processing platforms and compliant disposables show how regulatory milestones translate into supply commitments and installed-base pull-through for recurring consumables.
Competitive Landscape
The blood processing devices and consumables market is moderately consolidated. Abbott Laboratories leads with 14.0% 2024 share, followed by Terumo Corporation at 12.0%, Grifols S.A. at 11.0%, Haemonetics Corporation at 10.0%, and F. Hoffmann-La Roche AG at 9.0%. These five control 56% of global revenue, yet niche innovators are eroding share through AI software and synthetic blood research.
Strategic investments underscore the race for scale. Grifols posted record EUR 6.592 billion revenue in 2023 and appointed a new CEO to sharpen operational efficiency amid a prospective EUR 7 billion takeover bid by Brookfield. Haemonetics divested its whole-blood product line to GVS for USD 67.8 million in January 2025 to redirect resources toward higher-margin apheresis systems. Terumo’s Reveos platform, capable of processing four units of whole blood simultaneously, lowers manual steps by 65% and is being adopted in a 10-year agreement with Sanquin in the Netherlands, illustrating how automation differentiates suppliers.
Partnerships and OEM deals extend reach. Siemens Healthineers renewed a global OEM pact with Sysmex for hemostasis instruments and reagents, leveraging 25 years of collaboration to address rising thrombotic-disease testing needs. In addition, Thermo Fisher’s USD 4.1 billion acquisition of Solventum’s purification unit enhances its filtration portfolio, enabling bundled offerings for plasma-fractionation customers.
Emerging disruptors pursue artificial blood substitutes. Japanese university consortia report hemoglobin-based products with two-year shelf life and universal compatibility, while Israel’s RedC Biotech is scaling lab-grown red cells under pharma partnerships. Although pre-commercial, such breakthroughs could compress demand for donated units, prompting incumbents to hedge through R&D alliances.
Blood Processing Devices And Consumables Industry Leaders
-
Abbott Laboratories
-
F. Hoffmann-La Roche AG
-
Terumo Corporation (Terumo BCT)
-
Grifols S.A.
-
Haemonetics Corporation
- *Disclaimer: Major Players sorted in no particular order
Blood Processing Devices And Consumables Market Companies Covered in this Report
- Abbott Laboratories
- Roche
- Terumo Corporation (Terumo BCT)
- Grifols
- Haemonetics
- Danaher
- Beckton Dickinson
- Fresenius
- Asahi Kasei
- Baxter
- Bio-Rad Laboratories
- bioMérieux
- Immucor
- MacoPharma
- Siemens Healthineers
- Thermo Fisher Scientific
- B. Braun
- 3M
- Cardinal Health
- Barkey
- Avantor Inc.
Read Analysis of Blood Processing Devices And Consumables Companies
Market Opportunities and Future Outlook
Automation and higher-throughput processing are a key whitespace area for blood centers and hospital laboratories, especially as they balance labor constraints with compliance-driven traceability. One set of proof points comes from blood-center adoption of automated whole-blood processing and separation platforms. For example, SunCoast Blood Centers deployed FDA-cleared automation (Reveos) to separate whole blood into components, and vendor product development continues to target measurable component-quality gains. This supports demand for integrated device-plus-consumable solutions, including multi-bag sets, leukoreduction pathways, and barcode or RFID-enabled traceability, alongside service models aimed at maintaining uptime and standardizing workflows across multi-site health systems.
Pathogen reduction, pre-hospital transfusion support, and improved storage biology are also expanding into adjacent growth lanes that depend on specialized consumables and compatible processing devices. In Europe, Cerus signed a four-year supply agreement with the French Blood Establishment (EFS) for the INTERCEPT Blood System and its INT200 illumination device, reinforcing multi-year procurement around pathogen-reduction workflows. In the United States, FDA clearances for newer processing and collection solutions, including expanded-use clearance for the Hemanext ONE System and clearance activity for plasma-collection disposables and systems from major suppliers, point to active product-cycle upgrading tied to safety, efficiency, and component-quality outcomes rather than incremental replacement alone.
Recent Industry Developments in Blood Processing Devices And Consumables Market
- June 2026: Grifols announced Evanzys IH, a next-generation automated system for immunohematology sample analysis, introduced around the ISBT Congress. The launch strengthens Grifols position in automated transfusion-medicine laboratory workflows, where throughput, standardization, and connectivity shape competitive differentiation.
- February 2026: Terumo Blood and Cell Technologies highlighted SunCoast Blood Centers implementation of FDA-cleared whole-blood automation using the Reveos system to separate whole blood into red blood cells, plasma, and platelets. The deployment signals accelerating replacement of manual component processing with automated platforms that can improve consistency and help blood centers manage staffing and volume pressures.
- January 2025: Thermo Fisher Scientific agreed to acquire Solventum's purification and filtration unit for USD 4.1 billion. The deal expands Thermo Fisher's filtration capabilities relevant to blood and plasma processing workflows and supports bundled offerings to customers that manage high-volume separation and purification steps.
Blood Processing Devices And Consumables Market Report Scope and Research Methodology
Market Definition and Coverage
For this report, the market counts the revenue generated from equipment and disposable supplies used to process whole blood and blood components, starting from collection and separation and then moving through preparation, storage, and pre-transfusion handling across clinical settings.
Scope exclusions: We exclude general lab test kits and routine diagnostic reagents that do not participate in blood processing, along with direct-to-consumer finger-stick testing products.
Segments Covered in This Report
- By Product
- Blood Processing Devices
- Blood Bank Freezers
- Blood Grouping Analyzers
- Blood Warmers
- Blood Cell Processors
- Other Blood Processing Devices
- Blood Processing Consumables
- Blood Bags
- Disposable Apheresis Kits
- Blood Lancets
- Vials & Collection Tubes
- Blood Administration Sets
- Other Consumables
- Blood Processing Devices
- By Technology
- Centrifugation
- Membrane Filtration
- Automated Robotic Processing
- AI-Enabled Cross-Matching Platforms
- By End User
- Hospitals and Clinics
- Diagnostic Laboratories
- Blood Banks & Transfusion Centers
- Other End Users
- Geography
- North America
- United States
- Canada
- Mexico
- Europe
- Germany
- United Kingdom
- France
- Italy
- Spain
- Rest of Europe
- Asia-Pacific
- China
- Japan
- India
- Australia
- South Korea
- Rest of Asia-Pacific
- Middle East & Africa
- GCC
- South Africa
- Rest of Middle East & Africa
- South America
- Brazil
- Argentina
- Rest of South America
- North America
Data Sources, Market Sizing, and Validation
Desk Research
Desk work starts with mapping how blood moves through hospitals, blood banks, and transfusion services, and then linking that workflow to device and consumable demand. Public sources anchor the demand pool, including WHO blood safety and transfusion publications, national blood service dashboards, and health agency statistics such as CDC or similar country-level health departments. We also review hospital and public procurement portals, medical device safety communications, and peer-reviewed journals that cover transfusion practices, leukoreduction, and pathogen reduction adoption.
To keep the pricing and volume logic realistic, we use company annual reports, investor presentations, and product catalogs to understand what is sold and how it is packaged (for example, whether disposables are bundled with instruments). Paid subscriptions are used in a limited way for company financials and business intelligence, plus patent databases to see where product development is concentrated and which functions are being prioritized. These sources are then cross-checked against reputable press coverage and association websites tied to transfusion medicine. The desk sources listed here are illustrative and not exhaustive, and we also used other public references for data collection, validation, and clarification.
Primary Interviews and Surveys
Primary interviews and surveys focused on validating what gets purchased, how often disposables are replaced, and what drives upgrades in blood processing equipment, because these details are often missing from public datasets. We spoke with transfusion service leaders, blood bank operators, lab managers, and distribution-side contacts across major regions, and this input helped pressure-test utilization rates, average selling price ranges, and the timing of adoption for newer processing steps.
Distribution of primary research fieldwork respondents
| Company type | Respondent position | Region |
|---|---|---|
| Top tier: 35% | CXOs: 12% | APAC: 41% |
| Mid tier: 51% | Functional/Unit leaders: 28% | EMEA: 33% |
| Smaller Players: 14% | Managers: 60% | Americas: 26% |
Market-Sizing & Forecasting
The sizing logic starts with a top-down build where transfusion and donation activity, along with blood component preparation volumes, are used to reconstruct the likely demand for processing steps and the related device plus consumable spend. Once that demand pool is formed, we translate it into value using practical inputs such as separation and component preparation rates, share of leukoreduced units, adoption of pathogen reduction, installed base replacement cycles for key equipment, and typical utilization rates in blood banks versus hospitals.
To keep the totals grounded, the model is then corroborated using selective bottom-up checks, like sampled average selling prices multiplied by estimated unit volumes for common consumable sets, and supplier-side revenue splits where they are available in public filings. Where a clean bottom-up path is not possible (for example, when consumables are bundled or sold through distributors), gaps are handled through channel checks and normalized price bands that are re-validated in interviews. Forecasts are produced using scenario analysis supported by expert views on donation growth, hospital procedure recovery patterns, and the pace of automation and safety-related upgrades, and then we run sensitivity checks so one variable does not overdrive the outcome.
Data Validation & Update Cycle
Before finalizing, outputs are compared against independent signals such as blood collection volumes, transfusion procedure indicators, and publicly observable procurement activity, which helps confirm that growth direction and scale are consistent. Any outliers are reviewed again by analysts, and the key assumptions are revisited when the variance cannot be explained through a documented scope change or price movement.
We also re-contact select interviewees when there are major shifts, such as new safety requirements, supply constraints, or step-changes in adoption of pathogen reduction, since these can affect both volumes and pricing quickly. Reports are refreshed annually, with interim updates when material events occur, and a final pre-delivery review is done so clients receive the most current view that can be supported by traceable inputs.
Mordor Intelligence's Blood Processing Devices and Consumables Market Sizing Compared With Other Published Estimates
Published market sizes for this space often differ, mainly because the boundaries between collection, processing, and testing are not identical across sources, and because some studies treat consumables as a narrow add-on rather than a recurring revenue stream. Differences in the base year, currency timing, and how pricing is moved forward also create noticeable spreads even when the growth story is similar.
The benchmark table shows a clear range in reported 2026 values, and in Mordor Intelligence's model the scope is limited to devices and consumables that directly support blood separation, preparation, storage, and pre-transfusion handling, which avoids mixing in adjacent diagnostic-only spend that can inflate totals.
Benchmark comparison
| Source | Market Size | Gaps in Research Methodology |
|---|---|---|
| Mordor Intelligence | USD 55.53 B (2026) | |
| Industry Publication A | USD 45.26 B (2024) | Uses an earlier base year and appears to apply a narrower product mix, with limited clarity on whether recurring consumable sets and filters are fully counted across end users. |
| Market Portal B | USD 43.47 B (2024) | Shows a 2024 starting point and likely blends regional focus with global extrapolation, and the treatment of bundled disposables and distributor markups is not transparently explained. |
When the scope is tightened to workflow-linked processing spend, and when pricing and utilization assumptions are checked with field feedback, the size outcome becomes easier to reconcile with real-world procurement and activity levels. The remaining gap across sources is mostly explained by what gets counted as processing, how consumables are treated, and the year and currency conventions used to present the result.
Key Questions Answered in the Report
What is the current size of the blood processing devices and consumables market, and how large will it be by 2031?
The market stands at USD 55.53 billion in 2026 and is on course to hit USD 80.06 billion by 2031, reflecting a 7.61% CAGR over 2026-2031.
Which product segment is expanding the fastest?
Consumables-such as apheresis kits and blood bags-are projected to grow at a 9.31% CAGR through 2031, outpacing devices.
Which region offers the highest growth opportunity for suppliers?
Asia-Pacific delivers the quickest expansion, with an 8.41% CAGR driven by hospital build-outs, medical tourism, and quality-system upgrades.
What technology is most likely to disrupt conventional blood processing workflows?
AI-enabled cross-matching platforms, growing at 8.70% CAGR, automate compatibility testing and tighten inventory control.
Who are the market leaders, and how concentrated is the competitive landscape?
Abbott, Terumo, Grifols, Haemonetics, and Roche collectively hold 56.0% share, signaling moderate concentration and active competition.
What primary challenge could restrain near-term market growth?
Stringent regulatory compliance and rising equipment costs inflate operating budgets, especially for smaller or emerging-market facilities.